Cities of London and Westminster (UK Parliament constituency)
| Cities of London and Westminster | |
|---|---|
|
Borough constituency for the House of Commons | |
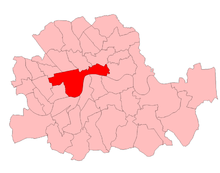
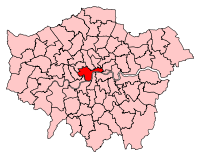 Boundary of Cities of London and Westminster in Greater London. | |
| County | Greater London |
| Population | 110,000 (2011 census)[1] |
| Electorate | 65,140 (December 2010)[2] |
| Current constituency | |
| Created | 1950 |
| Member of parliament | Mark Field (Conservative) |
| Number of members | One |
| Created from | City of London (1298–1950), Westminster Abbey, Westminster St George's |
| Overlaps | |
| European Parliament constituency | London |
Cities of London and Westminster is a constituency returning a single Member of Parliament (MP) to the House of Commons in the United Kingdom Parliament. It is a borough constituency for the purposes of election expenses and type of returning officer. As with all constituencies, the election is decided using the first past the post system of election. Since its creation at the 1950 general election, the constituency has always elected the candidate nominated by the Conservative Party. It has been represented since 2001 by Mark Field.
History
Before 1950 the City of London formed a two-member constituency on its own. The Boundary Commission for England began reviewing constituencies in January 1946 using rules defined under the Representation of the People Act 1944, which excluded the City of London from the redistribution procedure;[3][4] the Commission recommended that the borough of Chelsea and the City of Westminster form a single Parliamentary Borough of Chelsea and Westminster with two divisions.[5]
In February 1948 the Government brought forward a new Representation of the People Bill which removed the right of owners of business premises to a second vote; this would have had the effect of reducing the electorate of the City of London from 12,500 to 4,600. The Bill proposed also to end the City of London as a separate constituency and to merge it with the adjacent boroughs of Finsbury and Shoreditch.[6] During debates on the Bill, the Government amended it to substitute a link between the City of London and the City of Westminster.[7] In introducing the amendment the Home Secretary James Chuter Ede noted that the alterations to the constituencies in Westminster, Chelsea and Kensington had been agreed unanimously at a conference between the Members of Parliament and representatives of the boroughs affected.[8]
Boundary change proposals
No alteration was made by the First Periodical Report on constituency boundaries in 1954.[9] In the Second Periodical Report in 1969, the Boundary Commission wrote that their initial feelings were that "except for a minor alteration to follow a new ward boundary" they felt that there was "no reason to disturb" the constituency, and they received no objections to this proposal. Westminster City Council later suggested that the constituency could be more accurately named as 'The City of London and Westminster South'; the Boundary Commission found opinion divided and left the name unchanged when it published revised proposals for two other constituencies within the City. Subsequent representations on the name were received and the Commission decided that, although justified on historical grounds, the name was "not now entirely accurate" and so proposed the renaming as suggested by the City Council.[10]
In initial proposals during the Third Periodical Review (1983), the Boundary Commission proposed to abolish the St Marylebone constituency and add four wards from it (Cavendish, Baker Street, Bryanston and Regents Park) to the previous City of London and Westminster South constituency; they provisionally named the result 'The City of London and Westminster'. After a local inquiry, the Regents Park ward was removed and Hyde Park ward (from the Paddington constituency) was added; unanimous opinion at the inquiry favoured naming the result 'The City of London and Westminster South'.[11]
For the Fourth Periodical Review (1995), the Boundary Commission paired the City of Westminster with the Royal Borough of Kensington and Chelsea for consideration. The Commission's initial proposals, to expand the constituency by two wards (Bayswater and Lancaster Gate) formerly in Westminster North and to return to the name 'Cities of London and Westminster', were upheld after a local inquiry, despite multiple counter-proposals.[12]
Boundary change proposals from 2007-present
At the Fifth Periodical Review (in 2007), the initial proposals of the Boundary Commission paired the City of Westminster with the London Borough of Brent although they involved only minor changes to the Cities of London and Westminster constituency to take account of new ward boundaries. Widespread objections ("almost universal hostility") to the pairing led to a local inquiry, which decided that Westminster and the City of London should be reviewed separately and not paired with any other borough. The Commission proposed a new Cities of London and Westminster constituency in which the revised Bayswater and Lancaster Gate wards were removed.[13]
Early proposals made during the initial stages of the postponed Sixth Periodic Review of Westminster constituencies proposed linking the City of London to the southern wards of Islington in a constituency to be known as "The City of London and Islington South".[14] Most of the Westminster wards were proposed to form part of a Westminster and Kensington constituency.[15] This proposal was the first to suggest a split between the two Cities in Parliamentary elections since they were joined and proved unpopular in consultation; the Boundary Commission revised them to return the link between the City of London and the City of Westminster,[16] although the review was subsequently placed on hiatus.
In 2016 the Boundary Commission produced a second attempt at the Sixth Periodic Review. Its proposed Cities of London and Westminster comprises the City attached to Regent's Park and Abbey Road to the north-west, Knightsbridge/Belgravia to the west, and Holborn/Covent Garden to the north.[17]
London Assembly constituency
Although united for Parliamentary elections, in the London Assembly, the City of London is covered by the City and East constituency, and the area in Westminster by the West Central constituency. The Local Government Commission for England argued that "combining the City of London with areas to its east could assist in focussing regeneration eastwards" and linked it with the London Borough of Tower Hamlets, the London Borough of Newham, and the London Borough of Barking and Dagenham.[18]
Boundaries
1950-1974: The Metropolitan Borough of Westminster, and the City of London.
1974-1983: The City of Westminster wards of Charing Cross, Churchill, Knightsbridge, Millbank, Regent Street, Victoria Street, and Warwick, and the City of London.
1983-1997: The City of Westminster wards of Baker Street, Belgrave, Bryanston, Cavendish, Churchill, Hyde Park, Knightsbridge, Millbank, St George's, St James's, Victoria, and West End, and the City of London.
1997-2010: The City of Westminster wards of Baker Street, Bayswater, Belgrave, Bryanston, Cavendish, Churchill, Hyde Park, Knightsbridge, Lancaster Gate, Millbank, St George's, St James's, Victoria, and West End, and the City of London.
2010-present: The City of Westminster wards of Bryanston and Dorset Square, Churchill, Hyde Park, Knightsbridge and Belgravia, Marylebone High Street, St James’s, Tachbrook, Vincent Square, Warwick, and West End, and the City of London.
The seat covers the entire City of London and most of the City of Westminster lying South of the Marylebone Road and the Westway. In the latter more residential city it covers Westminster, Pimlico, Victoria, Belgravia, Knightsbridge, St. James's, Soho, most of Covent Garden, parts of Fitzrovia, Marylebone, Edgware Road, Paddington and Bayswater.
Constituency profile
The Cities of London and Westminster seat contains the two historical centres of the capital. The City of London is an international financial centre - while Westminster, home to the Houses of Parliament, Whitehall and Downing Street, represents Britain's political and cultural heart.
The seat includes iconic landmarks such as Buckingham Palace and St Paul's Cathedral, the West End's Theatreland and Soho. Some of the country's wealthiest residents live in exclusive Mayfair, Belgravia and Knightsbridge. Less than half the population was born in the UK - a fifth hail from Europe, while one in twenty is American, according to ONS 2011 Census figures for England and Wales.
Around half of the electorate are in the more socially mixed areas of Paddington and Pimlico which includes some large council estates (Churchill Gardens and Millbank Estate).
The Westminster City Council wards are heavily represented by the Conservatives; in the most recent elections in 2018 the Labour Party won two seats in the Churchill ward in the constituency, and one in West End ward.
The constituency also incorporates the City of London council. This includes some of the lowest populated wards in the United Kingdom, such as the Coleman Street ward which has a total electorate of 2 and the Aldgate ward which has a total electorate of 27. [19]
Members of Parliament
Election results
Named Cities of London and Westminster from 1997 to date
Elections in the 2010s
| Party | Candidate | Votes | % | ± | |
|---|---|---|---|---|---|
| Conservative | Mark Field | 18,005 | 46.6 | -7.5 | |
| Labour | İbrahim Doğuş | 14,857 | 38.4 | +11.0 | |
| Liberal Democrat | Bridget Fox | 4,270 | 11.1 | +4.1 | |
| Green | Lawrence McNally | 821 | 2.1 | -3.3 | |
| UKIP | Anil Bhatti | 426 | 1.1 | -4.1 | |
| Independent politician | Tim Lord | 173 | 0.4 | N/A | |
| Independent | Ankit Love The Maharaja of Kashmir | 59 | 0.2 | N/A | |
| Young People's | Benjamin Weenen | 43 | 0.1 | N/A | |
| Majority | 3,148 | 8.1 | -18.6 | ||
| Turnout | 38,654 | 62.8 | +3.5 | ||
| Registered electors | 61,533 | ||||
| Conservative hold | Swing | -9.25 | |||
| Party | Candidate | Votes | % | ± | |
|---|---|---|---|---|---|
| Conservative | Mark Field | 19,570 | 54.1 | +1.9 | |
| Labour | Nik Slingsby | 9,899 | 27.4 | +5.2 | |
| Liberal Democrat | Belinda Brooks-Gordon | 2,521 | 7.0 | -13.5 | |
| Green | Hugh Small | 1,953 | 5.4 | +3.4 | |
| UKIP | Robert Stephenson | 1,894 | 5.2 | +3.4 | |
| CISTA | Edouard-Henri Desforges | 160 | 0.4 | N/A | |
| Christian Peoples | Jill McLachlan | 129 | 0.4 | N/A | |
| Class War | Adam Clifford | 59 | 0.2 | N/A | |
| Majority | 9,671 | 26.7 | -3.3 | ||
| Turnout | 36,185 | 59.3 | +3.8 | ||
| Registered electors | 60,992 | ||||
| Conservative hold | Swing | -1.6 | |||
| Party | Candidate | Votes | % | ± | |
|---|---|---|---|---|---|
| Conservative | Mark Field | 19,264 | 52.2 | +3.9 | |
| Labour | Dave Rowntree | 8,188 | 22.2 | -3.1 | |
| Liberal Democrat | Naomi Smith | 7,574 | 20.5 | +2.0 | |
| Green | Derek Chase | 778 | 2.1 | -2.2 | |
| UKIP | Paul Weston | 664 | 1.8 | +0.7 | |
| English Democrat | Frank Roseman | 191 | 0.5 | N/A | |
| Independent | Dennis Delderfield | 98 | 0.3 | N/A | |
| Pirate | Jack Nunn | 90 | 0.2 | N/A | |
| Independent | Mad Cap'n Tom | 84 | 0.2 | N/A | |
| Majority | 11,076 | 30.0 | +7.8 | ||
| Turnout | 36,931 | 55.5 | +4.4 | ||
| Registered electors | 66,849 | ||||
| Conservative hold | Swing | +3.5 | |||
Elections in the 2000s
| Party | Candidate | Votes | % | ± | |
|---|---|---|---|---|---|
| Conservative | Mark Field | 17,260 | 47.3 | +1.0 | |
| Labour | Hywel Lloyd | 9,165 | 25.1 | −8.0 | |
| Liberal Democrat | Marie-Louise Rossi | 7,306 | 20.0 | +4.6 | |
| Green | Tristan Smith | 1,544 | 4.2 | +0.3 | |
| UKIP | Colin Merton | 399 | 1.1 | –0.3 | |
| Independent | Brian Haw | 298 | 0.8 | N/A | |
| Christian Peoples | Jillian McLachlan | 246 | 0.7 | N/A | |
| Veritas | David Harris | 218 | 0.6 | N/A | |
| Independent | Cass Cass-Horne | 51 | 0.1 | N/A | |
| Majority | 8,095 | 22.2 | +9.0 | ||
| Turnout | 36,487 | 50.3 | +3.1 | ||
| Registered electors | 71,935 | ||||
| Conservative hold | Swing | +4.5 | |||
| Party | Candidate | Votes | % | ± | |
|---|---|---|---|---|---|
| Conservative | Mark Field | 15,737 | 46.3 | –0.9 | |
| Labour | Michael Katz | 11,238 | 33.1 | –2.0 | |
| Liberal Democrat | Martin Horwood | 5,218 | 15.4 | +3.1 | |
| Green | Hugo Charlton | 1,318 | 3.9 | N/A | |
| UKIP | Colin Merton | 464 | 1.4 | +0.9 | |
| Majority | 4,499 | 13.2 | +1.0 | ||
| Turnout | 33,975 | 47.2 | –7.0 | ||
| Registered electors | 71,935 | ||||
| Conservative hold | Swing | +0.5 | |||
Elections in the 1990s
| Party | Candidate | Votes | % | ± | |
|---|---|---|---|---|---|
| Conservative | Peter Brooke | 18,981 | 47.3 | –12.0 | |
| Labour | Kate Green | 14,100 | 35.1 | +11.0 | |
| Liberal Democrat | Michael Dumigan | 4,933 | 12.3 | –1.8 | |
| Referendum | Alan Walters | 1,161 | 2.9 | N/A | |
| Independent | Patricia Wharton | 266 | 0.7 | N/A | |
| UKIP | Colin Merton | 215 | 0.5 | N/A | |
| Natural Law | Richard Johnson | 176 | 0.4 | +0.1 | |
| Monster Raving Loony | Nicholas Walsh | 138 | 0.3 | -0.1 | |
| Hemp Coalition | Gordon Webster | 112 | 0.3 | N/A | |
| Rainbow Dream Ticket | Jerry Sadowitz | 73 | 0.2 | N/A | |
| Majority | 4,881 | 12.2 | -26.3 | ||
| Turnout | 40,155 | 54.2 | -8.9 | ||
| Registered electors | 74,035 | ||||
| Conservative win (new seat) | |||||
Named City of London and Westminster South between 1974 and 1992
| Party | Candidate | Votes | % | ± | |
|---|---|---|---|---|---|
| Conservative | Peter Brooke | 20,938 | 60.3 | +2.5 | |
| Labour | Charlie Smith | 7,569 | 21.8 | +1.4 | |
| Liberal Democrat | Jane Smithard | 5,392 | 15.3 | –6.5 | |
| Green | Guy Herbert | 458 | 1.3 | N/A | |
| Monster Raving Loony | Peter Stockton | 147 | 0.4 | N/A | |
| Irish Freedom Movement | Alex Farrell | 107 | 0.3 | N/A | |
| Natural Law | Richard Johnson | 101 | 0.3 | N/A | |
| Majority | 13,369 | 38.5 | +2.5 | ||
| Turnout | 34,712 | 63.1 | +4.9 | ||
| Registered electors | 55,021 | ||||
| Conservative hold | Swing | ||||
Elections in the 1980s
| Party | Candidate | Votes | % | ± | |
|---|---|---|---|---|---|
| Conservative | Peter Brooke | 19,333 | 57.8 | −1.3 | |
| Liberal | Jane Smithard | 7,291 | 21.8 | +0.8 | |
| Labour | Ruth Bush | 6,821 | 20.4 | +3.3 | |
| Majority | 12,042 | 36.0 | -2.1 | ||
| Turnout | 33,445 | 58.2 | +6.4 | ||
| Registered electors | 57,428 | ||||
| Conservative hold | Swing | ||||
| Party | Candidate | Votes | % | ± | |
|---|---|---|---|---|---|
| Conservative | Peter Brooke | 20,754 | 59.1 | -1.6 | |
| Liberal | Adrian Walker-Smith | 7,367 | 21.0 | +8.8 | |
| Labour | Stephen Jones | 6,013 | 17.1 | -8.4 | |
| Ecology | Roger Shorter | 419 | 1.2 | N/A | |
| National Front | Anthony Reeve | 258 | 0.7 | -1.0 | |
| Communist | A. W. Spence | 161 | 0.5 | N/A | |
| Independent - Pro Nuclear War Gay Rights | Victor Litvin | 147 | 0.4 | N/A | |
| Majority | 13,387 | 38.1 | +2.9 | ||
| Turnout | 35,119 | 51.8 | -3.4 | ||
| Registered electors | 67,773 | ||||
| Conservative hold | Swing | ||||
Elections in the 1970s
| Party | Candidate | Votes | % | ± | |
|---|---|---|---|---|---|
| Conservative | Peter Brooke | 16,851 | 60.7 | +9.0 | |
| Labour | R. Profitt | 7,067 | 25.5 | -5.5 | |
| Liberal | H. Ball-Wilson | 3,375 | 12.2 | -2.7 | |
| National Front | K. Mathews | 478 | 1.7 | -0.8 | |
| Majority | 9,784 | 35.2 | +14.4 | ||
| Turnout | 27,771 | 55.2 | +2.0 | ||
| Registered electors | 50,357 | ||||
| Conservative hold | Swing | ||||
| Party | Candidate | Votes | % | ± | |
|---|---|---|---|---|---|
| Conservative | Peter Brooke | 11,926 | 55.49 | +3.79 | |
| Labour | Malcolm Noble | 3,997 | 18.60 | -12.40 | |
| Liberal | Angus Scrimgeour | 1,981 | 9.22 | -5.68 | |
| National Front | Paul Kavanagh | 1,051 | 4.89 | +2.39 | |
| Pro-Homosexual Civil Rights | Peter Mitchel | 449 | 2.09 | N/A | |
| National Party | Michael Lobb | 364 | 1.69 | N/A | |
| New Britain | Dennis Delderfield | 306 | 1.42 | N/A | |
| Air, Road, Public Safety, White Resident | Bill Boaks | 61 | 0.28 | N/A | |
| Christian Outreach to Britain, Anti-Pornography | William Thompson | 43 | 0.20 | N/A | |
| Christ, Crown, Country, Commonwealth, Christian Constitution | Ralph Herbert | 37 | 0.17 | N/A | |
| Majority | 7,929 | 39.23 | +18.43 | ||
| Turnout | 20,215 | 39.60 | -15.60 | ||
| Registered electors | |||||
| Conservative hold | Swing | ||||
| Party | Candidate | Votes | % | ± | |
|---|---|---|---|---|---|
| Conservative | Christopher Tugendhat | 14,350 | 51.7 | -1.5 | |
| Labour | Phil Turner | 8,589 | 31.0 | +3.7 | |
| Liberal | T. G. Underwood | 4,122 | 14.9 | -4.0 | |
| National Front | D. Baxter | 686 | 2.5 | N/A | |
| Majority | 5,761 | 20.8 | -5.1 | ||
| Turnout | 27,747 | 53.2 | -8.2 | ||
| Registered electors | 52,170 | ||||
| Conservative hold | Swing | ||||
| Party | Candidate | Votes | % | ± | |
|---|---|---|---|---|---|
| Conservative | Christopher Tugendhat | 16,945 | 53.2 | -6.2 | |
| Labour | Phil Turner | 8,698 | 27.3 | -4.0 | |
| Liberal | T. G. Underwood | 6,015 | 18.9 | +10.5 | |
| Independent Conservative | C. D. Wertheim | 134 | 0.4 | N/A | |
| Majority | 8.247 | 25.9 | -2.2 | ||
| Turnout | 31,792 | 61.4 | +6.9 | ||
| Registered electors | 51,943 | ||||
| Conservative hold | Swing | ||||
Named from 1950 to 1970 Cities of London and Westminster
| Party | Candidate | Votes | % | ± | |
|---|---|---|---|---|---|
| Conservative | Christopher Tugendhat | 19,102 | 59.4 | +4.7 | |
| Labour | Alf Dubs | 10,062 | 31.3 | -3.8 | |
| Liberal | David Nicholson | 2,708 | 8.4 | -1.8 | |
| Independent - Anti-Labour | Willoughby Clark | 157 | 0.5 | N/A | |
| Independent - Young Ideas | Lord Sutch | 157 | 0.4 | N/A | |
| Majority | 9,040 | 28.1 | +8.5 | ||
| Turnout | 32,186 | 54.5 | -5.5 | ||
| Registered electors | 58,987 | ||||
| Conservative hold | Swing | ||||
Elections in the 1960s
| Party | Candidate | Votes | % | ± | |
|---|---|---|---|---|---|
| Conservative | John Smith | 19,242 | 54.7 | -3.67 | |
| Labour | Alexander Pringle | 12,349 | 35.1 | +4.52 | |
| Liberal | Thomas Houston | 3,576 | 10.2 | -0.85 | |
| Majority | 6,893 | 19.6 | -8.19 | ||
| Turnout | 35,167 | 60.0 | +0.34 | ||
| Registered electors | 58,630 | ||||
| Conservative hold | Swing | ||||
| Party | Candidate | Votes | % | ± | |
|---|---|---|---|---|---|
| Conservative | John Smith | 15,037 | 59.33 | +1.16 | |
| Labour | Alexander Pringle | 8,300 | 32.86 | +2.28 | |
| Liberal | Stephen Jakobi | 1,595 | 6.31 | -4.74 | |
| Independent | Desmond Burgess | 326 | 6.71 | N/A | |
| Majority | 6,737 | 26.47 | -1.32 | ||
| Turnout | 25,258 | 41.80 | -17.86 | ||
| Registered electors | |||||
| Conservative hold | Swing | -0.6 | |||
| Party | Candidate | Votes | % | ± | |
|---|---|---|---|---|---|
| Speaker | Harry Hylton-Foster | 21,588 | 58.37 | -6.73 | |
| Labour | Ronald Wallace | 11,309 | 30.58 | +6.18 | |
| Liberal | John W Derry | 4,087 | 11.05 | +0.55 | |
| Majority | 10,279 | 27.79 | -12.91 | ||
| Turnout | 36,984 | 59.66 | -1.64 | ||
| Registered electors | 61,988 | ||||
| Conservative hold | Swing | ||||
Elections in the 1950s
| Party | Candidate | Votes | % | ± | |
|---|---|---|---|---|---|
| Conservative | Harry Hylton-Foster | 27,489 | 65.1 | -5.1 | |
| Labour | Will Howie | 10,301 | 24.4 | -5.4 | |
| Liberal | Derek Monsey | 4,409 | 10.5 | N/A | |
| Majority | 17,188 | 40.7 | +0.2 | ||
| Turnout | 42,199 | 61.3 | +1.3 | ||
| Registered electors | 68,896 | ||||
| Conservative hold | Swing | ||||
| Party | Candidate | Votes | % | ± | |
|---|---|---|---|---|---|
| Conservative | Harold Webbe | 31,314 | 70.2 | +3.4 | |
| Labour | Dennis Nisbet | 13,270 | 29.8 | -3.4 | |
| Majority | 18,044 | 40.5 | +6.9 | ||
| Turnout | 44,584 | 60.1 | -7.1 | ||
| Registered electors | 74,162 | ||||
| Conservative hold | Swing | ||||
| Party | Candidate | Votes | % | ± | |
|---|---|---|---|---|---|
| Conservative | Harold Webbe | 35,275 | 66.8 | +5.2 | |
| Labour | Hugh Sutherland | 17,527 | 33.2 | -5.2 | |
| Majority | 17,738 | 33.6 | +0.0 | ||
| Turnout | 52,802 | 67.2 | -5.2 | ||
| Registered electors | 78,628 | ||||
| Conservative hold | Swing | ||||
| Party | Candidate | Votes | % | ± | |
|---|---|---|---|---|---|
| Conservative | Harold Webbe | 32,672 | 61.6 | N/A | |
| Labour | John Lewis Curthoys | 14,849 | 28.0 | N/A | |
| Liberal | Jacob Gorsky | 4,670 | 8.8 | N/A | |
| Communist | Gabriel Carritt | 888 | 1.7 | N/A | |
| Majority | 17,823 | 33.6 | N/A | ||
| Turnout | 53,079 | 72.4 | N/A | ||
| Registered electors | 73,316 | ||||
| Conservative win (new seat) | |||||
See also
Notes and references
- Notes
- References
- ↑ "Cities of London and Westminster: Usual Resident Population, 2011". Neighbourhood Statistics. Office for National Statistics. Retrieved 2 March 2015.
- ↑ "Electorate Figures". 2011 Electorate Figures. Boundary Commission for England. 4 March 2011. Archived from the original on 6 November 2010. Retrieved 13 March 2011.
- ↑ Whether the City of London returned one or two members was left for the decision of Parliament.
- ↑ "Initial Report of the Boundary Commission for England", Cmd. 7260, p. 4.
- ↑ "Initial Report of the Boundary Commission for England", Cmd. 7260, p. 33.
- ↑ "Redistribution of Seats". The Times. 16 February 1948. p. 4.
- ↑ "Proposals For New Seats". The Times. 14 June 1948. p. 4.
- ↑ HC Debs 5ser vol 452 col 326.
- ↑ "Boundary Commission for England", First Periodical Report, Cmd. 9311, p. 25.
- ↑ "Boundary Commission for England", Second Periodical Report, Cmnd. 4084, pp. 26-27.
- ↑ "Boundary Commission for England", Third Periodical Report, Cmnd. 8797-I, pp. 37–8.
- ↑ "Boundary Commission for England", Fourth Periodical Report, HC 433-i of session 1994-95, pp. 38-45.
- ↑ "Boundary Commission for England", Fifth Periodical Report, Cm 7032-I, pp. 42–51.
- ↑ Brannen, Aimee (13 September 2011). "Islington parliamentary boundaries could change". Islington Gazette.
- ↑ Eysenck, Juliet (13 September 2011). "Boundary changes to affect Westminster". Westminster Chronicle.
- ↑ White, Isobel; Johnston, Neil (4 February 2013). "Constituency boundaries: the Sixth General Review in England" (PDF). House of Commons Library. p. 13.
- ↑ Cities of London and Westminster - Revised Proposal Boundary Commission for England
- ↑ "Draft Recommendations: Electoral Areas for the Assembly of the Greater London Authority" (PDF). Local Government Commission for England. August 1998. paragraph 73.
- ↑ "Seat Details". www.electoralcalculus.co.uk.
- ↑ "Cities of London and Westminster 1950-1974". Hansard 1803-2005. UK Parliament. Retrieved 2 March 2015.
- ↑ "City of London and Westminster South 1974-1997". Hansard 1803-2005. UK Parliament. Retrieved 2 March 2015.
- ↑ "Cities of London and Westminster 1997-". Hansard 1803-2005. UK Parliament. Retrieved 2 March 2015.
- ↑ Leigh Rayment's Historical List of MPs – Constituencies beginning with "C" (part 4)
- ↑ "<Election Title>" (PDF). Westminster City Council. Retrieved 12 May 2017.
- ↑ http://researchbriefings.files.parliament.uk/documents/CBP-7979/CBP-7979.pdf
- ↑ "Election Data 2015". Electoral Calculus. Archived from the original on 17 October 2015. Retrieved 17 October 2015.
- ↑ "7 May 2015 - UK general election". Westminster City Council. Retrieved 9 May 2015.
- ↑ "Election Data 2010". Electoral Calculus. Archived from the original on 26 July 2013. Retrieved 17 October 2015.
- ↑ "Election Data 2005". Electoral Calculus. Archived from the original on 15 October 2011. Retrieved 18 October 2015.
- ↑ "Election Data 1997". Electoral Calculus. Archived from the original on 15 October 2011. Retrieved 18 October 2015.
- ↑ "Election Data 1992". Electoral Calculus. Archived from the original on 15 October 2011. Retrieved 18 October 2015.
- ↑ "Election Data 1987". Electoral Calculus. Archived from the original on 15 October 2011. Retrieved 18 October 2015.
- ↑ "Election Data 1983". Electoral Calculus. Archived from the original on 15 October 2011. Retrieved 18 October 2015.
- ↑ "1977 By Election Results". Archived from the original on 2013-10-12. Retrieved 2015-09-17.
- ↑ "1965 By Election Results". Archived from the original on 2013-10-29. Retrieved 2015-08-19.
External links
- nomis Constituency Profile for Cities of London and Westminster — presenting data from the ONS annual population survey and other official statistics.
- Politics Resources (Election results from 1922 onwards)
- Electoral Calculus (Election results from 1955 onwards)
| Parliament of the United Kingdom | ||
|---|---|---|
| Preceded by Cirencester and Tewkesbury |
Constituency represented by the Speaker 1959–1965 |
Succeeded by Southampton Itchen |