Dundee West (UK Parliament constituency)
| Dundee West | |
|---|---|
|
Burgh constituency for the House of Commons | |
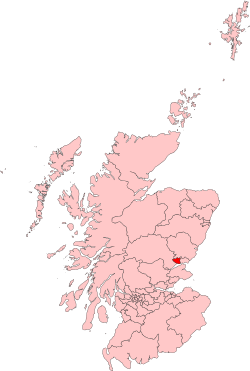 Boundary of Dundee West in Scotland. | |
| Subdivisions of Scotland | Angus/City of Dundee |
| Current constituency | |
| Created | 1950 |
| Member of parliament | Chris Law (SNP) |
| Created from | Dundee |
| Overlaps | |
| European Parliament constituency | Scotland |
Dundee West is a constituency of the House of Commons of the Parliament of the United Kingdom. It elects one Member of Parliament (MP) by the first-past-the-post voting system.
The constituency was created for the 1950 general election, when the two-seat Dundee constituency was split into two single seat constituencies: Dundee East and Dundee West.
Boundaries
1950-1974: The County of the City of Dundee wards numbers 2, 3, 6, 7, 8, and 9.
1974-1983: The County of the City of Dundee wards of Balgay, Camperdown, Downfield, Law, Lochee, and Riverside. The constituency boundaries remained unchanged.
1983-1997: The City of Dundee District electoral divisions of Ardler/Blackside, Central/Riverside, Downfield/St Mary's, Dudhope/Logie, Gourdie/Pitalpin, Law/Ancrum, Lochee, Menziehill/Ninewells, Rockwell/Fairmuir, and Trottick/Gillburn.
1997-2005: The City of Dundee District electoral divisions of Central, Charleston, Kingsway West, Kirkton, Law, Lochee, Ninewells, Riverside, and St Mary's.
2005-present: The area of the Dundee City Council other than that part in the Dundee East Burgh Constituency, and the Angus Council ward of Sidlaw West.
The constituency is one of two covering the City of Dundee council area, the other being Dundee East. Current boundaries were first used in the 2005 general election.
As well as covering an eastern portion of the city area, the West constituency also includes, to the north and west, part of the Angus council area. Similarly, the east constituency includes, to the north and east, another part of the Angus council area.
Prior to the 2005 election, both constituencies were entirely within the city area, and the north-eastern and north-western areas of the city were within the Angus constituency. Scottish Parliament constituencies retain the older boundaries.
Politics and history of the constituency
Dundee West was formerly a safe seat for Labour. Its voters have traditionally been more loyal to the Labour Party than the neighbouring Dundee East constituency; which has elected only one Labour MP since the 1950s. Labour's majority was reduced in 2005 by the SNP candidate Joe Fitzpatrick despite changes to the boundaries which should have favoured Labour; suggesting that the constituency might be becoming more marginal, although the gap widened again in 2010. The current MP is Chris Law, who was the first-ever MP from the Scottish National Party elected for Dundee West; as part of the party's near-clean sweep of the majority of Scottish seats at that year's general election.
Members of Parliament
| Election | Member[1] | Party | |
|---|---|---|---|
| 1950 | John Strachey | Labour | |
| 1963 by-election | Peter Doig | Labour | |
| 1979 | Ernie Ross | Labour | |
| 2005 | Jim McGovern | Labour | |
| 2015 | Chris Law | SNP | |
Election results
Elections in the 2010s
| Party | Candidate | Votes | % | ± | |
|---|---|---|---|---|---|
| SNP | Chris Law[4] | 18,045 | 46.7 | -15.3 | |
| Labour | Alan Cowan | 12,783 | 33.1 | +9.4 | |
| Conservative | Darren Cormack | 6,257 | 16.2 | +7.6 | |
| Liberal Democrat | Jenny Blain | 1,189 | 3.1 | +0.7 | |
| Independent | Sean Dobson | 403 | 1.0 | +1.0 | |
| Majority | 5,262 | 13.6 | -24.6 | ||
| Turnout | 38,677 | 61.7 | -6.1 | ||
| SNP hold | Swing | -12.35 | |||
| Party | Candidate | Votes | % | ± | |
|---|---|---|---|---|---|
| SNP | Chris Law | 27,684 | 61.9 | +33.0 | |
| Labour | Michael Marra | 10,592 | 23.7 | −24.8 | |
| Conservative | Nicola Ross | 3,852 | 8.6 | −0.7 | |
| Scottish Green | Pauline Hinchion[7] | 1,225 | 2.7 | n/a | |
| Liberal Democrats | Daniel Coleman[8] | 1,057 | 2.4 | −9.0 | |
| TUSC | Jim McFarlane[9] | 304 | 0.7 | −0.3 | |
| Majority | 17,092 | 38.2 | |||
| Turnout | 44,714 | 67.8 | +8.8 | ||
| SNP gain from Labour | Swing | +28.9 | |||
| Party | Candidate | Votes | % | ± | |
|---|---|---|---|---|---|
| Labour | Jim McGovern | 17,994 | 48.5 | +3.9 | |
| SNP | Jim Barrie | 10,716 | 28.9 | −1.2 | |
| Liberal Democrats | John Barnett | 4,233 | 11.4 | −3.0 | |
| Conservative | Colin Stewart | 3,461 | 9.3 | +1.0 | |
| Independent | Andy McBride | 365 | 1.0 | +1.0 | |
| TUSC | Jim McFarlane | 357 | 1.0 | +1.0 | |
| Majority | 7,278 | 19.6 | |||
| Turnout | 37,126 | 59 | +2.8 | ||
| Labour hold | Swing | +2.5 | |||
Elections in the 2000s
| Party | Candidate | Votes | % | ± | |
|---|---|---|---|---|---|
| Labour | Jim McGovern | 16,468 | 44.6 | n/a | |
| SNP | Joe Fitzpatrick | 11,089 | 30.0 | n/a | |
| Liberal Democrat | Nykoma Garry | 5,323 | 14.4 | n/a | |
| Conservative | Christopher McKinlay | 3,062 | 8.3 | n/a | |
| Scottish Socialist | Jim McFarlane | 994 | 2.7 | N/A | |
| Majority | 5,379 | 14.6 | N/A | ||
| Turnout | 36,936 | 56.1 | N/A | ||
| Labour hold | Swing | ||||
| Party | Candidate | Votes | % | ± | |
|---|---|---|---|---|---|
| Labour | Ernie Ross | 14,787 | 50.6 | −3.2 | |
| SNP | Gordon Archer | 7,987 | 27.3 | +4.1 | |
| Conservative | Ian Hail | 2,656 | 9.1 | −4.1 | |
| Liberal Democrat | Elizabeth Dick | 2,620 | 9.0 | +1.3 | |
| Scottish Socialist | Jim McFarlane | 1,192 | 4.1 | N/A | |
| Majority | 6,800 | 23.3 | |||
| Turnout | 29,242 | 54.4 | −13.2 | ||
| Labour hold | Swing | ||||
Elections in the 1990s
| Party | Candidate | Votes | % | ± | |
|---|---|---|---|---|---|
| Labour | Ernie Ross | 20,875 | 53.8 | +4.8 | |
| SNP | John Dorward | 9,016 | 23.2 | −0.4 | |
| Conservative | Neil Powrie | 5,015 | 13.2 | −5.3 | |
| Liberal Democrat | Elizabeth Dick | 2,972 | 7.7 | +0.2 | |
| Scottish Socialist | Mary Ward | 428 | 1.1 | N/A | |
| Referendum | John MacMillan | 411 | 1.1 | N/A | |
| Majority | 11,859 | 30.9 | |||
| Turnout | 38,717 | 67.7 | −2.1 | ||
| Labour hold | Swing | ||||
| Party | Candidate | Votes | % | ± | |
|---|---|---|---|---|---|
| Labour | Ernie Ross | 20,498 | 49.0 | −4.4 | |
| SNP | Keith Brown | 9,894 | 23.6 | +8.3 | |
| Conservative | Andrew Spearman | 7,746 | 18.5 | +0.5 | |
| Liberal Democrat | Elizabeth Dick | 3,132 | 7.5 | −5.2 | |
| Scottish Green | Elly Hood | 432 | 1.0 | N/A | |
| Natural Law | Donald Arnold | 159 | 0.4 | N/A | |
| Majority | 10,604 | 25.4 | |||
| Turnout | 41,861 | 69.8 | |||
| Labour hold | Swing | ||||
Elections in the 1980s
| Party | Candidate | Votes | % | ± | |
|---|---|---|---|---|---|
| Labour | Ernie Ross | 24,916 | 53.4 | ||
| Conservative | John Donnelly | 8,390 | 18.0 | ||
| SNP | Alasdair Morgan | 7,164 | 15.3 | ||
| Social Democratic | Rosemary Lonie | 5,922 | 12.7 | ||
| Communist | Stephen Matthewson | 308 | 0.7 | ||
| Majority | 16,526 | 35.4 | |||
| Turnout | 46,700 | 75.41 | |||
| Labour hold | Swing | ||||
| Party | Candidate | Votes | % | ± | |
|---|---|---|---|---|---|
| Labour | Ernie Ross | 20,288 | 43.46 | ||
| Conservative | D. Senior | 10,138 | 21.72 | ||
| Social Democratic | Elizabeth Dick | 7,976 | 17.09 | ||
| SNP | James Lynch | 7,973 | 17.08 | ||
| Ecology | Patrick Marks | 302 | 0.65 | ||
| Majority | 10,150 | 21.75 | |||
| Turnout | 46,677 | 74.4 | |||
| Labour hold | Swing | ||||
Elections in the 1970s
| Party | Candidate | Votes | % | ± | |
|---|---|---|---|---|---|
| Labour | Ernie Ross | 23,654 | 47.25 | ||
| SNP | Jim Fairlie | 13,197 | 26.36 | ||
| Conservative | I. Stevenson | 12,892 | 25.75 | ||
| Communist | Raymond Mennie | 316 | 0.63 | ||
| Majority | 10,457 | 20.89 | |||
| Turnout | 50,059 | 78.4 | |||
| Labour hold | Swing | ||||
| Party | Candidate | Votes | % | ± | |
|---|---|---|---|---|---|
| Labour | Peter Doig | 19,480 | 41.01 | ||
| SNP | Jim Fairlie | 16,678 | 35.11 | ||
| Conservative | C.G. Findlay | 8,769 | 18.46 | ||
| Liberal | R. Hewett | 2,195 | 4.62 | ||
| Communist | H. McLevy | 381 | 0.80 | ||
| Majority | 2,802 | 5.90 | |||
| Turnout | 74.32 | ||||
| Labour hold | Swing | ||||
| Party | Candidate | Votes | % | ± | |
|---|---|---|---|---|---|
| Labour | Peter Doig | 22,193 | 43.03 | ||
| Conservative | M. Tomison | 15,745 | 30.53 | ||
| SNP | Jim Fairlie | 12,959 | 25.13 | ||
| Communist | H. McLevy | 673 | 1.31 | ||
| Majority | 6,448 | 12.50 | |||
| Turnout | 81.26 | ||||
| Labour hold | Swing | ||||
| Party | Candidate | Votes | % | ± | |
|---|---|---|---|---|---|
| Labour | Peter Doig | 26,271 | 51.54 | ||
| Conservative | J.A. Payne | 19,449 | 38.16 | ||
| SNP | J.A. Shepherd | 4,441 | 8.71 | ||
| Communist | H. McLevy | 809 | 1.59 | ||
| Majority | 6,822 | 13.38 | |||
| Turnout | 76.26 | ||||
| Labour hold | Swing | ||||
Elections in the 1960s
| Party | Candidate | Votes | % | ± | |
|---|---|---|---|---|---|
| Labour | Peter Doig | 26,705 | 53.71 | ||
| Conservative | C. A. MacNab | 18,345 | 36.90 | ||
| Liberal | J. W. Cruddas | 3,454 | 6.95 | ||
| Communist | David Bowman | 1,217 | 2.45 | ||
| Majority | 8,360 | 16.81 | |||
| Turnout | 79.90 | ||||
| Labour hold | Swing | ||||
| Party | Candidate | Votes | % | ± | |
|---|---|---|---|---|---|
| Labour | Peter Doig | 27,090 | 53.34 | ||
| Conservative and National Liberal | Henry Campbell Scarlett | 22,473 | 44.25 | ||
| Communist | David Bowman | 1,228 | 2.42 | ||
| Majority | 4,617 | 9.09 | |||
| Turnout | 81.50 | ||||
| Labour hold | Swing | ||||
| Party | Candidate | Votes | % | ± | |
|---|---|---|---|---|---|
| Labour | Peter Doig | 22,449 | 50.6 | +0.92 | |
| Conservative and National Liberal | Robert Taylor | 17,494 | 39.4 | -8.87 | |
| SNP | James C. Lees | 3,285 | 7.4 | N/A | |
| Communist | David P. Bowman | 1,170 | 2.6 | +0.55 | |
| Majority | 4,955 | 11.16 | +9.81 | ||
| Turnout | 44,398 | 71.6 | |||
| Labour hold | Swing | ||||
Elections in the 1950s
| Party | Candidate | Votes | % | ± | |
|---|---|---|---|---|---|
| Labour | John Strachey | 25,857 | 49.64 | ||
| Unionist | Robert R. Taylor | 25,143 | 48.27 | ||
| Communist | David P. Bowman | 1,087 | 2.09 | ||
| Majority | 714 | 1.35 | |||
| Turnout | 82.94 | ||||
| Labour hold | Swing | ||||
| Party | Candidate | Votes | % | ± | |
|---|---|---|---|---|---|
| Labour | John Strachey | 26,082 | 50.52 | ||
| Conservative and National Liberal | Gordon HM Pirie | 24,208 | 46.89 | ||
| Communist | David P. Bowman | 1,335 | 2.59 | ||
| Majority | 1,874 | 3.63 | |||
| Turnout | 82.70 | ||||
| Labour hold | Swing | ||||
| Party | Candidate | Votes | % | ± | |
|---|---|---|---|---|---|
| Labour | John Strachey | 29,020 | 51.60 | ||
| Liberal | John Junor | 25,714 | 45.72 | ||
| Communist | David P. Bowman | 1,508 | 2.68 | ||
| Majority | 3,306 | 5.88 | |||
| Turnout | 86.80 | ||||
| Labour hold | Swing | ||||
| Party | Candidate | Votes | % | ± | |
|---|---|---|---|---|---|
| Labour | John Strachey | 28,386 | 53.50 | ||
| Conservative and National Liberal | Henry Scrymgeour-Wedderburn | 23,685 | 44.64 | ||
| Liberal | Colin James Canning | 986 | 1.86 | ||
| Majority | 4,701 | 8.86 | |||
| Turnout | 88.08 | ||||
| Labour win (new seat) | |||||
References
- ↑ Leigh Rayment's Historical List of MPs – Constituencies beginning with "D" (part 4)
- ↑ "Statement of Persons Nominated and Notice of Poll" (PDF). Dundee City Council. 11 May 2017. Retrieved 7 June 2017.
- ↑ https://www.bbc.co.uk/news/politics/constituencies/S14000016
- ↑ http://www.scotsman.com/news/politics/general-election-snp-reselects-54-mps-1-4426658
- ↑ "Election Data 2015". Electoral Calculus. Archived from the original on 17 October 2015. Retrieved 17 October 2015.
- ↑ http://www.dundeecity.gov.uk/elections2015/westresults
- ↑ http://www.dundeegreens.org.uk/2015/01/13/dundee-greens-announce-westminster-candidates/
- ↑ http://www.libdemvoice.org/daniel-coleman-selected-to-fight-dundee-west-for-the-liberal-democrats-43957.html
- ↑ "More Tusc Candidates in place as election challenge grows". Retrieved 24 January 2015.
- ↑ "Election Data 2010". Electoral Calculus. Archived from the original on 17 October 2015. Retrieved 17 October 2015.
- ↑ "Election Data 2005". Electoral Calculus. Archived from the original on 15 October 2011. Retrieved 18 October 2015.
- ↑ "Election Data 2001". Electoral Calculus. Archived from the original on 15 October 2011. Retrieved 18 October 2015.
- ↑ "Election Data 1997". Electoral Calculus. Archived from the original on 15 October 2011. Retrieved 18 October 2015.
- 1 2 "Aristotle: Dundee West", Guardian Unlimited
- ↑ "Election Data 1992". Electoral Calculus. Archived from the original on 15 October 2011. Retrieved 18 October 2015.
- ↑ "Election Data 1987". Electoral Calculus. Archived from the original on 15 October 2011. Retrieved 18 October 2015.
- 1 2
- ↑ "Election Data 1983". Electoral Calculus. Archived from the original on 15 October 2011. Retrieved 18 October 2015.
- ↑
- ↑ Whitaker's Almanack 1977
- 1 2
- 1 2
- ↑
- ↑ The Times, 22 Nov 1963
- ↑ Whitaker's Almanack 1963
- ↑
- ↑ The Times' Guide to the House of Commons. 1955.
- ↑
- ↑
- ↑