East Lothian (UK Parliament constituency)
| East Lothian | |
|---|---|
|
County constituency for the House of Commons | |
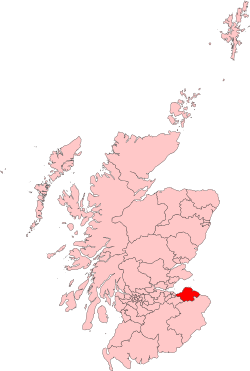 Boundary of East Lothian in Scotland. | |
| Current constituency | |
| Created | 1983 |
| Member of parliament | Martin Whitfield (Labour) |
| Created from | Berwick and East Lothian, Edinburgh East and Midlothian[1] |
| Overlaps | |
| European Parliament constituency | Scotland |
East Lothian is a constituency in Scotland which returned one Member of Parliament (MP) to the House of Commons of the Parliament of the United Kingdom, elected by the first past the post voting system.
The constituency is represented by Martin Whitfield of the Scottish Labour Party.
History
The constituency was created for the 1983 general election. Until the SNP landslide victory in 2015, it had always been represented by an MP from the Labour Party. From 2015 until the snap general election in 2017, the constituency was represented by George Kerevan of the Scottish National Party; who was defeated by Martin Whitfield of the Labour Party by 3,083 votes.
The East Lothian Labour Party voted on 22 January 2010 to deselect the previous MP Anne Moffat.[2] The National Executive Committee upheld the decision on 23 March 2010.[3] Fiona O'Donnell was elected in 2010 with an increased majority from 2005.
Boundaries
1983-1997: East Lothian District.
1997-2005: The East Lothian District electoral divisions of Fa'side, Haddington, Luffness, Preston/Levenhall, and Tantallon.
2005–present: The area of the East Lothian Council.
The constituency covers the whole of the East Lothian council area in Scotland. The East Lothian town of Musselburgh was added to the seat from Edinburgh East and Musselburgh in 2005. Before the 1983 general election, the area lay in the Berwick and East Lothian constituency.
Members of Parliament
| Election | Member[4] | Party | |
|---|---|---|---|
| 1983 | John Home Robertson | Labour | |
| 2001 | Anne Moffat | ||
| 2010 | Fiona O'Donnell | ||
| 2015 | George Kerevan | SNP | |
| 2017 | Martin Whitfield | Labour | |
Elections
Elections in the 2010s
| Party | Candidate | Votes | % | ± | |
|---|---|---|---|---|---|
| Labour | Martin Whitfield | 20,158 | 36.1 | +5.1 | |
| SNP | George Kerevan | 17,075 | 30.6 | -12.0 | |
| Conservative | Sheila Low | 16,540 | 29.6 | +10.1 | |
| Liberal Democrat | Elisabeth Wilson | 1,738 | 3.1 | +0.5 | |
| Independent | Mike Allan | 367 | 0.7 | +0.4 | |
| Majority | 3,083 | 5.5 | |||
| Turnout | 55,878 | 70.6 | -3.6 | ||
| Labour gain from SNP | Swing | +8.6 | |||
| Party | Candidate | Votes | % | ± | |
|---|---|---|---|---|---|
| SNP | George Kerevan | 25,104 | 42.5 | +26.5 | |
| Labour | Fiona O'Donnell | 18,301 | 31.0 | −13.6 | |
| Conservative | David Roach | 11,511 | 19.5 | −0.2 | |
| Liberal Democrat | Ettie Spencer | 1,517 | 2.6 | −14.3 | |
| Scottish Green | Jason Rose | 1,245 | 2.1 | +0.4 | |
| UKIP | Oluf Marshall | 1,178 | 2.0 | +0.9 | |
| Independent | Mike Allan | 158 | 0.3 | N/A | |
| Majority | 6,803 | 11.5 | |||
| Turnout | 59,014 | 74.2 | +7.3 | ||
| SNP gain from Labour | Swing | +20.1 | |||
| Party | Candidate | Votes | % | ± | |
|---|---|---|---|---|---|
| Labour | Fiona O'Donnell | 21,919 | 44.6 | +3.1 | |
| Conservative | Michael Veitch | 9,661 | 19.7 | +3.7 | |
| Liberal Democrat | Stuart Ritchie | 8,228 | 16.9 | −8.0 | |
| SNP | Andrew Sharp | 7,883 | 16.0 | +2.9 | |
| Scottish Green | James Mackenzie | 862 | 1.8 | −0.7 | |
| UKIP | Jonathan Lloyd | 548 | 1.1 | +0.4 | |
| Majority | 12,258 | 24.9 | |||
| Turnout | 49,161 | 66.9 | +2.2 | ||
| Labour hold | Swing | −0.3 | |||
Elections in the 2000s
| Party | Candidate | Votes | % | ± | |
|---|---|---|---|---|---|
| Labour | Anne Moffat | 18,983 | 41.5 | −7.4 | |
| Liberal Democrat | Chris Butler | 11,363 | 24.8 | +7.6 | |
| Conservative | William Stevenson | 7,315 | 16.0 | 0.0 | |
| SNP | Paul McLennan | 5,995 | 13.1 | −1.8 | |
| Scottish Green | Michael Collie | 1,132 | 2.5 | N/A | |
| Scottish Socialist | Gary Galbraith | 504 | 1.1 | N/A | |
| UKIP | Eric Robb | 306 | 0.7 | N/A | |
| Christian Vote | William Thompson | 178 | 0.4 | N/A | |
| Majority | 7,620 | 16.6 | |||
| Turnout | 45,776 | 64.5 | +3.6 | ||
| Labour hold | Swing | −7.5 | |||
| Party | Candidate | Votes | % | ± | |
|---|---|---|---|---|---|
| Labour | Anne Picking | 17,407 | 47.2 | −5.5 | |
| Conservative | Hamish Mair | 6,577 | 17.8 | −2.1 | |
| Liberal Democrat | Judith Hayman | 6,506 | 17.6 | +7.1 | |
| SNP | Hilary Brown | 5,381 | 14.6 | −1.1 | |
| Scottish Socialist | Derrick White | 624 | 1.7 | N/A | |
| Socialist Labour | James Herriot | 376 | 1.0 | N/A | |
| Majority | 10,830 | 29.4 | |||
| Turnout | 36,871 | 62.5 | −13.0 | ||
| Labour hold | Swing | ||||
Elections in the 1990s
| Party | Candidate | Votes | % | ± | |
|---|---|---|---|---|---|
| Labour | John Home Robertson | 22,881 | 52.7 | +6.2 | |
| Conservative | Murdo Fraser | 8,660 | 19.9 | −8.3 | |
| SNP | David R. McCarthy | 6,825 | 15.7 | +1.5 | |
| Liberal Democrat | Alison MacAskill | 4,575 | 10.5 | −0.7 | |
| Referendum | Norman S. Nash | 491 | 1.1 | N/A | |
| Majority | 14,221 | 32.7 | |||
| Turnout | 43,432 | 75.6 | |||
| Labour hold | Swing | ||||
| Party | Candidate | Votes | % | ± | |
|---|---|---|---|---|---|
| Labour | John Home Robertson | 25,537 | 46.5 | −1.6 | |
| Conservative | James P. Hepburne-Scott | 15,501 | 28.2 | −0.1 | |
| SNP | George R. Thomson | 7,776 | 14.2 | +6.9 | |
| Liberal Democrat | Tim McKay | 6,126 | 11.2 | −4.3 | |
| Majority | 10,036 | 18.3 | −1.5 | ||
| Turnout | 54,940 | 82.4 | +3.7 | ||
| Labour hold | Swing | −0.7 | |||
Elections in the 1980s
| Party | Candidate | Votes | % | ± | |
|---|---|---|---|---|---|
| Labour | John Home Robertson | 24,583 | 48.0 | +4.1 | |
| Conservative | Stanley Langdon | 14,378 | 28.3 | −2.5 | |
| Liberal | Andrew Robinson | 7,929 | 15.5 | −5.4 | |
| SNP | Alexander Burgon-Lyon | 3,727 | 7.3 | +2.9 | |
| Green | Angus Marland | 451 | 0.9 | N/A | |
| Majority | 10,105 | 19.7 | |||
| Turnout | 51,068 | 78.7 | +2.3 | ||
| Labour hold | Swing | ||||
| Party | Candidate | Votes | % | ± | |
|---|---|---|---|---|---|
| Labour | John Home Robertson | 20,934 | 43.9 | N/A | |
| Conservative | Michael Fry | 14,693 | 30.8 | N/A | |
| Liberal | M. Kibby | 9,950 | 20.9 | N/A | |
| SNP | Roger Knox | 2,083 | 4.4 | N/A | |
| Majority | 6,241 | 13.1 | N/A | ||
| Turnout | 47,660 | 76.4 | N/A | ||
| Labour win (new seat) | |||||
References
- ↑ "'East Lothian', June 1983 up to May 1997". ElectionWeb Project. Cognitive Computing Limited. Retrieved 11 March 2016.
- ↑ "Moffat faces deselection after police called to club rebellion". Edinburgh Evening News. 25 January 2010. Retrieved 30 January 2010.
- ↑ Carrell, Severin (23 March 2010). "Labour party upholds decision to deselect East Lothian MP Anne Moffat". The Guardian. London. Retrieved 23 March 2010.
- ↑ Leigh Rayment's Historical List of MPs – Constituencies beginning with "E" (part 1)
- ↑ "Latest candidate announced for General Election". East Lothian Courier.
- ↑ "Election Data 2015". Electoral Calculus. Archived from the original on 17 October 2015. Retrieved 17 October 2015.
- ↑ Jones, Matt. "UK Parliamentary General Election". www.eastlothian.gov.uk.
- ↑ "Election Data 2010". Electoral Calculus. Archived from the original on 17 October 2015. Retrieved 17 October 2015.
- ↑ BBC News
- ↑ "Election Data 2005". Electoral Calculus. Archived from the original on 15 October 2011. Retrieved 18 October 2015.
- ↑ "Election Data 2001". Electoral Calculus. Archived from the original on 15 October 2011. Retrieved 18 October 2015.
- ↑ "Election Data 1997". Electoral Calculus. Archived from the original on 15 October 2011. Retrieved 18 October 2015.
- ↑ "Aristotle: East Lothian", Guardian Unlimited
- ↑ "Election Data 1992". Electoral Calculus. Archived from the original on 15 October 2011. Retrieved 18 October 2015.
- ↑ "Politics Resources". Election 1992. Politics Resources. 9 April 1992. Retrieved 6 Dec 2010.
- ↑ "Election Data 1987". Electoral Calculus. Archived from the original on 15 October 2011. Retrieved 18 October 2015.
- 1 2 "Politics Resources". Election 1992. Politics Resources. 9 April 1992. Retrieved 6 Dec 2010.
- ↑ "Election Data 1983". Electoral Calculus. Archived from the original on 15 October 2011. Retrieved 18 October 2015.