Luton South (UK Parliament constituency)
| Luton South | |
|---|---|
|
Borough constituency for the House of Commons | |
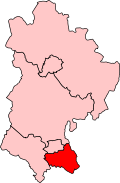 Boundary of Luton South in Bedfordshire. | |
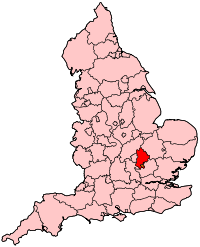 Location of Bedfordshire within England. | |
| County | Bedfordshire |
| Electorate | 65,889 (December 2010)[1] |
| Major settlements | Luton |
| Current constituency | |
| Created | 1983 |
| Member of parliament | Gavin Shuker (Labour Co-op) |
| Number of members | One |
| Created from | Luton East, Luton West and Bedfordshire South[2] |
| Overlaps | |
| European Parliament constituency | East of England |
Luton South is a constituency[n 1] in Bedfordshire represented in the House of Commons of the UK Parliament since 2010 by Gavin Shuker of the Labour Party and the Co-operative Party.[n 2]
History
This seat was created in 1983, primarily from the former seat of Luton East.
The constituency and its predecessors the Luton East and Luton constituencies were long considered a bellwether (they had elected an MP from the winning party in each election since the 1951 general election). Margaret Moran, who was the Labour MP from 1997, stood down at the 2010 general election after falsifying claims for her expenses.[3] Bellwether status ended in the 2010 general election, when the constituency elected a Labour MP while the Conservatives were the largest party in the House of Commons. As a result, its new MP Gavin Shuker became one of just two Labour MPs elected in 2010 in the East of England, alongside Kelvin Hopkins, the MP for the Luton North seat. Shuker and Hopkins have served as MPs for the two divisions of Luton since then, with their majorities increasing in both elections since, although the majority in South has not been larger than that of North since 2001.
Boundaries
1983-1997: The Borough of Luton wards of Biscot, Crawley, Dallow, Farley, High Town, Putteridge, Saints, South, and Stopsley, and the District of South Bedfordshire wards of Caddington and Slip End.
1997-2010: The Borough of Luton wards of Biscott, Crawley, Dallow, Farley, High Town, Putteridge, South, and Stopsley, and the District of South Bedfordshire wards of Caddington and Slip End.
2010–present: The Borough of Luton wards of Biscot, Crawley, Dallow, Farley, High Town, Round Green, South, Stopsley, and Wigmore, and the District of South Bedfordshire ward of Caddington, Hyde and Slip End.
NB: the latter ward now forms the bulk of the South East Bedfordshire ward of the Central Bedfordshire unitary authority, the former wards having been abolished at the conversion to unitary councils in Bedfordshire in 2009.
Members of Parliament
| Election | Member[4] | Party | |
|---|---|---|---|
| 1983 | Graham Bright | Conservative | |
| 1997 | Margaret Moran | Labour | |
| 2010 | Gavin Shuker | Labour Co-op | |
Elections
Elections in the 2010s
| Party | Candidate | Votes | % | ± | |
|---|---|---|---|---|---|
| Labour Co-op | Gavin Shuker | 28,804 | 62.4 | +18.2 | |
| Conservative | Dean Russell | 14,879 | 32.3 | +1.6 | |
| Liberal Democrat | Andy Strange | 1,056 | 2.3 | -5.3 | |
| UKIP | Ujjawal Ub | 795 | 1.7 | -10.4 | |
| Green | Marc Scheimann | 439 | 1.0 | -2.0 | |
| Independent | Abid Ali | 160 | 0.3 | N/A | |
| Majority | 13,925 | 30.1 | +27.6 | ||
| Turnout | 46,233 | 68.83 | +6.03 | ||
| Labour hold | Swing | +8.3 | |||
| Party | Candidate | Votes | % | ± | |
|---|---|---|---|---|---|
| Labour Co-op | Gavin Shuker | 18,660 | 44.2 | +9.3 | |
| Conservative | Katie Redmond | 12,949 | 30.7 | +1.3 | |
| UKIP | Muhammad Rehman | 5,129 | 12.1 | +9.8 | |
| Liberal Democrat | Ashuk Ahmed | 3,183 | 7.5 | −15.1 | |
| Green | Simon Hall | 1,237 | 2.9 | +2.1 | |
| Independent | Attiq Malik | 900 | 2.1 | N/A | |
| Liberty GB | Paul Weston | 158 | 0.4 | N/A | |
| Majority | 5,711 | 13.5 | +8.0 | ||
| Turnout | 42,216 | 62.8 | −2.0 | ||
| Labour hold | Swing | ||||
| Party | Candidate | Votes | % | ± | |
|---|---|---|---|---|---|
| Labour Co-op | Gavin Shuker | 14,725 | 34.9 | −7.9 | |
| Conservative | Nigel Huddleston | 12,396 | 29.4 | +1.3 | |
| Liberal Democrat | Qurban Hussain | 9,567 | 22.7 | +0.1 | |
| Independent | Esther Rantzen | 1,872 | 4.4 | N/A | |
| BNP | Tony Blakey | 1,299 | 3.1 | N/A | |
| UKIP | Charles Lawman | 975 | 2.3 | −0.1 | |
| Independent | Stephen Rhodes | 463 | 1.1 | N/A | |
| Green | Marc Scheimann | 366 | 0.9 | −1.2 | |
| Independent | Joe Hall | 264 | 0.6 | N/A | |
| Independent | Faruk Choudhury | 130 | 0.3 | N/A | |
| Independent | Stephen Lathwell | 84 | 0.2 | N/A | |
| Workers Revolutionary | Frank Sweeney | 75 | 0.2 | −0.1 | |
| Majority | 2,329 | 5.5 | -9.0 | ||
| Turnout | 42,216 | 64.8 | +11.0 | ||
| Labour hold | Swing | −4.6 | |||
Elections in the 2000s
| Party | Candidate | Votes | % | ± | |
|---|---|---|---|---|---|
| Labour | Margaret Moran | 16,610 | 42.7 | −12.5 | |
| Conservative | Richard Stay | 10,960 | 28.2 | −1.2 | |
| Liberal Democrat | Qurban Hussain | 8,778 | 22.6 | +11.7 | |
| UKIP | Charles Lawman | 957 | 2.5 | +1.0 | |
| Green | Marc Scheimann | 790 | 2.0 | +0.0 | |
| Respect | Mohammed Ilyas | 725 | 1.9 | N/A | |
| Workers Revolutionary | Arthur Lynn | 98 | 0.3 | +0.0 | |
| Majority | 5,650 | 14.5 | -11.3 | ||
| Turnout | 38,918 | 54.1 | −1.0 | ||
| Labour hold | Swing | −5.6 | |||
| Party | Candidate | Votes | % | ± | |
|---|---|---|---|---|---|
| Labour | Margaret Moran | 21,719 | 55.2 | +0.3 | |
| Conservative | Gordon Henderson | 11,586 | 29.4 | −1.9 | |
| Liberal Democrat | Rabi Martins | 4,292 | 10.9 | +1.3 | |
| Green | Marc Scheimann | 798 | 2.0 | +1.3 | |
| UKIP | Charles Lawman | 578 | 1.5 | +0.7 | |
| Socialist Alliance | Joseph Hearne | 271 | 0.7 | N/A | |
| Workers Revolutionary | Robert Bolton | 107 | 0.3 | N/A | |
| Majority | 10,133 | 25.8 | +2.3 | ||
| Turnout | 39,351 | 55.1 | −15.4 | ||
| Labour hold | Swing | ||||
Elections in the 1990s
| Party | Candidate | Votes | % | ± | |
|---|---|---|---|---|---|
| Labour | Margaret Moran | 26,428 | 54.8 | +11.6 | |
| Conservative | Graham Bright | 15,109 | 31.4 | −12.9 | |
| Liberal Democrat | Keith Fitchett | 4,610 | 9.6 | −1.6 | |
| Referendum | Clive Jacobs | 1,205 | 2.5 | N/A | |
| UKIP | Charlie Lawman | 390 | 0.8 | N/A | |
| Green | Marc Scheimann | 356 | 0.7 | −0.3 | |
| Natural Law | Claire Perrin | 86 | 0.2 | −0.1 | |
| Majority | 11,319 | 23.5 | N/A | ||
| Turnout | 48,184 | 70.4 | -8.7 | ||
| Labour gain from Conservative | Swing | ||||
| Party | Candidate | Votes | % | ± | |
|---|---|---|---|---|---|
| Conservative | Graham Bright | 25,900 | 44.8 | −1.4 | |
| Labour | William McKenzie | 25,101 | 43.5 | +6.8 | |
| Liberal Democrat | David W. Rogers | 6,020 | 10.4 | −6.7 | |
| Green | Lyn Bliss | 550 | 1.0 | +1.0 | |
| Natural Law | David Cooke | 191 | 0.3 | +0.3 | |
| Majority | 799 | 1.4 | −8.2 | ||
| Turnout | 57,762 | 79.1 | +3.5 | ||
| Conservative hold | Swing | −4.1 | |||
Elections in the 1980s
| Party | Candidate | Votes | % | ± | |
|---|---|---|---|---|---|
| Conservative | Graham Bright | 24,762 | 46.2 | +4.3 | |
| Labour | William McKenzie | 19,647 | 36.7 | +3.4 | |
| Liberal | Peter Chapman | 9,146 | 17.1 | −7.8 | |
| Majority | 5,115 | 9.6 | +1.0 | ||
| Turnout | 53,555 | 75.2 | −0.6 | ||
| Conservative hold | Swing | ||||
| Party | Candidate | Votes | % | ± | |
|---|---|---|---|---|---|
| Conservative | Graham Bright | 22,531 | 41.9 | N/A | |
| Labour | Ivor Clemitson | 17,910 | 33.3 | N/A | |
| Liberal | David Franks | 13,395 | 24.9 | N/A | |
| Majority | 4,621 | 8.6 | N/A | ||
| Turnout | 53,836 | 75.8 | N/A | ||
| Conservative win (new seat) | |||||
See also
Notes and references
- Notes
- ↑ A borough constituency (for the purposes of election expenses and type of returning officer)
- ↑ As with all constituencies, the constituency elects one Member of Parliament (MP) by the first past the post system of election at least every five years.
- References
- ↑ "Electorate Figures – Boundary Commission for England". 2011 Electorate Figures. Boundary Commission for England. 4 March 2011. Archived from the original on 6 November 2010. Retrieved 13 March 2011.
- ↑ "'Luton South', June 1983 up to May 1997". ElectionWeb Project. Cognitive Computing Limited. Archived from the original on 13 March 2016. Retrieved 12 March 2016.
- ↑ Williams, Rob (14 December 2012). "Former Labour MP Margaret Moran escapes jail and criminal conviction despite fiddling £53,000 of expenses from taxpayer". The Independent. Retrieved 26 April 2017.
- ↑ Leigh Rayment's Historical List of MPs – Constituencies beginning with "L" (part 4)
- ↑ "Election Data 2015". Electoral Calculus. Archived from the original on 17 October 2015. Retrieved 17 October 2015.
- ↑ "Election Data 2010". Electoral Calculus. Archived from the original on 26 July 2013. Retrieved 17 October 2015.
- ↑ Statement of Persons Nominated Archived 4 May 2010 at the Wayback Machine. Luton Borough Council
- ↑ "Election Data 2005". Electoral Calculus. Archived from the original on 15 October 2011. Retrieved 18 October 2015.
- ↑ "Election Data 2001". Electoral Calculus. Archived from the original on 15 October 2011. Retrieved 18 October 2015.
- ↑ Vote 2001: Luton South, BBC News
- ↑ "Election Data 1997". Electoral Calculus. Archived from the original on 15 October 2011. Retrieved 18 October 2015.
- ↑ "Election Data 1992". Electoral Calculus. Archived from the original on 15 October 2011. Retrieved 18 October 2015.
- ↑ "Politics Resources". Election 1992. Politics Resources. 9 April 1992. Retrieved 6 December 2010.
- ↑ "Election Data 1987". Electoral Calculus. Archived from the original on 15 October 2011. Retrieved 18 October 2015.
- ↑ "Election Data 1983". Electoral Calculus. Archived from the original on 15 October 2011. Retrieved 18 October 2015.