Ribble Valley (UK Parliament constituency)
Coordinates: 53°52′23″N 2°23′28″W / 53.873°N 2.391°W
| Ribble Valley | |
|---|---|
|
County constituency for the House of Commons | |
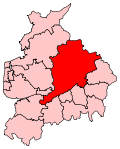 Boundary of Ribble Valley in Lancashire. | |
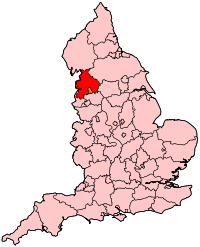 Location of Lancashire within England. | |
| County | Lancashire |
| Electorate | 77,437 (December 2010)[1] |
| Major settlements | Bamber Bridge, Clitheroe, Gisburn |
| Current constituency | |
| Created | 1983 |
| Member of parliament | Nigel Evans (Conservative) |
| Number of members | One |
| Created from | Clitheroe, Preston North, Darwen, Skipton and Fylde South[2] |
| Overlaps | |
| European Parliament constituency | North West England |
Ribble Valley is a constituency[n 1] represented in the House of Commons of the UK Parliament since 1992 by Nigel Evans, a Conservative.[n 2]
History
The Ribble Valley constituency was created in 1983 almost wholly from the former seat of Clitheroe. Much of the eastern part of the constituency lies within the historic county boundaries of the West Riding of Yorkshire.
Constituency profile
The constituency enjoys scenic villages for both commuters and the retired, and has slightly higher than national average income and much lower than average reliance upon social housing.[3][4] By December 2012, unemployment was significantly lower than the national average.[5]
With the exception of one year when, following an by-election, it was represented by a Liberal Democrat, the MP has been a Conservative; the lowest majority was 11.6% in 1997. Boundary changes in 2010 brought in more urban areas from the neighbouring South Ribble district, and with it a large number of Labour voters, particularly in Bamber Bridge where all four local councilors are Labour, but also in Farington and Lostock Hall.
Six of the divisions on Lancashire County Council within the Ribble Valley Constituency after the United Kingdom local elections, 2013 were Conservative, with Labour having one. The Conservatives gained one division each from the LibDems and the Idle Toad parties, while Labour took one from the Conservatives. Labour also gained another Conservative seat that crosses the boundaries of the Ribble Valley and South Ribble constituencies.[6]
The Constituency comprises the whole of the Borough of Ribble Valley and a part of the Borough of South Ribble. In March 2015, two councillors, a Liberal Democrat and an Independent, defected to the Conservatives. Since the May 2015 local elections the council has been composed of 35 Conservative, 4 Liberal Democrat and 1 Labour councillors. Democrat.[7] 14 of the 19 South Ribble Borough Councillors within the Ribble Valley Constituency are Conservative and 5 are Labour.
Boundaries
1983 to 1997: The Borough of Ribble Valley, and the Borough of Preston wards of Cadley, Greyfriars, Preston Rural East, and Sharoe Green.
1997 to 2010: The Borough of Ribble Valley, the City of Preston wards of Cadley, Greyfriars, Preston Rural East, Sharoe Green, and Sherwood, and the Borough of South Ribble wards of All Saints, and Samlesbury and Cuerdale.
2010 to 2015: The Borough of Ribble Valley, and the ten Borough of South Ribble wards of Bamber Bridge East, Bamber Bridge North, Bamber Bridge West, Coupe Green and Gregson Lane, Farington East, Farington West, Lostock Hall, Samlesbury and Walton, Tardy Gate, and Walton-le-Dale.
2015–present: The Borough of Ribble Valley, and the nine Borough of South Ribble wards of Bamber Bridge East, Bamber Bridge West, Coupe Green and Gregson Lane, Farington East, Farington West, Lostock Hall, Samlesbury and Walton, Walton-le-Dale East and Walton-le-Dale West.
In the run up to the 2010 General Election, the Boundary Commission's Fifth Periodic Review of Westminster constituencies led Parliament to approve the creation of a new seat of Wyre and Preston North. This creation caused major changes to seats including Ribble Valley, bringing a more urban element to the largely farming and rural mix of the existing seat.
Members of Parliament
| Election | Member[8] | Party | Notes | |
|---|---|---|---|---|
| 1983 | David Waddington | Conservative | Government Chief Whip 1987–1989; Home Secretary 1989–1990; Resigned 1990, on being raised to the peerage | |
| 1991 by election | Michael Carr | Liberal Democrat | Defeated at 1992 General Election | |
| 1992 | Nigel Evans | Conservative | First Deputy Chairman of Ways and Means 2010–2013 | |
| 2013 | Independent | |||
| 2014 | Conservative | |||
Elections
Elections in the 2010s
| Party | Candidate | Votes | % | ± | |
|---|---|---|---|---|---|
| Conservative | Nigel Evans | 31,919 | 57.8 | +9.2 | |
| Labour | David Hinder | 18,720 | 33.9 | +11.3 | |
| Liberal Democrat | Allan Knox | 3,247 | 5.9 | +0.6 | |
| Green | Graham Sowter | 1,314 | 2.4 | −1.8 | |
| Majority | 13,199 | 23.9 | −2.1 | ||
| Turnout | 55,363 | 70.8 | +3.7 | ||
| Conservative hold | Swing | −1.0 | |||
| Party | Candidate | Votes | % | ± | |
|---|---|---|---|---|---|
| Conservative | Nigel Evans | 25,404 | 48.6 | −1.7 | |
| Labour | David Hinder | 11,798 | 22.6 | +0.5 | |
| UKIP | Shirley Parkinson | 8,250 | 15.8 | +9.1 | |
| Liberal Democrat | Jackie Pearcey | 2,756 | 5.3 | −15.2 | |
| Green | Graham Sowter | 2,193 | 4.2 | +4.2 | |
| Independent | David Brass | 1,498 | 2.9 | N/A | |
| Independent | Grace Astley | 288 | 0.6 | N/A | |
| Independent | Tony Johnson | 56 | 0.1 | −0.3 | |
| Majority | 13,606 | 26.0 | −2.3 | ||
| Turnout | 52,243 | 67.1 | +0.1 | ||
| Conservative hold | Swing | −1.1 | |||
| Party | Candidate | Votes | % | ± | |
|---|---|---|---|---|---|
| Conservative | Nigel Evans | 26,298 | 50.3 | +5.4 | |
| Labour | Paul Foster | 11,529 | 22.0 | −7.8 | |
| Liberal Democrat | Allan Knox | 10,732 | 20.5 | −2.1 | |
| UKIP | Stephen Rush | 3,496 | 6.7 | +4.0 | |
| Independent | Tony Johnson | 232 | 0.4 | N/A | |
| Majority | 14,769 | 28.3 | +13.2 | ||
| Turnout | 52,287 | 67.0 | +5.5 | ||
| Conservative hold | Swing | +6.6 | |||
Elections in the 2000s
| Party | Candidate | Votes | % | ± | |
|---|---|---|---|---|---|
| Conservative | Nigel Evans | 25,834 | 51.9 | +0.4 | |
| Liberal Democrat | Julie Young | 11,663 | 22.6 | −5.2 | |
| Labour | Jack Davenport | 10,924 | 21.9 | +2.1 | |
| UKIP | Kevin Henry | 1,345 | 2.7 | N/A | |
| Majority | 14,171 | 28.5 | |||
| Turnout | 49,776 | 65.7 | −0.5 | ||
| Conservative hold | Swing | +2.8 | |||
| Party | Candidate | Votes | % | ± | |
|---|---|---|---|---|---|
| Conservative | Nigel Evans | 25,308 | 51.5 | +4.8 | |
| Liberal Democrat | Michael Carr | 14,070 | 28.6 | −6.4 | |
| Labour | Marcus B. Johnstone | 9,793 | 19.9 | +4.2 | |
| Majority | 11,238 | 22.9 | |||
| Turnout | 49,171 | 66.2 | −12.3 | ||
| Conservative hold | Swing | ||||
Elections in the 1990s
| Party | Candidate | Votes | % | ± | |
|---|---|---|---|---|---|
| Conservative | Nigel Evans | 26,702 | 46.7 | −5.9 | |
| Liberal Democrat | Michael Carr | 20,062 | 35.1 | −3.2 | |
| Labour | Marcus B. Johnstone | 9,013 | 15.7 | +7.0 | |
| Referendum | Julian Parkinson | 1,297 | 2.3 | N/A | |
| Natural Law | Nicola Holmes | 147 | 0.2 | +0.0 | |
| Majority | 6,640 | 11.6 | |||
| Turnout | 57,221 | 78.5 | |||
| Conservative hold | Swing | ||||
| Party | Candidate | Votes | % | ± | |
|---|---|---|---|---|---|
| Conservative | Nigel Evans | 29,178 | 52.4 | −8.5 | |
| Liberal Democrat | Michael Carr | 22,636 | 40.6 | +19.2 | |
| Labour | Ronald Pickup | 3,649 | 6.5 | −;11.2 | |
| Raving Loony Green Giant | David Beesley | 152 | 0.3 | N/A | |
| Natural Law | Nicola Holmes | 112 | 0.2 | N/A | |
| Majority | 6,542 | 11.7 | −27.7 | ||
| Turnout | 55,727 | 85.0 | +5.9 | ||
| Conservative hold | Swing | ||||
| Party | Candidate | Votes | % | ± | |
|---|---|---|---|---|---|
| Liberal Democrat | Michael Carr | 22,377 | 48.5 | +27.1 | |
| Conservative | Nigel Evans | 17,776 | 38.5 | −22.3 | |
| Labour | Josephine Farrington | 4,356 | 9.5 | −8.3 | |
| Ind. Conservative | David Brass | 611 | 1.3 | N/A | |
| Green | Halldora Ingham | 466 | 1.0 | N/A | |
| Monster Raving Loony | Screaming Lord Sutch | 278 | 0.6 | N/A | |
| Liberal | Simon Taylor | 133 | 0.3 | N/A | |
| Independent - Corrective Party | Lindi St Claire | 72 | 0.2 | N/A | |
| Raving Loony Green Giant Clitheroe Kid | Stuart Hughes | 60 | 0.1 | N/A | |
| Majority | 4,601 | 10.0 | |||
| Turnout | 46,129 | 71.1 | |||
| Liberal Democrat gain from Conservative | Swing | +24.7 | |||
Elections in the 1980s
| Party | Candidate | Votes | % | ± | |
|---|---|---|---|---|---|
| Conservative | David Waddington | 30,136 | 60.9 | −2.5 | |
| Social Democratic | Michael Carr | 10,608 | 21.4 | −1.7 | |
| Labour | Greg Pope | 8,781 | 17.7 | +4.2 | |
| Majority | 19,528 | 39.4 | |||
| Turnout | 49,525 | 79.1 | |||
| Conservative hold | Swing | −0.4 | |||
| Party | Candidate | Votes | % | ± | |
|---|---|---|---|---|---|
| Conservative | David Waddington | 29,223 | 63.4 | N/A | |
| Social Democratic | Michael Carr | 10,632 | 23.1 | N/A | |
| Labour | Edward Saville | 6,214 | 13.5 | N/A | |
| Majority | 18,591 | 40.4 | N/A | ||
| Turnout | 46,060 | 76.8 | N/A | ||
| Conservative win (new seat) | |||||
See also
Notes and references
- Notes
- ↑ A county constituency (for the purposes of election expenses and type of returning officer)
- ↑ As with all constituencies, the constituency elects one Member of Parliament (MP) by the first past the post system of election at least every five years.
- References
- ↑ "Electorate Figures - Boundary Commission for England". 2011 Electorate Figures. Boundary Commission for England. 4 March 2011. Archived from the original on 6 November 2010. Retrieved 13 March 2011.
- ↑ "'Ribble Valley', June 1983 up to May 1997". ElectionWeb Project. Cognitive Computing Limited. Retrieved 13 March 2016.
- ↑ "Local statistics - Office for National Statistics". neighbourhood.statistics.gov.uk. Retrieved 13 April 2018.
- ↑ "2011 census interactive maps". ons.gov.uk. Archived from the original on 29 January 2016. Retrieved 13 April 2018.
- ↑ Unemployment claimants by constituency The Guardian
- ↑ Hydes, Alice. "Lancashire County Council Election 2013". www.ribblevalley.gov.uk. Retrieved 13 April 2018.
- ↑ "Archived copy". Archived from the original on 2013-04-12. Retrieved 2013-05-05.
- ↑ Leigh Rayment's Historical List of MPs – Constituencies beginning with "R" (part 1)
- ↑ "Ribble Valley parliamentary constituency". BBC News.
- ↑ "Election Data 2015". Electoral Calculus. Archived from the original on 17 October 2015. Retrieved 17 October 2015.
- ↑ "Ribble Valley". BBC News. Retrieved 11 May 2015.
- ↑ "Election Data 2010". Electoral Calculus. Archived from the original on 26 July 2013. Retrieved 17 October 2015.
- ↑ "BBC News - Election 2010 - Constituency - Ribble Valley". news.bbc.co.uk. Retrieved 13 April 2018.
- ↑ "Election Data 2005". Electoral Calculus. Archived from the original on 15 October 2011. Retrieved 18 October 2015.
- ↑ "Election Data 2001". Electoral Calculus. Archived from the original on 15 October 2011. Retrieved 18 October 2015.
- ↑ "Election Data 1997". Electoral Calculus. Archived from the original on 15 October 2011. Retrieved 18 October 2015.
- ↑ "Election Data 1992". Electoral Calculus. Archived from the original on 15 October 2011. Retrieved 18 October 2015.
- ↑ "UK General Election results April 1992". Richard Kimber's Political Science Resources. Politics Resources. 9 April 1992. Retrieved 2010-12-06.
- ↑ "Election Data 1987". Electoral Calculus. Archived from the original on 15 October 2011. Retrieved 18 October 2015.
- ↑ "Election Data 1983". Electoral Calculus. Archived from the original on 15 October 2011. Retrieved 18 October 2015.