Brentwood and Ongar (UK Parliament constituency)
| Brentwood and Ongar | |
|---|---|
|
County constituency for the House of Commons | |
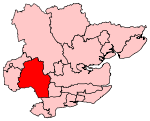 Boundary of Brentwood and Ongar in Essex for the 2010 general election. | |
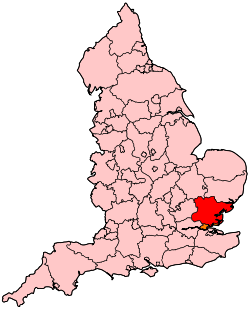 Location of Essex within England. | |
| County | Essex |
| Population | 92,957 (2011 census)[1] |
| Electorate | 71,041 (December 2010)[2] |
| Current constituency | |
| Created | 1974 |
| Member of parliament | Alex Burghart (Conservative) |
| Number of members | One |
| Created from | Billericay |
| Overlaps | |
| European Parliament constituency | East of England |
Brentwood and Ongar is a constituency[n 1] represented in the House of Commons of the UK Parliament since 2017 by Alex Burghart, a Conservative.[n 2]
History
Created in 1974, the seat was held by Eric Pickles, between the General Election in 1992 and 2017 when he stood down. The Liberal Democrats amassed their largest share of the vote in 1992 (including results for their two predecessor parties). At the 2010 election their candidate was second-placed with 13.6% of the vote, ahead of the Labour Party's candidate.
In the 2001 election, Pickles was opposed by Martin Bell, who had represented the Tatton constituency in the last Parliament as an independent and had pledged not to seek re-election there. Bell failed to gain Brentwood and Ongar from the Conservatives, but cut the Conservative majority to just 6.5%, the lowest in the seat's history.
Boundaries
1974–1983: The Urban District of Brentwood, and in the Rural District of Epping and Ongar the civil parishes of Abbess Beauchamp and Berners Roding, Blackmore, Bobbingworth, Doddinghurst, Fyfield, High Laver, High Ongar, Kelvedon Hatch, Lambourne, Little Laver, Moreton, Navestock, Ongar, Stanford Rivers, Stapleford Abbotts, Stapleford Tawney, Stondon Massey, Theydon Mount, and Willingale.
1983–2010: The District of Brentwood, and the District of Epping Forest wards of Chipping Ongar, Greensted and Marden Ash, High Ongar, Lambourne, Moreton and Matching, Passingford, Roothing Country, and Shelley.
2010–present: The Borough of Brentwood, and the District of Epping Forest wards of Chipping Ongar, Greensted and Marden Ash, High Ongar, Willingale and The Rodings, Lambourne, Moreton and Fyfield, North Weald Bassett, Passingford, and Shelley.
Members of Parliament
| Election | Member[3][4] | Party | |
|---|---|---|---|
| Feb 1974 | Sir Robert McCrindle | Conservative | |
| 1992 | Sir Eric Pickles | Conservative | |
| 2017 | Alex Burghart | Conservative | |
Elections
Elections in the 2010s
| Party | Candidate | Votes | % | ± | |
|---|---|---|---|---|---|
| Conservative | Alex Burghart | 34,811 | 65.8 | ||
| Labour | Gareth Barrett | 10,809 | 20.4 | ||
| Liberal Democrat | Karen Chilvers | 4,426 | 8.4 | ||
| UKIP | Mick McGough | 1,845 | 3.5 | ||
| Green | Paul Jeater | 915 | 1.7 | ||
| Independent | Louca Kousoulou | 104 | 0.2 | N/A | |
| Majority | 24,002 | 45.4 | |||
| Turnout | 52,910 | 70.6 | |||
| Conservative hold | Swing | ||||
| Party | Candidate | Votes | % | ± | |
|---|---|---|---|---|---|
| Conservative | Eric Pickles | 30,534 | 58.8 | ||
| UKIP | Mick McGough | 8,724 | 16.8 | ||
| Labour | Liam Preston | 6,492 | 12.5 | ||
| Liberal Democrat | David Kendall | 4,577 | 8.8 | ||
| Green | Reza Hossain | 1,397 | 2.7 | ||
| English Democrat | Robin Tilbrook | 173 | 0.3 | ||
| Majority | 21,810 | 42.0 | |||
| Turnout | 51,897 | 71.6 | |||
| Conservative hold | Swing | ||||
| Party | Candidate | Votes | % | ± | |
|---|---|---|---|---|---|
| Conservative | Eric Pickles | 28,792 | 56.9 | ||
| Liberal Democrat | David Kendall | 11,872 | 23.5 | ||
| Labour | Heidi Benzing | 4,992 | 9.9 | ||
| UKIP | Michael McGough | 2,037 | 4.0 | ||
| BNP | Paul Morris | 1,447 | 2.9 | N/A | |
| Green | Jess Barnecutt | 584 | 1.2 | N/A | |
| English Democrat | Robin Tilbrook | 491 | 1.0 | N/A | |
| Independent | James Sapwell | 263 | 0.5 | N/A | |
| Independent | Danny Attfield | 113 | 0.2 | N/A | |
| Majority | 16,920 | 33.4 | |||
| Turnout | 50,591 | 71.9 | |||
| Conservative hold | Swing | ||||
Elections in the 2000s
| Party | Candidate | Votes | % | ± | |
|---|---|---|---|---|---|
| Conservative | Eric Pickles | 23,609 | 53.5 | ||
| Liberal Democrat | Gavin Stollar | 11,997 | 27.2 | ||
| Labour | John Adams | 6,579 | 14.9 | ||
| UKIP | Stuart Gulleford | 1,805 | 4.1 | ||
| Independent | Anthony Appleton | 155 | 0.4 | ||
| Majority | 11,612 | 26.3 | |||
| Turnout | 44,145 | 68.4 | |||
| Conservative hold | Swing | ||||
| Party | Candidate | Votes | % | ± | |
|---|---|---|---|---|---|
| Conservative | Eric Pickles | 16,558 | 38.0 | ||
| Independent | Martin Bell | 13,737 | 31.5 | N/A | |
| Liberal Democrat | David Kendall | 6,772 | 15.6 | ||
| Labour | Diana Johnson | 5,505 | 12.6 | ||
| UKIP | Kenneth Gulleford | 611 | 1.4 | ||
| Independent | Peter Pryke | 239 | 0.5 | N/A | |
| Church of the Militant Elvis | David Bishop | 68 | 0.2 | N/A | |
| Independent | Anthony Appleton | 52 | 0.1 | N/A | |
| Majority | 2,821 | 6.5 | |||
| Turnout | 43,542 | 67.3 | |||
| Conservative hold | Swing | ||||
Elections in the 1990s
| Party | Candidate | Votes | % | ± | |
|---|---|---|---|---|---|
| Conservative | Eric Pickles | 23,031 | 45.4 | ||
| Liberal Democrat | Elizabeth Bottomley | 13,341 | 26.3 | ||
| Labour | Marc Young | 11,231 | 22.1 | ||
| Referendum | Angela Kilmartin | 2,658 | 5.2 | N/A | |
| UKIP | David Mills | 465 | 0.9 | N/A | |
| Majority | 9,690 | 19.1 | |||
| Turnout | 50,726 | 76.6 | |||
| Conservative hold | Swing | ||||
| Party | Candidate | Votes | % | ± | |
|---|---|---|---|---|---|
| Conservative | Eric Pickles | 32,145 | 57.6 | ||
| Liberal Democrat | Elizabeth Bottomley | 17,000 | 30.5 | ||
| Labour | Jeremiah Keohane | 6,080 | 10.9 | ||
| Green | Carolyn Bartley | 555 | 1.0 | ||
| Majority | 15,145 | 27.2 | |||
| Turnout | 55,780 | 84.7 | |||
| Conservative hold | Swing | ||||
Elections in the 1980s
| Party | Candidate | Votes | % | ± | |
|---|---|---|---|---|---|
| Conservative | Robert McCrindle | 32,258 | 60.5 | ||
| Liberal | Nicholas Amor | 13,337 | 25.0 | ||
| Labour | James Orpe | 7,042 | 13.2 | ||
| Green | Margaret Willis | 686 | 1.3 | N/A | |
| Majority | 18,921 | 35.5 | |||
| Turnout | 53323 | 79.0 | |||
| Conservative hold | Swing | ||||
| Party | Candidate | Votes | % | ± | |
|---|---|---|---|---|---|
| Conservative | Robert McCrindle | 29,484 | 58.4 | ||
| Liberal | Nicholas Amor | 15,282 | 30.3 | ||
| Labour | James Orpe | 5,739 | 11.4 | ||
| Majority | 14,202 | 28.1 | |||
| Turnout | 50505 | 76.6 | |||
| Conservative hold | Swing | ||||
Elections in the 1970s
| Party | Candidate | Votes | % | ± | |
|---|---|---|---|---|---|
| Conservative | Robert McCrindle | 29,113 | 60.4 | ||
| Labour | Ian James Crofton Peddie | 12,182 | 25.3 | ||
| Liberal | Colin Cenydd Jones | 6,882 | 14.3 | ||
| Majority | 16,931 | 35.1 | |||
| Turnout | 48,177 | 80.6 | |||
| Conservative hold | Swing | ||||
| Party | Candidate | Votes | % | ± | |
|---|---|---|---|---|---|
| Conservative | Robert McCrindle | 21,136 | 46.9 | ||
| Labour | Henry Edward Miller | 13,190 | 29.3 | ||
| Liberal | Lionel Rufus Wernick | 10,725 | 23.8 | ||
| Majority | 7,946 | 17.6 | |||
| Turnout | 45,051 | 77.2 | |||
| Conservative hold | Swing | ||||
| Party | Candidate | Votes | % | ± | |
|---|---|---|---|---|---|
| Conservative | Robert McCrindle | 22,545 | 46.6 | N/A | |
| Liberal | Lionel Rufus Wernick | 13,452 | 27.8 | N/A | |
| Labour | Maurice Howard Rosen | 12,398 | 25.6 | N/A | |
| Majority | 9,093 | 18.8 | N/A | ||
| Turnout | 48,395 | 83.8 | N/A | ||
| Conservative win (new seat) | |||||
Graphical representation
| 25.6% | 27.8% | 46.6% |
| Labour | Liberal | Conservative |
| 29.3% | 23.8% | 46.9% |
| Labour | Liberal | Conservative |
| 25.3% | 14.3% | 60.4% |
| Labour | Liberal | Conservative |
| 11.4% | 30.3% | 58.4% |
| Labour | Liberal | Conservative |
| 13.2% | 25.0% | 60.5% | |
| Labour | Liberal | Conservative |
| 10.9% | 30.5% | 57.6% | |
| Labour | Lib Dems | Conservative |
| 22.1% | 26.3% | 45.4% | ||
| Labour | Lib Dems | Conservative | Ref |
| 12.6% | 15.6% | 31.5% | 38.0% | ||||
| Labour | Lib Dems | Martin Bell | Conservative |
| 14.9% | 27.2% | 53.5% | ||
| Labour | Lib Dems | Conservative | UKIP |
| 9.9% | 23.5% | 56.9% | |||||
| Lab | Lib Dems | Conservative | UKIP |
| 12.5% | 58.8% | 16.8% | |||
| Labour | Lib Dems | Conservative | UKIP |
| 20.4% | 65.8% | ||||
| Labour | Lib Dems | Conservative | UKIP |
See also
Notes and references
- Notes
- ↑ A county constituency (for the purposes of election expenses and type of returning officer)
- ↑ As with all constituencies, the constituency elects one Member of Parliament (MP) by the first past the post system of election at least every five years.
- References
- ↑ "Brentwood and Ongar: Usual Resident Population, 2011". Neighbourhood Statistics. Office for National Statistics. Retrieved 2 February 2015.
- ↑ "Electorate Figures – Boundary Commission for England". 2011 Electorate Figures. Boundary Commission for England. 4 March 2011. Archived from the original on 6 November 2010. Retrieved 13 March 2011.
- ↑ "Brentwood and Ongar 1974–". Hansard 1803–2005. UK Parliament. Retrieved 2 February 2015.
- ↑ Leigh Rayment's Historical List of MPs – Constituencies beginning with "B" (part 5)
- ↑ "Karen Chilvers announced as snap General Election candidate". 20 April 2017. Retrieved 28 April 2017.
- ↑ "Election Data 2015". Electoral Calculus. Archived from the original on 17 October 2015. Retrieved 17 October 2015.
- ↑ "Election Data 2010". Electoral Calculus. Archived from the original on 26 July 2013. Retrieved 17 October 2015.
- ↑ "BBC NEWS – Election 2010 – Brentwood & Ongar". BBC News.
- ↑ "Election Data 2005". Electoral Calculus. Archived from the original on 15 October 2011. Retrieved 18 October 2015.
- ↑ "Election Data 2001". Electoral Calculus. Archived from the original on 15 October 2011. Retrieved 18 October 2015.
- ↑ "Election Data 1997". Electoral Calculus. Archived from the original on 15 October 2011. Retrieved 18 October 2015.
- ↑ "Election Data 1992". Electoral Calculus. Archived from the original on 15 October 2011. Retrieved 18 October 2015.
- ↑ "Politics Resources". Election 1992. Politics Resources. 9 April 1992. Retrieved 2010-12-06.
- ↑ "Election Data 1987". Electoral Calculus. Archived from the original on 15 October 2011. Retrieved 18 October 2015.
- ↑ "Election Data 1983". Electoral Calculus. Archived from the original on 15 October 2011. Retrieved 18 October 2015.
External links
- nomis Constituency Profile for Brentwood and Ongar — presenting data from the ONS annual population survey and other official statistics.