Leeds Central (UK Parliament constituency)
| Leeds Central (now named Leeds Centre) | |
|---|---|
|
Borough constituency for the House of Commons | |
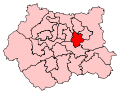 Boundary of Leeds Central (now named Leeds Centre) in West Yorkshire. | |
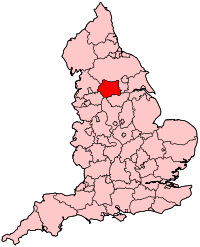 Location of West Yorkshire within England. | |
| County | West Yorkshire |
| Electorate | 80,912 (December 2010)[1] |
| Major settlements | Leeds |
| Current constituency | |
| Created | 1983 |
| Member of parliament | Hilary Benn (Labour) |
| Number of members | One |
| Created from | Leeds South, Leeds South East, Leeds East, Leeds West and Leeds North East[2] |
| 1885–1955 | |
| Replaced by | Leeds West, Leeds South and Leeds South East |
| Created from | Leeds |
| Overlaps | |
| European Parliament constituency | Yorkshire and the Humber |
Leeds Central is a constituency[n 1] recreated in 1983 represented in the House of Commons of the UK Parliament since 1999 by Hilary Benn of the Labour Party.[n 2] A former guise of the seat spanned 1885 to 1955.
Boundaries
1885-1918: The Municipal Borough of Leeds wards of Mill Hill and West, and parts of the wards of Brunswick and Central.
1918-1950: The County Borough of Leeds wards of Central, Mill Hill, South, and West, and parts of the wards of Brunswick, Headingley, and North West.
1950-1955: The County Borough of Leeds wards of Armley and New Wortley, Blenheim, Central, Holbeck North, Mill Hill, and South and Westfield.
1983-1997: The City of Leeds wards of Beeston, City and Holbeck, Richmond Hill, and University.
1997-2010: As above plus Hunslet.
2010–present: The City of Leeds wards of Beeston and Holbeck, Burmantofts and Richmond Hill, City and Hunslet, Hyde Park and Woodhouse, and Middleton Park.
Constituency profile
The business and retail centre of Leeds is at the heart. A relatively affluent hub having a large minority of its housing forming by luxury, well-served apartments or streets of grand middle-class Victorian houses, the seat has sporadic deprivation, typified by certain densely packed rows of terraced houses, home to many Labour-inclined and often low-income voters. Two large, well-ranked, universities in the city centre, the professional services sector and a 21st-century increase in technology businesses has brought prosperity to the younger generations of the city. The older generations of the city have lived through the closure of many mass consumer product manufacturing and materials processing businesses in Leeds throughout the mid-20th century.[3] Leeds' two universities produce a significant student electorate.[3][4] Middleton in the south of the seat has a golf course, a miniature railway and an upcoming urban mountain bike trail centre within the boundaries.
| Status | Number |
|---|---|
| Not Deprived in Any Dimension | 16,201 |
| Deprived in 1 Dimension | 21,519 |
| Deprived in 2 Dimensions | 13,586 |
| Deprived in 3 Dimensions | 5,205 |
| Deprived in 4 Dimensions | 697 |
History
First creation
The constituency was created in 1885 by the Redistribution of Seats Act 1885, and was first used in the general election of that year *the large Leeds seat had previously been represented by two MPs (1832–1868) and three MPs (1868–1885)). From 1885 it was represented by five single-member constituencies: Leeds Central, Leeds East, Leeds North, Leeds South and Leeds West. The constituencies of Morley, Otley and Pudsey were also created in 1885. The constituency was abolished in 1955. After the 1955 general election Leeds was represented by Leeds East (created 1885, abolished 1918, recreated 1955), Leeds North East (created 1918), Leeds North West (created 1950), Leeds South (created 1885), and Leeds South East (created 1918). There were also constituencies of Batley and Morley (created 1918) and Pudsey (created 1885, replaced by Pudsey and Otley 1918-1950).
Second creation, current creation
- Revival
The constituency was re-created for the 1983 general election.
- Results of the winning party
The seat has been won by the Labour Party's candidate since 1983. Benn, elected in 1999 on the demise of Fatchett, has achieved an absolute majority (plurality of votes) in three of five elections for Leeds Central. The 2015 result made the seat the 40-safest of Labour's 232 seats by percentage of majority.[6]
- Opposition parties
Conservative runner-up, Wilson, in 2015 failed to reflect the positive national swing and fell to 17.3% of the votes cast. A candidature of UKIP, not present in 2010, saw a total share of the vote, hence positive swing, of 15.7% and thus third position.[n 3]. Green Party running, not present in 2010, resulted in a 7.9% polling and fourth-place, its candidate retained his deposit. The fifth-placed Liberal Democrat forfeited her deposit.[n 4].
- Turnout
In general elections turnout has ranged from 87.9% in 1910 to 41.7% in 2001. In its 1999 by-election the constituency experienced the lowest voter turnout post-war of 19.6%.[7][8][4]
Members of Parliament
MPs 1885–1955
| Election | Member[9] | Party | |
|---|---|---|---|
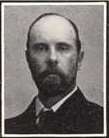
| 1885 | Gerald Balfour | Conservative | |
| 1906 | Robert Armitage | Liberal | |
| 1922 | Arthur Wellesley Willey | Conservative | |
| 1923 by-election | Sir Charles Henry Wilson | Conservative | |
| 1929 | Richard Denman | Labour | |
| 1931 | National Labour | ||
| 1945 | George Porter | Labour | |
| 1955 | constituency abolished | ||
MPs since 1983
| Election | Member[9] | Party | |
|---|---|---|---|
| 1983 | Derek Fatchett | Labour | |
| 1999 by-election | Hilary Benn | Labour | |
Elections
Elections in the 2010s
| Party | Candidate | Votes | % | ± | |
|---|---|---|---|---|---|
| Labour | Hilary Benn | 33,453 | 70.2 | +15.2 | |
| Conservative | Gareth Davies | 9,755 | 20.5 | +3.2 | |
| UKIP | Bill Palfreman | 2,056 | 4.3 | -11.4 | |
| Green | Ed Carlisle | 1,189 | 2.5 | -5.4 | |
| Liberal Democrat | Andy Nash | 1,063 | 2.2 | -1.2 | |
| Christian Peoples | Alex Coetzee | 157 | 0.3 | N/A | |
| Majority | 23,698 | 49.7 | +12.0 | ||
| Turnout | 47,673 | 53.2 | -1.9 | ||
| Labour hold | Swing | +6.0 | |||
| Party | Candidate | Votes | % | ± | |
|---|---|---|---|---|---|
| Labour | Hilary Benn | 24,758 | 55.0 | +5.7 | |
| Conservative | Nicola Wilson | 7,791 | 17.3 | -2.9 | |
| UKIP | Luke Senior | 7,082 | 15.7 | N/A | |
| Green | Michael Hayton | 3,558 | 7.9 | N/A | |
| Liberal Democrat | Emma Spriggs | 1,529 | 3.4 | -17.4 | |
| TUSC | Liz Kitching | 330 | 0.7 | N/A | |
| Majority | 16,967 | 37.7 | +9.2 | ||
| Turnout | 45,048 | 55.1 | -2.7 | ||
| Labour hold | Swing | +4.8 | |||
| Party | Candidate | Votes | % | ± | |
|---|---|---|---|---|---|
| Labour | Hilary Benn | 18,434 | 49.3 | −10.2 | |
| Liberal Democrat | Michael Taylor | 7,789 | 20.8 | −0.7 | |
| Conservative | Alan Lamb | 7,541 | 20.2 | +7.5 | |
| BNP | Kevin Meeson | 3,066 | 8.2 | +4.1 | |
| Independent | Dave Procter | 409 | 1.1 | N/A | |
| Independent | We Beat The Scum One-Nil | 155 | 0.4 | N/A | |
| Majority | 10,645 | 28.5 | −9.5 | ||
| Turnout | 37,394 | 57.8 | +13.5 | ||
| Labour hold | Swing | −4.8 | |||
Elections in the 2000s
| Party | Candidate | Votes | % | ± | |
|---|---|---|---|---|---|
| Labour | Hilary Benn | 17,526 | 60.0 | -6.9 | |
| Liberal Democrat | Ruth Coleman | 5,660 | 19.4 | +6.2 | |
| Conservative | Brian Cattell | 3,865 | 13.2 | -1.1 | |
| BNP | Mark Collett | 1,201 | 4.1 | N/A | |
| UKIP | Peter Sewards | 494 | 1.7 | -1.1 | |
| Independent | Mick Dear | 189 | 0.6 | N/A | |
| Independent | Oluwole Taiwo | 126 | 0.4 | N/A | |
| Alliance for Change | Julian Fitzgerald | 125 | 0.4 | N/A | |
| Majority | 11,866 | 40.7 | |||
| Turnout | 29,186 | 46.4 | +4.7 | ||
| Labour hold | Swing | ||||
| Party | Candidate | Votes | % | ± | |
|---|---|---|---|---|---|
| Labour | Hilary Benn | 18,277 | 66.9 | -2.7 | |
| Conservative | Victoria Richmond | 3,896 | 14.3 | +0.5 | |
| Liberal Democrat | Stewart Arnold | 3,607 | 13.2 | +2.0 | |
| UKIP | David Burgess | 775 | 2.8 | N/A | |
| Socialist Alliance | Stephen Johnston | 751 | 2.8 | N/A | |
| Majority | 14,381 | 52.6 | |||
| Turnout | 27,306 | 41.7 | -12.5 | ||
| Labour hold | Swing | ||||
Elections in the 1990s
| Party | Candidate | Votes | % | ± | |
|---|---|---|---|---|---|
| Labour | Hilary Benn | 6,361 | 48.2 | -21.4 | |
| Liberal Democrat | Peter Wild | 4,068 | 30.8 | +19.6 | |
| Conservative | Edward Wild | 1,618 | 12.3 | -1.4 | |
| Green | David Blackburn | 478 | 3.6 | N/A | |
| UKIP | Raymond Northgreaves | 353 | 2.7 | N/A | |
| Leeds Left Alliance | Chris Hill | 258 | 2.0 | N/A | |
| Independent | Julian Fitzgerald | 51 | 0.4 | N/A | |
| Majority | 2,293 | 17.4 | |||
| Turnout | 13,187 | 19.6 | |||
| Labour hold | Swing | ||||
| Party | Candidate | Votes | % | ± | |
|---|---|---|---|---|---|
| Labour | Derek Fatchett | 25,766 | 69.6 | ||
| Conservative | Edward Wild | 5,077 | 13.7 | ||
| Liberal Democrat | David Freeman | 4,164 | 11.3 | ||
| Referendum | Philip Myers | 1,042 | 2.8 | N/A | |
| Socialist Labour | Mick Rix | 656 | 1.8 | N/A | |
| Socialist Alternative | Chris Hill | 304 | 0.8 | N/A | |
| Majority | 20,689 | 55.9 | |||
| Turnout | 54.7 | ||||
| Labour hold | Swing | ||||
| Party | Candidate | Votes | % | ± | |
|---|---|---|---|---|---|
| Labour | Derek Fatchett | 23,673 | 62.2 | +6.6 | |
| Conservative | TC Holdroyd | 8,653 | 22.7 | −2.8 | |
| Liberal Democrat | David Pratt | 5,713 | 15.0 | −2.9 | |
| Majority | 15,020 | 39.5 | +9.4 | ||
| Turnout | 38,039 | 61.3 | −3.5 | ||
| Labour hold | Swing | +4.7 | |||
Elections in the 1980s
| Party | Candidate | Votes | % | ± | |
|---|---|---|---|---|---|
| Labour | Derek Fatchett | 21,270 | 55.62 | ||
| Conservative | David Schofield | 9,765 | 25.53 | ||
| Social Democratic | Karen Lee | 6,853 | 17.92 | ||
| Communist | William Innis | 355 | 0.93 | ||
| Majority | 11,505 | 30.08 | |||
| Turnout | 59,019 | 64.80 | |||
| Labour hold | Swing | ||||
| Party | Candidate | Votes | % | ± | |
|---|---|---|---|---|---|
| Labour | Derek Fatchett | 18,706 | 47.93 | ||
| Liberal | P. Wrigley | 10,484 | 26.86 | ||
| Conservative | M.A. Ashley-Brown | 9,181 | 23.55 | ||
| BNP | G. Cummins | 331 | 0.85 | ||
| Communist | J.M. Rogers | 314 | 0.8 | ||
| Majority | 8,222 | 21.07 | |||
| Turnout | 39,030 | 61.66 | |||
| Labour win (new seat) | |||||
Elections in the 1950s
| Party | Candidate | Votes | % | ± | |
|---|---|---|---|---|---|
| Labour | George Porter | 23,967 | 62.35 | ||
| Conservative | William Barford | 14,475 | 37.65 | ||
| Majority | 9,492 | 24.69 | |||
| Turnout | 77.10 | ||||
| Labour hold | Swing | ||||
| Party | Candidate | Votes | % | ± | |
|---|---|---|---|---|---|
| Labour | George Porter | 24,030 | 60.75 | ||
| Conservative | William Barford | 13,351 | 33.75 | ||
| Liberal | Victor Delepine | 2,176 | 5.50 | ||
| Majority | 10,679 | 27.00 | |||
| Turnout | 78.26 | ||||
| Labour hold | Swing | ||||
Elections in the 1940s
| Party | Candidate | Votes | % | ± | |
|---|---|---|---|---|---|
| Labour | George Porter | 13,370 | 57.14 | ||
| Conservative | Charles Denman | 8,011 | 34.24 | ||
| Liberal | Basil Mayer Sandelson | 2,017 | 8.62 | ||
| Majority | 5,359 | 22.90 | |||
| Turnout | 63.43 | ||||
| Labour gain from National Labour | Swing | ||||
Elections in the 1930s
| Party | Candidate | Votes | % | ± | |
|---|---|---|---|---|---|
| National Labour | Richard Denman | 17,747 | 56.43 | ||
| Labour | Fred Lindley | 13,701 | 43.57 | ||
| Majority | 4,046 | 12.87 | |||
| Turnout | 61.44 | ||||
| National Labour hold | Swing | ||||
| Party | Candidate | Votes | % | ± | |
|---|---|---|---|---|---|
| National Labour | Richard Denman | 26,496 | 71.36 | ||
| Labour | Moss Turner-Samuels | 10,633 | 28.64 | ||
| Majority | 15,863 | 42.72 | |||
| Turnout | 66.20 | ||||
| National Labour gain from Labour | Swing | ||||
Elections in the 1920s
| Party | Candidate | Votes | % | ± | |
|---|---|---|---|---|---|
| Labour | Richard Denman | 17,322 | 44.6 | +4.2 | |
| Unionist | Charles Wilson | 15,958 | 41.0 | −18.6 | |
| Liberal | Myer Jack Landa | 5,607 | 14.4 | N/A | |
| Majority | 1,364 | 3.6 | N/A | ||
| Turnout | 38,887 | 68.9 | +7.9 | ||
| Registered electors | 56,417 | ||||
| Labour gain from Unionist | Swing | +11.4 | |||
| Party | Candidate | Votes | % | ± | |
|---|---|---|---|---|---|
| Unionist | Charles Wilson | 16,182 | 59.6 | +3.4 | |
| Labour | Edward John Cecil Neep | 10,975 | 40.4 | −3.4 | |
| Majority | 5,207 | 19.2 | +6.8 | ||
| Turnout | 27,157 | 61.0 | +0.9 | ||
| Registered electors | 44,532 | ||||
| Unionist hold | Swing | +3.4 | |||
| Party | Candidate | Votes | % | ± | |
|---|---|---|---|---|---|
| Unionist | Charles Wilson | 14,853 | 56.2 | +6.2 | |
| Labour | Henry Slesser | 11,574 | 43.8 | +16.0 | |
| Majority | 3,279 | 12.4 | −9.8 | ||
| Turnout | 26,427 | 60.1 | −6.0 | ||
| Registered electors | 43,972 | ||||
| Unionist hold | Swing | −4.9 | |||
| Party | Candidate | Votes | % | ± | |
|---|---|---|---|---|---|
| Unionist | Charles Wilson | 13,085 | 47.6 | −2.4 | |
| Labour | Henry Slesser | 11,359 | 41.4 | +13.6 | |
| Liberal | Gilbert Stone | 3,026 | 11.0 | −11.2 | |
| Majority | 1,726 | 6.2 | −16.0 | ||
| Turnout | 27,470 | 64.3 | −1.8 | ||
| Registered electors | 42,738 | ||||
| Unionist hold | Swing | −8.0 | |||
| Party | Candidate | Votes | % | ± | |
|---|---|---|---|---|---|
| Unionist | Arthur Willey | 14,137 | 50.0 | N/A | |
| Labour | Henry Slesser | 7,844 | 27.8 | +14.6 | |
| Liberal | Robert Armitage | 6,260 | 22.2 | −58.4 | |
| Majority | 6,293 | 22.2 | N/A | ||
| Turnout | 28,241 | 66.1 | +28.7 | ||
| Registered electors | 42,738 | ||||
| Unionist gain from Liberal | Swing | N/A | |||
Elections in the 1910s

| Party | Candidate | Votes | % | ± | |
|---|---|---|---|---|---|
| C | Liberal | Robert Armitage | 11,474 | 70.6 | +18.0 |
| Independent | * Ernest Terry | 2,634 | 16.2 | N/A | |
| Co-operative Party | Joseph Smith | 2,146 | 13.2 | N/A | |
| Majority | 8,840 | 54.4 | +49.2 | ||
| Turnout | 16,254 | 37.4 | −42.5 | ||
| Registered electors | 43,496 | ||||
| Liberal hold | Swing | N/A | |||
| C indicates candidate endorsed by the coalition government. | |||||
* Terry was supported by the three local branches of National Association of Discharged Sailors and Soldiers, National Federation of Discharged and Demobilized Sailors and Soldiers and Comrades of the Great War.
General Election 1914/15:
Another General Election was required to take place before the end of 1915. The political parties had been making preparations for an election to take place and by the July 1914, the following candidates had been selected;
- Liberal: Robert Armitage
| Party | Candidate | Votes | % | ± | |
|---|---|---|---|---|---|
| Liberal | Robert Armitage | 3,519 | 52.6 | -2.6 | |
| Conservative | John Gordon | 3,169 | 47.4 | +2.6 | |
| Majority | 350 | 5.2 | -5.2 | ||
| Turnout | 79.9 | -8.0 | |||
| Liberal hold | Swing | -2.6 | |||
| Party | Candidate | Votes | % | ± | |
|---|---|---|---|---|---|
| Liberal | Robert Armitage | 3,987 | 54.2 | ||
| Conservative | John Gordon | 3,366 | 45.8 | ||
| Majority | 621 | 8.4 | |||
| Turnout | 87.9 | ||||
| Liberal hold | Swing | ||||
Elections in the 1900s
| Party | Candidate | Votes | % | ± | |
|---|---|---|---|---|---|
| Liberal | Robert Armitage | 4,188 | 57.3 | +15.0 | |
| Conservative | Gerald Balfour | 3,119 | 42.7 | −15.0 | |
| Majority | 1,069 | 14.6 | N/A | ||
| Turnout | 7,307 | 82.2 | +9.0 | ||
| Registered electors | 8,893 | ||||
| Liberal gain from Conservative | Swing | +15.0 | |||
| Party | Candidate | Votes | % | ± | |
|---|---|---|---|---|---|
| Conservative | Gerald Balfour | 4,144 | 57.7 | +3.9 | |
| Liberal | Samuel Montagu | 3,042 | 42.3 | −3.9 | |
| Majority | 1,102 | 15.4 | +7.8 | ||
| Turnout | 7,186 | 73.2 | −9.9 | ||
| Registered electors | 9,820 | ||||
| Conservative hold | Swing | +3.9 | |||
Elections in the 1890s
| Party | Candidate | Votes | % | ± | |
|---|---|---|---|---|---|
| Conservative | Gerald Balfour | 4,631 | 53.8 | +3.2 | |
| Liberal | Leifchild Jones | 3,977 | 46.2 | −3.2 | |
| Majority | 654 | 7.6 | +6.4 | ||
| Turnout | 8,608 | 83.1 | −2.9 | ||
| Registered electors | 10,353 | ||||
| Conservative hold | Swing | +3.2 | |||
| Party | Candidate | Votes | % | ± | |
|---|---|---|---|---|---|
| Conservative | Gerald Balfour | 4,448 | 50.6 | +0.5 | |
| Liberal | John Lawson Walton | 4,335 | 49.4 | −0.5 | |
| Majority | 113 | 1.2 | +1.0 | ||
| Turnout | 8,783 | 86.0 | +10.2 | ||
| Registered electors | 10,215 | ||||
| Conservative hold | Swing | +0.5 | |||
Elections in the 1880s
| Party | Candidate | Votes | % | ± | |
|---|---|---|---|---|---|
| Conservative | Gerald Balfour | 4,225 | 50.1 | −1.7 | |
| Liberal | James Kitson[23] | 4,212 | 49.9 | +1.7 | |
| Majority | 13 | 0.2 | −3.4 | ||
| Turnout | 8,437 | 75.8 | −3.8 | ||
| Registered electors | 11,135 | ||||
| Conservative hold | Swing | −1.7 | |||
| Party | Candidate | Votes | % | ± | |
|---|---|---|---|---|---|
| Conservative | Gerald Balfour | 4,589 | 51.8 | N/A | |
| Liberal | John Barran[24] | 4,275 | 48.2 | N/A | |
| Majority | 314 | 3.6 | N/A | ||
| Turnout | 8,864 | 79.6 | N/A | ||
| Registered electors | 11,135 | ||||
| Conservative win (new seat) | |||||
See also
Notes and references
- Notes
- ↑ A borough constituency (for the purposes of election expenses and type of returning officer)
- ↑ As with all constituencies, the constituency elects one Member of Parliament (MP) by the first past the post system of election at least every five years.
- ↑ UKIP's swing nationally was +9.5% in 2015
- ↑ The Liberal Democrats's swing nationally was -15.2% in 2015, 1.7% less than in Leeds Central
- References
- ↑ "Electorate Figures - Boundary Commission for England". 2011 Electorate Figures. Boundary Commission for England. 4 March 2011. Archived from the original on 6 November 2010. Retrieved 13 March 2011.
- ↑ "'Leeds Central', June 1983 up to May 1997". ElectionWeb Project. Cognitive Computing Limited. Archived from the original on 12 March 2016. Retrieved 11 March 2016.
- 1 2 "Local statistics - Office for National Statistics". neighbourhood.statistics.gov.uk.
- 1 2 "Politics". the Guardian.
- ↑ Parish: Key Statistics: Economic. (2011 census) Retrieved 2016-05-04.
- ↑ List of Labour MPs elected in 2015 by % majority UK Political.info. Retrieved 2017-01-29
- ↑ "Archived copy" (PDF). Archived from the original (PDF) on 18 July 2008. Retrieved 21 March 2010.
- ↑ BBC (2008-07-11). "Election Records". BBC News. Retrieved 2008-07-11.
- 1 2 Leigh Rayment's Historical List of MPs – Constituencies beginning with "L" (part 1)
- ↑ "Leeds Central" (PDF). Leeds City Council. Retrieved 11 May 2017.
- ↑ "Election Data 2015". Electoral Calculus. Archived from the original on 17 October 2015. Retrieved 17 October 2015.
- ↑ "Leeds Central". BBC News. Retrieved 13 May 2015.
- ↑ "Election Data 2010". Electoral Calculus. Archived from the original on 26 July 2013. Retrieved 17 October 2015.
- ↑ "UK > England > Yorkshire & the Humber > Leeds Central". Election 2010. BBC. 7 May 2010. Retrieved 12 May 2010.
- ↑ "Politics Resources". Election 1992. Politics Resources. 9 April 1992. Retrieved 2010-12-06.
- ↑ "UK General Election results: June 1983 [Archive]". www.politicsresources.net.
- ↑ "UK General Election results: October 1951 [Archive]". www.politicsresources.net.
- ↑ "UK General Election results: February 1950 [Archive]". www.politicsresources.net.
- ↑ "UK General Election results: July 1945 [Archive]". www.politicsresources.net.
- 1 2 3 4 British Parliamentary Election Results 1918-1949, FWS Craig
- ↑ Craig, F. W. S. (1983). British parliamentary election results 1918-1949 (3 ed.). Chichester: Parliamentary Research Services. ISBN 0-900178-06-X.
- 1 2 3 4 5 6 7 8 British parliamentary election results, 1885-1918 (Craig)
- ↑ "Election News". Dundee Courier. 7 June 1886. p. 3. Retrieved 3 December 2017 – via British Newspaper Archive. (Subscription required (help)).
- ↑ "General News". Edinburgh Evening News. 2 May 1885. p. 4. Retrieved 3 December 2017 – via British Newspaper Archive. (Subscription required (help)).