Sutton and Cheam (UK Parliament constituency)
| Sutton and Cheam | |
|---|---|
|
Borough constituency for the House of Commons | |
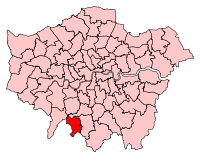 Boundary of Sutton and Cheam in Greater London. | |
| County | Greater London |
| Electorate | 66,147 (December 2010)[1] |
| Current constituency | |
| Created | 1945 |
| Member of parliament | Paul Scully (Conservative) |
| Created from |
Surrey North-Eastern or 'Wimbledon' Mid Surrey or 'Epsom' |
| Overlaps | |
| European Parliament constituency | London |
Sutton and Cheam is a constituency[n 1] represented in the House of Commons of the UK Parliament. Since 2015, the seat has been held by Paul Scully, a Conservative.[n 2]
History
Political history
The most notable event in the constituency's history was the huge 32.6% swing to the Liberal Party in the 1972 by-election.[2] Prior to this by-election, the constituency had only returned Conservative MPs, with the Liberal Party in third place behind Labour.
The seat is a marginal seat which has since 1970 frequently flipped between electing Conservative and Liberal/Liberal Democrat candidates. During the Conservative Government 1979-1990, the seat was won by a sufficient majority to be branded a Conservative safe seat. It was regained by the Liberal Democrats in the 1997 general election. The Conservatives regained the seat at the 2015 general election.
At the 2017 general election, the incumbent Conservative MP, Paul Scully, gained an 8.3% swing which moved the seat away from the typical "marginal" band of analysis: Scully won by a 24.4% majority. Due to the secret ballot only opinion polls can determine if this rise in popularity had more to do with the campaign of the Liberal Democrat candidate and/or the Conservatives picking up votes from the non-standing party UKIP, whose withdrawal was common in 2017 nationwide, following the vote to leave the EU. UKIP had 378 candidates across the UK, 346 fewer than in 2015.[3] Also not standing, and having lost their deposits in 2015, were two left-wing minor candidates. An 11.6% extra vote share was on hand for four parties as the candidate list fell from seven to four.
The seat had ranked from 2015 to 2017 the 39th-slimmest margin of majority, specifically in share of the vote as opposed to number of votes, among the 331 Conservative seats.[4] In third place, Labour's vote share almost doubled to 20.4%, their highest in Sutton and Cheam since 1970; a further swing of 3.4% of voters would have made Labour the closest challengers to the Conservatives, before the Liberal Democrats.
Prominent members
Richard Sharples, the constituency's Conservative MP from 1954, was a former major in the army, and served as a Home Office Minister, before resigning his seat in 1972 to become Governor of Bermuda.
Boundaries
1945–1950: The Municipal Boroughs of Sutton and Cheam.
1950–1974: as above (from 1965 becoming wards of the London Borough of Sutton but not described as such in boundary legislation itself for a time).
1974–1983: The London Borough of Sutton wards of Belmont, Cheam North, Cheam South, Cheam West, Sutton Central, Sutton East, Sutton North, Sutton North East, Sutton South, Sutton South East, Worcester Park North, and Worcester Park South.
1983–2010: As above plus Rosehill and Sutton West, less Sutton South East.
2010–present: The London Borough of Sutton wards of Belmont, Cheam, Nonsuch, Stonecot, Sutton Central, Sutton North, Sutton South, Sutton West, and Worcester Park.
Constituency profile
The area maintains separate schooling systems, with grammar schools and comprehensive schools, similar to Kingston upon Thames; it has more semi-detached, terraced and detached properties than the Greater London average.[5] Workless claimants, registered jobseekers, were in November 2012 significantly lower than the national average of 3.8%, at 2.1% of the population based on a statistical compilation by The Guardian.[6]
Members of Parliament
| Election | Member[7] | Party | Notes | |
|---|---|---|---|---|
| 1945 | Sir Sidney Marshall | Conservative | Resigned 1954 | |
| 1954 by-election | Richard Sharples | Conservative | Resigned 1972 | |
| 1972 by-election | Graham Tope | Liberal | ||
| Feb 1974 | Sir Neil Macfarlane | Conservative | ||
| 1992 | Lady Olga Maitland | Conservative | ||
| 1997 | Paul Burstow | Liberal Democrat | ||
| 2015 | Paul Scully | Conservative | ||
Elections

Elections in the 2010s
| Party | Candidate | Votes | % | ± | |
|---|---|---|---|---|---|
| Conservative | Paul Scully | 26,567 | 51.1 | +9.6 | |
| Liberal Democrat | Amna Ahmad | 13,869 | 26.7 | -7.0 | |
| Labour | Bonnie Craven | 10,663 | 20.5 | +9.4 | |
| Green | Claire Jackson-Prior | 871 | 1.7 | -0.4 | |
| Majority | 12,698 | 24.4 | +16.5 | ||
| Turnout | 51,970 | 73.8 | +1.7 | ||
| Registered electors | 70,404 | ||||
| Conservative hold | Swing | +8.3 | |||
| Party | Candidate | Votes | % | ± | |
|---|---|---|---|---|---|
| Conservative | Paul Scully | 20,732 | 41.5 | -0.8 | |
| Liberal Democrat | Paul Burstow | 16,811 | 33.7 | -12.0 | |
| Labour | Emily Brothers | 5,546 | 11.1 | +4.2 | |
| UKIP | Angus Dalgleish | 5,341 | 10.7 | +8.7 | |
| Green | Maeve Tomlinson | 1,051 | 2.1 | +1.6 | |
| National Health Action | Dave Ash | 345 | 0.7 | N/A | |
| TUSC | Pauline Gorman | 79 | 0.2 | N/A | |
| Majority | 3,921 | 7.9 | N/A | ||
| Turnout | 49,905 | 72.1 | -0.7 | ||
| Registered electors | 69,228 | ||||
| Conservative gain from Liberal Democrat | Swing | +5.6 | |||
| Party | Candidate | Votes | % | ± | |
|---|---|---|---|---|---|
| Liberal Democrat | Paul Burstow | 22,156 | 45.7 | −1.2 | |
| Conservative | Philippa Stroud | 20,548 | 42.4 | +1.7 | |
| Labour | Kathy Allen | 3,376 | 7.0 | −4.9 | |
| BNP | John Clarke | 1,014 | 2.1 | N/A | |
| UKIP | David Pickles | 950 | 2.0 | N/A | |
| Green | Peter Hickson | 246 | 0.5 | N/A | |
| English Democrat | John Dodds | 106 | 0.2 | N/A | |
| Christian Peoples | Matthew Connolly | 52 | 0.1 | N/A | |
| Libertarian | Martin Cullip | 41 | 0.1 | N/A | |
| Independents Federation UK | Brian Hammond | 19 | 0.0 | N/A | |
| Majority | 1,608 | 3.3 | −2.9 | ||
| Turnout | 48,508 | 72.8 | +5.5 | ||
| Registered electors | 66,658 | ||||
| Liberal Democrat hold | Swing | −1.5 | |||
Elections in the 2000s
| Party | Candidate | Votes | % | ± | |
|---|---|---|---|---|---|
| Liberal Democrat | Paul Burstow | 19,768 | 47.1 | -1.7 | |
| Conservative | Richard Willis | 16,922 | 40.4 | +2.4 | |
| Labour | Anand Shukla | 4,954 | 11.8 | -1.4 | |
| Rainbow Dream Ticket | Rainbow George Weiss | 288 | 0.7 | +0.7 | |
| Majority | 2,846 | 6.8 | -4.0 | ||
| Turnout | 41,932 | 66.2 | +3.8 | ||
| Registered electors | 62,885 | ||||
| Liberal Democrat hold | Swing | -2.0 | |||
| Party | Candidate | Votes | % | ± | |
|---|---|---|---|---|---|
| Liberal Democrat | Paul Burstow | 19,382 | 48.8 | +6.5 | |
| Conservative | Olga Maitland | 15,078 | 38.0 | +0.1 | |
| Labour | Lisa Homan | 5,263 | 13.2 | -2.2 | |
| Majority | 4,304 | 10.8 | +6.35 | ||
| Turnout | 39,723 | 62.4 | -12.5 | ||
| Registered electors | 63,648 | ||||
| Liberal Democrat hold | Swing | +3.2 | |||
Elections in the 1990s
| Party | Candidate | Votes | % | ± | |
|---|---|---|---|---|---|
| Liberal Democrat | Paul Burstow | 19,919 | 42.30 | +8.54 | |
| Conservative | Olga Maitland | 17,822 | 37.85 | -17.33 | |
| Labour | Mark Allison | 7,280 | 15.5 | +5.58 | |
| Referendum | Peter Atkinson | 1,784 | 3.8 | N/A | |
| UKIP | Simon Mckie | 191 | 0.4 | N/A | |
| Natural Law | Deborah Wright | 96 | 0.20 | -0.26 | |
| Majority | 2,097 | 4.45 | N/A | ||
| Turnout | 47,092 | 74.90 | -7.50 | ||
| Registered electors | 62,824 | ||||
| Liberal Democrat gain from Conservative | Swing | -12.90 | |||
| Party | Candidate | Votes | % | ± | |
|---|---|---|---|---|---|
| Conservative | Olga Maitland | 27,710 | 55.18 | -5.57 | |
| Liberal Democrat | Paul Burstow | 16,954 | 33.76 | N/A | |
| Labour | G. C. Martin | 4,980 | 9.92 | -0.72 | |
| Green | J. Duffy | 444 | 0.88 | N/A | |
| Natural Law | A. Hatchard | 133 | 0.26 | N/A | |
| Majority | 10,756 | 21.42 | -10.72 | ||
| Turnout | 50,221 | 82.40 | +5.80 | ||
| Registered electors | 60,949 | ||||
| Conservative hold | Swing | ||||
Elections in the 1980s
| Party | Candidate | Votes | % | ± | |
|---|---|---|---|---|---|
| Conservative | Neil Macfarlane | 29,710 | 60.75 | +3.65 | |
| Liberal | Robert Greig | 13,992 | 28.61 | -6.59 | |
| Labour | Loraine Monk | 5,202 | 10.64 | +3.04 | |
| Majority | 15,718 | 32.14 | +10.24 | ||
| Turnout | 48,904 | 76.60 | +2.30 | ||
| Registered electors | 63,850 | ||||
| Conservative hold | Swing | ||||
| Party | Candidate | Votes | % | ± | |
|---|---|---|---|---|---|
| Conservative | Neil Macfarlane | 26,782 | 57.1 | -0.9 | |
| Liberal | C. Caswill | 16,518 | 35.2 | +8.8 | |
| Labour | G.S. Dixon | 3,568 | 7.6 | -6.7 | |
| Majority | 10,264 | 21.9 | -9.7 | ||
| Turnout | 46,868 | 74.3 | -4.5 | ||
| Registered electors | 63,099 | ||||
| Conservative hold | Swing | ||||
Elections in the 1970s
| Party | Candidate | Votes | % | ± | |
|---|---|---|---|---|---|
| Conservative | Neil Macfarlane | 28,842 | 58.0 | +10.4 | |
| Liberal | Christopher Caswill | 13,136 | 26.4 | -10.1 | |
| Labour | N. Irwin | 7,126 | 14.3 | -1.0 | |
| National Front | J. Hunt | 465 | 0.9 | N/A | |
| Independent | J. Smoker | 128 | 0.2 | N/A | |
| Majority | 15,706 | 31.6 | +20.5 | ||
| Turnout | 49,277 | 78.8 | +1.9 | ||
| Registered electors | 63,038 | ||||
| Conservative hold | Swing | ||||
| Party | Candidate | Votes | % | ± | |
|---|---|---|---|---|---|
| Conservative | Neil Macfarlane | 22,156 | 47.6 | +2.2 | |
| Liberal | Graham Tope | 16,995 | 36.5 | -5.5 | |
| Labour | James Kenneth Rhodes | 7,118 | 15.3 | +2.7 | |
| Women's Rights | Una Kroll | 298 | 0.6 | N/A | |
| Majority | 5,161 | 11.1 | +7.6 | ||
| Turnout | 46,567 | 76.9 | -5.7 | ||
| Registered electors | 60,559 | ||||
| Conservative hold | Swing | ||||
| Party | Candidate | Votes | % | ± | |
|---|---|---|---|---|---|
| Conservative | Neil Macfarlane | 22,555 | 45.4 | -12.7 | |
| Liberal | Graham Tope | 20,836 | 42.0 | +27.4 | |
| Labour | James Kenneth Rhodes | 6,270 | 12.6 | -14.7 | |
| Majority | 1,719 | 3.5 | N/A | ||
| Turnout | 49,661 | 82.6 | +15.0 | ||
| Registered electors | 60,109 | ||||
| Conservative gain from Liberal | Swing | ||||
| Party | Candidate | Votes | % | ± | |
|---|---|---|---|---|---|
| Liberal | Graham Tope | 18,328 | 53.6 | +39.0 | |
| Conservative | Neil Macfarlane | 10,911 | 31.9 | -26.2 | |
| Labour | David Miller | 2,937 | 8.6 | -18.7 | |
| Anti-Common Market | Chris Frere-Smith | 1,332 | 3.9 | N/A | |
| National Independence | Edgar Scruby | 660 | 1.9 | N/A | |
| Majority | 7,417 | 21.7 | N/A | ||
| Turnout | 34,194 | 56.3 | -11.3 | ||
| Registered electors | |||||
| Liberal gain from Conservative | Swing | +32.6 | |||
| Party | Candidate | Votes | % | ± | |
|---|---|---|---|---|---|
| Conservative | Richard Sharples | 23,957 | 58.1 | +7.00 | |
| Labour | John Dowsett | 11,261 | 27.3 | -2.99 | |
| Liberal | Nicholas DM McGeorge | 6,023 | 14.6 | -4.01 | |
| Majority | 12,696 | 30.8 | +9.99 | ||
| Turnout | 41,241 | 67.6 | -8.76 | ||
| Registered electors | 61,050 | ||||
| Conservative hold | Swing | ||||
Elections in the 1960s
| Party | Candidate | Votes | % | ± | |
|---|---|---|---|---|---|
| Conservative | Richard Sharples | 22,331 | 51.10 | -1.55 | |
| Labour | Frank J Ward | 13,235 | 30.29 | +3.16 | |
| Liberal | Nicholas DM McGeorge | 8,134 | 18.61 | -1.62 | |
| Majority | 9,096 | 20.81 | -4.71 | ||
| Turnout | 43,700 | 76.36 | +2.09 | ||
| Registered electors | 57,227 | ||||
| Conservative hold | Swing | ||||
| Party | Candidate | Votes | % | ± | |
|---|---|---|---|---|---|
| Conservative | Richard Sharples | 22,975 | 52.65 | -5.67 | |
| Labour | Paul Derrick | 11,839 | 27.13 | +1.65 | |
| Liberal | John Montgomerie | 8,827 | 20.23 | +4.02 | |
| Majority | 11,136 | 25.52 | -7.32 | ||
| Turnout | 43,641 | 74.27 | -5.34 | ||
| Registered electors | 58,898 | ||||
| Conservative hold | Swing | ||||
Elections in the 1950s
| Party | Candidate | Votes | % | ± | |
|---|---|---|---|---|---|
| Conservative | Richard Sharples | 27,344 | 58.32 | -7.70 | |
| Labour | Frank Judd | 11,946 | 25.48 | -8.50 | |
| Liberal | John Montgomerie | 7,600 | 16.21 | N/A | |
| Majority | 15,398 | 32.84 | +0.81 | ||
| Turnout | 46,890 | 79.61 | +3.16 | ||
| Registered electors | 58,763 | ||||
| Conservative hold | Swing | ||||
| Party | Candidate | Votes | % | ± | |
|---|---|---|---|---|---|
| Conservative | Richard Sharples | 29,538 | 66.02 | +3.25 | |
| Labour | Ronald M Lewis | 15,205 | 33.98 | -3.25 | |
| Majority | 14,333 | 32.03 | +6.50 | ||
| Turnout | 44,743 | 76.45 | -5.23 | ||
| Registered electors | 58,529 | ||||
| Conservative hold | Swing | ||||
| Party | Candidate | Votes | % | ± | |
|---|---|---|---|---|---|
| Conservative | Richard Sharples | 21,930 | 66.55 | +3.78 | |
| Labour | N. T. Poulter | 11,023 | 33.45 | -3.78 | |
| Majority | 10,907 | 33.10 | +7.57 | ||
| Turnout | 32,953 | 55.60 | -26.08 | ||
| Registered electors | 59,292 | ||||
| Conservative hold | Swing | ||||
| Party | Candidate | Votes | % | ± | |
|---|---|---|---|---|---|
| Conservative | Sidney Marshall | 30,684 | 62.77 | +5.84 | |
| Labour | Eric KI Hurst | 18,202 | 37.23 | +2.71 | |
| Majority | 12,482 | 25.53 | +3.12 | ||
| Turnout | 58,886 | 81.68 | -5.05 | ||
| Registered electors | 59,848 | ||||
| Conservative hold | Swing | ||||
| Party | Candidate | Votes | % | ± | |
|---|---|---|---|---|---|
| Conservative | Sidney Marshall | 29,200 | 56.93 | +10.89 | |
| Labour | Helen O. Judd | 17,706 | 34.52 | -6.45 | |
| Liberal | H. J. Wheeler | 4,389 | 8.56 | -4.45 | |
| Majority | 11,494 | 22.41 | +17.34 | ||
| Turnout | 51,295 | 86.73 | +11.01 | ||
| Registered electors | 59,141 | ||||
| Conservative hold | Swing | ||||
Elections in the 1940s
| Party | Candidate | Votes | % | ± | |
|---|---|---|---|---|---|
| Conservative | Sidney Marshall | 19,431 | 46.04 | N/A | |
| Labour | Helen O. Judd | 17,293 | 40.97 | N/A | |
| Liberal | J. P. Hughes | 5,483 | 12.99 | N/A | |
| Majority | 2,138 | 5.07 | N/A | ||
| Turnout | 42,207 | 75.72 | N/A | ||
| Registered electors | 55,742 | ||||
| Conservative win (new seat) | |||||
See also
Notes and references
- Notes
- ↑ A borough constituency (for the purposes of election expenses and type of returning officer)
- ↑ As with all constituencies, the constituency elects one Member of Parliament (MP) by the first past the post system of election at least every five years.
- References
- ↑ "Electorate Figures – Boundary Commission for England". 2011 Electorate Figures. Boundary Commission for England. 4 March 2011. Archived from the original on 6 November 2010. Retrieved 13 March 2011.
- ↑ "BBC NEWS – UK – UK Politics – Memorable by-election results". bbc.co.uk.
- ↑ https://commonslibrary.parliament.uk/insights/who-stood-in-the-general-election-2017
- ↑ List of Conservative MPs elected in 2015 by % majority UK Political.info. Retrieved 2017-01-29
- ↑ "2011 Census Interactive – ONS". ons.gov.uk. Archived from the original on 29 January 2016.
- ↑ Unemployment claimants by constituency The Guardian
- ↑ Leigh Rayment's Historical List of MPs – Constituencies beginning with "S" (part 6)
- ↑ "Sutton & Cheam parliamentary constituency". BBC News.
- ↑ http://researchbriefings.files.parliament.uk/documents/CBP-7979/CBP-7979.pdf
- ↑ "Election Data 2015". Electoral Calculus. Archived from the original on 17 October 2015. Retrieved 17 October 2015.
- ↑ https://www.sutton.gov.uk/news/article/202/election_results
- ↑ "Election Data 2010". Electoral Calculus. Archived from the original on 26 July 2013. Retrieved 17 October 2015.
- ↑ "Archived copy". Archived from the original on 8 June 2011. Retrieved 2 May 2010.
- ↑ "Election Data 2005". Electoral Calculus. Archived from the original on 15 October 2011. Retrieved 18 October 2015.
- ↑ "Election Data 2001". Electoral Calculus. Archived from the original on 15 October 2011. Retrieved 18 October 2015.
- ↑ "Election Data 1997". Electoral Calculus. Archived from the original on 15 October 2011. Retrieved 18 October 2015.
- ↑ "Election Data 1992". Electoral Calculus. Archived from the original on 15 October 2011. Retrieved 18 October 2015.
- ↑ "Election Data 1987". Electoral Calculus. Archived from the original on 15 October 2011. Retrieved 18 October 2015.
- ↑ "Election Data 1983". Electoral Calculus. Archived from the original on 15 October 2011. Retrieved 18 October 2015.
- ↑ The Times' Guide to the House of Commons. 1970.
- ↑ The Times' Guide to the House of Commons. 1966.
- ↑ The Times' Guide to the House of Commons. 1964.
- ↑ The Times' Guide to the House of Commons. 1959.
- ↑ The Times' Guide to the House of Commons. 1955.
- ↑ The Times' Guide to the House of Commons. 1951.
External links
- Politics Resources (Election results from 1922 onwards)
- Electoral Calculus (Election results from 1955 onwards)