Braintree (UK Parliament constituency)
| Braintree | |
|---|---|
|
County constituency for the House of Commons | |
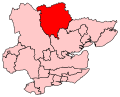 Boundary of Braintree in Essex. | |
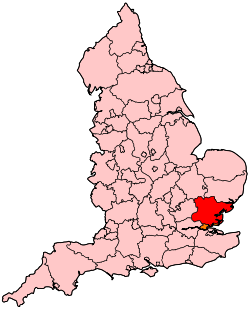 Location of Essex within England. | |
| County | Essex |
| Population | 97,840 (2011 census)[1] |
| Electorate | 72,064 (December 2010)[2] |
| Current constituency | |
| Created | 1974 |
| Member of parliament | James Cleverly (Conservative) |
| Number of members | One |
| Created from | Maldon |
| Overlaps | |
| European Parliament constituency | East of England |
Braintree is a constituency[n 1] represented in the House of Commons of the UK Parliament since 2015 by James Cleverly, Deputy Chairman of the Conservative Party.[n 2]
Boundaries
1974—1983: The Urban Districts of Braintree and Bocking, and Witham, the Rural District of Braintree, and the civil parishes of Boreham, Broomfield, Chignall, Good Easter, Great and Little Leighs, Great Waltham, Little Waltham, Mashbury, Pleshey, Roxwell, Springfield, and Writtle in the Rural District of Chelmsford.
1983—1997: The District of Braintree wards of Black Notley, Bocking North, Bocking South, Braintree Central, Braintree East, Braintree West, Coggeshall, Cressing, Hatfield Peverel, Kelvedon, Panfield, Rayne, Terling, Three Fields, Witham Central, Witham Chipping Hill, Witham North, Witham Silver End and Rivenhall, Witham South, and Witham West, and the Borough of Chelmsford wards of Broomfield and Chignall, Good Easter Mashbury and Roxwell, Great and Little Leighs and Little Waltham, Great Waltham and Pleshey, and Writtle.
1997—2010: The District of Braintree wards of Black Notley, Bocking North, Bocking South, Braintree Central, Braintree East, Braintree West, Coggeshall, Cressing, Earls Colne, Gosfield, Hatfield Peveril, Kelvedon, Panfield, Rayne, Terling, Three Fields, Witham Central, Witham Chipping Hill, Witham North, Witham Silver End and Rivenhall, Witham South, and Witham West.
2010—present: The District of Braintree wards of Bocking Blackwater, Bocking North, Bocking South, Braintree Central, Braintree East, Braintree South, Bumpstead, Cressing and Stisted, Gosfield and Greenstead Green, Great Notley and Braintree West, Halstead St Andrews, Halstead Trinity, Hedingham and Maplestead, Panfield, Rayne, Stour Valley North, Stour Valley South, The Three Colnes, Three Fields, Upper Colne, and Yeldham.
The 2010 redistribution allowed a new Witham seat to be created and caused extension of this constituency out towards the Stour Valley, the border with Suffolk, and took in Bumpstead which shares a civil parish boundary with south-east Cambridgeshire.
History
The former Leader of the House Tony Newton held the seat for the Conservatives from its creation in 1974 until 1997 when Alan Hurst defeated Newton to gain the seat for Labour. Brooks Newmark defeated Hurst in 2005 to regain the seat for the Conservatives, and held it until he stood down and was succeeded by James Cleverly, also a Conservative.
Members of Parliament
| Election | Member[3][4] | Party | Notes | |
|---|---|---|---|---|
| Feb 1974 | Tony Newton | Conservative | Leader of the House of Commons 1992—97. Defeated at 1997 general election | |
| 1997 | Alan Hurst | Labour | Defeated at the 2005 general election | |
| 2005 | Brooks Newmark | Conservative | Retired at the 2015 general election | |
| 2015 | James Cleverly | Conservative | Deputy Chairman of the Conservative Party (2018-present) | |
Elections
Elections in the 2010s
| Party | Candidate | Votes | % | ± | |
|---|---|---|---|---|---|
| Conservative | James Cleverly | 32,873 | 62.8 | ||
| Labour | Malcolm Fincken | 14,451 | 27.6 | ||
| Liberal Democrat | Peter Turner | 2,251 | 4.3 | ||
| UKIP | Richard Bingley | 1,835 | 3.5 | ||
| Green | Thomas Pashby | 916 | 1.8 | ||
| Majority | 18,422 | 35.2 | |||
| Turnout | 52,326 | 69.5 | |||
| Conservative hold | Swing | ||||
| Party | Candidate | Votes | % | ± | |
|---|---|---|---|---|---|
| Conservative | James Cleverly | 27,071 | 53.8 | ||
| UKIP | Richard Bingley | 9,461 | 18.8 | ||
| Labour | Malcolm Fincken | 9,296 | 18.5 | ||
| Liberal Democrat | Matthew Klesel | 2,488 | 4.9 | ||
| Green | Paul Jeater | 1,564 | 3.1 | ||
| Independent | Toby Pereira | 295 | 0.6 | N/A | |
| BNP | Paul Hooks | 108 | 0.2 | ||
| Majority | 17,610 | 35.0 | |||
| Turnout | 50,283 | 68.4 | |||
| Conservative hold | Swing | ||||
| Party | Candidate | Votes | % | ± | |
|---|---|---|---|---|---|
| Conservative | Brooks Newmark | 25,901 | 52.6 | ||
| Labour | Bill Edwards | 9,780 | 19.9 | ||
| Liberal Democrat | Steve Jarvis | 9,247 | 18.8 | ||
| UKIP | Michael Ford | 2,477 | 5.0 | ||
| BNP | Paul Hooks | 1,080 | 2.2 | N/A | |
| Green | Daisy Blench | 718 | 1.5 | ||
| Majority | 16,121 | 32.8 | |||
| Turnout | 49,203 | 69.1 | |||
| Conservative hold | Swing | ||||
Elections in the 2000s
| Party | Candidate | Votes | % | ± | |
|---|---|---|---|---|---|
| Conservative | Brooks Newmark | 23,597 | 44.5 | ||
| Labour | Alan Hurst | 19,704 | 37.1 | ||
| Liberal Democrat | Peter Turner | 7,037 | 13.3 | ||
| Green | James Abbott | 1,308 | 2.5 | ||
| UKIP | Roger Lord | 1,181 | 2.2 | ||
| Independent | Michael Nolan | 228 | 0.4 | ||
| Majority | 3,893 | 7.3 | |||
| Turnout | 53,055 | 65.9 | |||
| Conservative gain from Labour | Swing | ||||
| Party | Candidate | Votes | % | ± | |
|---|---|---|---|---|---|
| Labour | Alan Hurst | 21,123 | 42.0 | ||
| Conservative | Brooks Newmark | 20,765 | 41.3 | ||
| Liberal Democrat | Peter Turner | 5,664 | 11.3 | ||
| Green | James Abbott | 1,241 | 2.5 | ||
| Legalise Cannabis | Michael Nolan | 774 | 1.5 | N/A | |
| UKIP | Charles Cole | 748 | 1.5 | N/A | |
| Majority | 358 | 0.7 | |||
| Turnout | 50,315 | 63.6 | |||
| Labour hold | Swing | ||||
Elections in the 1990s
| Party | Candidate | Votes | % | ± | |
|---|---|---|---|---|---|
| Labour | Alan Hurst | 23,729 | 42.7 | ||
| Conservative | Tony Newton | 22,278 | 40.1 | ||
| Liberal Democrat | Trevor K. Ellis | 6,418 | 11.6 | ||
| Referendum | Nicholas P. Westcott | 2,165 | 3.9 | N/A | |
| Green | James Abbott | 712 | 1.3 | ||
| Independent | Michael Nolan | 274 | 0.5 | N/A | |
| Majority | 1,451 | 2.6 | |||
| Turnout | 55,576 | 76.1 | |||
| Labour gain from Conservative | Swing | ||||
| Party | Candidate | Votes | % | ± | |
|---|---|---|---|---|---|
| Conservative | Tony Newton | 34,415 | 52.3 | ||
| Labour | Ian Willmore | 16,921 | 25.7 | ||
| Liberal Democrat | Diana P. Wallis | 13,603 | 20.7 | ||
| Green | James Abbott | 855 | 1.3 | N/A | |
| Majority | 17,494 | 26.6 | |||
| Turnout | 65,794 | 83.4 | |||
| Conservative hold | Swing | ||||
Elections in the 1980s
| Party | Candidate | Votes | % | ± | |
|---|---|---|---|---|---|
| Conservative | Tony Newton | 32,978 | 54.2 | ||
| Social Democratic | Inigo Bing | 16,121 | 26.5 | ||
| Labour | Brian Stapleton | 11,764 | 19.3 | ||
| Majority | 16,857 | 27.7 | |||
| Turnout | 60,863 | 79.1 | |||
| Conservative hold | Swing | ||||
| Party | Candidate | Votes | % | ± | |
|---|---|---|---|---|---|
| Conservative | Tony Newton | 29,462 | 52.6 | ||
| Social Democratic | Inigo Bing | 16,021 | 28.6 | N/A | |
| Labour | J.M. Dyson | 10,551 | 18.8 | ||
| Majority | 13,441 | 24.0 | |||
| Turnout | 56,034 | 76.2 | |||
| Conservative hold | Swing | ||||
Elections in the 1970s
| Party | Candidate | Votes | % | ± | |
|---|---|---|---|---|---|
| Conservative | Tony Newton | 31,593 | 52.0 | ||
| Labour | J.E.B. Gyford | 19,075 | 31.4 | ||
| Liberal | J. Bryan | 10,115 | 16.6 | ||
| Majority | 12,518 | 20.6 | |||
| Turnout | 60,783 | 80.9 | |||
| Conservative hold | Swing | ||||
| Party | Candidate | Votes | % | ± | |
|---|---|---|---|---|---|
| Conservative | Tony Newton | 20,559 | 39.5 | ||
| Labour | Keith Kyle | 19,469 | 37.4 | ||
| Liberal | R. Holme | 12,004 | 23.1 | ||
| Majority | 1,090 | 2.1 | |||
| Turnout | 52,032 | 79.4 | |||
| Conservative hold | Swing | ||||
| Party | Candidate | Votes | % | ± | |
|---|---|---|---|---|---|
| Conservative | Tony Newton | 20,797 | 38.0 | N/A | |
| Labour | Keith Kyle | 18,796 | 34.3 | N/A | |
| Liberal | D. Scott | 15,204 | 27.8 | N/A | |
| Majority | 2,001 | 3.7 | N/A | ||
| Turnout | 54,797 | 84.3 | N/A | ||
| Conservative win (new seat) | |||||
See also
Notes and references
- Notes
- ↑ A county constituency (for the purposes of election expenses and type of returning officer)
- ↑ As with all constituencies, the constituency elects one Member of Parliament (MP) by the first past the post system of election at least every five years.
- References
- ↑ "Braintree: Usual Resident Population, 2011". Neighbourhood Statistics. Office for National Statistics. Retrieved 2 February 2015.
- ↑ "Electorate Figures - Boundary Commission for England". 2011 Electorate Figures. Boundary Commission for England. 4 March 2011. Archived from the original on 6 November 2010. Retrieved 13 March 2011.
- ↑ "Braintree 1974-". Hansard 1803-2005. UK Parliament. Retrieved 2 February 2015.
- ↑ Leigh Rayment's Historical List of MPs – Constituencies beginning with "B" (part 5)
- ↑ "Statement of Persons Nominated". Braintree District Council. Retrieved 14 May 2017.
- ↑ "Election Data 2015". Electoral Calculus. Archived from the original on 17 October 2015. Retrieved 17 October 2015.
- ↑ "Election Data 2010". Electoral Calculus. Archived from the original on 26 July 2013. Retrieved 17 October 2015.
- ↑ "BBC NEWS – Election 2010 – Braintree". BBC News.
- ↑ "Election Data 2005". Electoral Calculus. Archived from the original on 15 October 2011. Retrieved 18 October 2015.
- ↑ "Election Data 2001". Electoral Calculus. Archived from the original on 15 October 2011. Retrieved 18 October 2015.
- 1 2 Political Science Resources - Braintree 1997 & 2001
- ↑ "Election Data 1997". Electoral Calculus. Archived from the original on 15 October 2011. Retrieved 18 October 2015.
- ↑ "Election Data 1992". Electoral Calculus. Archived from the original on 15 October 2011. Retrieved 18 October 2015.
- ↑ "Politics Resources". Election 1992. Politics Resources. 9 April 1992. Retrieved 2010-12-06.
- ↑ "Election Data 1987". Electoral Calculus. Archived from the original on 15 October 2011. Retrieved 18 October 2015.
- ↑ "Election Data 1983". Electoral Calculus. Archived from the original on 15 October 2011. Retrieved 18 October 2015.
External links
- nomis Constituency Profile for Braintree — presenting data from the ONS annual population survey and other official statistics.