Wakefield (UK Parliament constituency)
Coordinates: 53°40′59″N 1°29′56″W / 53.683°N 1.499°W
| Wakefield | |
|---|---|
|
County constituency for the House of Commons | |
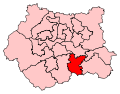 Boundary of Wakefield in West Yorkshire. | |
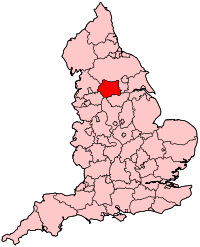 Location of West Yorkshire within England. | |
| County | West Yorkshire |
| Electorate | 71,531 (December 2010)[1] |
| Current constituency | |
| Created | 1997 |
| Member of parliament | Mary Creagh (Labour) |
| Number of members | One |
| 1832–1997 | |
| Number of members | One |
| Type of constituency | Borough constituency |
| Created from | Yorkshire |
| Overlaps | |
| European Parliament constituency | Yorkshire and the Humber |
Wakefield is a constituency[n 1] created in 1832 represented in the House of Commons of the UK Parliament since 2005 by Mary Creagh, a member of the Labour Party.[n 2]
Boundaries
1918-1950: The County Borough of Wakefield.
1950-1983: The County Borough of Wakefield, the Urban District of Horbury, and part of the Rural District of Wakefield.
1983-1997: The City of Wakefield wards of Horbury, Wakefield Central, Wakefield East, Wakefield North, Wakefield Rural, and Wakefield South.
1997-2010: The City of Wakefield wards of Wakefield Central, Wakefield East, Wakefield North, and Wakefield Rural, and the Borough of Kirklees wards of Denby Dale and Kirkburton.
2010-present: The City of Wakefield wards of Horbury and South Ossett, Ossett, Wakefield East, Wakefield North, Wakefield Rural, and Wakefield West.
Latest boundary changes
Parliament accepted the Boundary Commission's Fifth Periodic Review of Westminster constituencies which altered this constituency for the 2010 general election, removing all three wards from Kirklees that reached far to the south-west[n 3] and instead adding wards from the abolished Normanton constituency to the immediate west, since which time the seat has comprised three-quarters of the West Yorkshire city of Wakefield along with Ossett, Horbury and small outlying settlements.
The far eastern suburbs of the city and its southern part falls within the Wakefield South ward and this is in the Hemsworth seat, the largest towns of which are, by a small margin, the towns of South Elmsall and South Kirkby, which form a contiguous settlement 7 miles (11 km) to the east.[2][3]
History
- Predecessor seats
Electors of the area, since five years before the Model Parliament of 1295 until 1826 had entitlement to vote for the two representatives for Yorkshire, the largest county in the country. Parliament legislated for, from an unusual disfranchisement in 1826 of a Cornish rotten borough, two additional MPs.[n 4] From April 1784 until September 1812, one of the two members elected was William Wilberforce, internationally recognised as a leading figure in abolitionism (the anti-slavery movement). The large county was given far greater representation by the Reform Act 1832: Belle Vue's electors until 1885, alongside other Forty Shilling Freeholders non-resident in the Parliamentary Borough of Wakefield itself but owning such property in any part of the county division could elect the two members for that division: this became the West Riding of Yorkshire from 1832 until 1865 (which had its polling place in this city), after which, the relevant county subdivision became the Southern West Riding until 1885.
- Creation
Wakefield became a county division under the Redistribution of Seats Act 1885, drawing in, as an extension, the Belle Vue area of the parish of Sandal Magna.[4]
- Summary of results
Wakefield has returned Labour MPs since 1932. The size of majority has fluctuated between absolute and marginal.[n 5] The 2015 result gave the seat the 27th-smallest majority of Labour's 232 seats by percentage of majority.[5]
- Opposition parties
In general elections since 1923 the runner-up candidate has been a Conservative. Six non-Labour candidates stood in 2015 of whom two, those which were Conservative and from UKIP won more than 5% of the vote, keeping their deposits.
- Prominent frontbenchers
Rt Hon Arthur Greenwood was succeeded by Clement Attlee as leader of the Opposition in 1945, a few months before the party's landslide election victory. He had been from 1929–1931 the Minister of State (present equivalent: Secretary of State) for Health under the Second MacDonald ministry. In this role he successfully steered the Housing Act 1930 through both Houses of Parliament under the minority government, which expended more significant subsidies for slum clearance, allowing more affordable, spacious housing to be built for residents of slums. When the wartime coalition government was formed, Winston Churchill appointed him to the British War Cabinet as Minister without Portfolio in 1940. He was generally seen in such a role as of little wartime legislative effect, but in May 1940 he emerged as Churchill's strongest and most vocal supporter in the lengthy War Cabinet debates on whether to accept or reject a peace offer from Germany.[6] Without the vote in favour of fighting on by Greenwood and Clement Attlee, Churchill would not have had the slim majority he needed to do so.[7]
Rt Hon Arthur Creech Jones was Secretary of State for the Colonies from October 1946 until February 1950, appropriately given that in June 1936 he pressed the Government, who were encouraging Colonies to set up memorials to King George V, to follow the example of Uganda and set up a technical educational institution.[8] The Labour Party nominated him to the Colonial Office's Educational Advisory Committee in 1936, on which he served for nine years. In 1937, he was a founding member of the Trades Union Congress Colonial Affairs Committee, and in 1940 he founded the Fabian Colonial Bureau.
Mary Creagh, since October 2010 has been the Shadow Secretary of State for Environment, Food and Rural Affairs, succeeding Rt Hon Hilary Benn.
- Turnout
Turnout in general elections since 1918 has ranged between 54.5% in 2001 and 87.3% in 1950.
Constituency profile
The constituency has a rolling landscape with villages surrounding the city of Wakefield which is well connected to West Yorkshire in particular Leeds, Bradford and Huddersfield, however also via two junctions of the M1 to the west, to South Yorkshire such as Barnsley, Rotherham and Sheffield. The small city itself has a large central trading and industrial estate, a central park, Clarence Park which includes a national athletics training squad, a Rugby League major team, the Wildcats and its own Cathedral. Wakefield Europort employs approximately 3,000 people, a major rail-motorway hub for Northern England imports and exports with other EU countries. Horbury and Ossett and towns in the low foothills of the Pennines. In the far west of the constituency, there is the National Coal Mining Museum for England, on the site of the old Caphouse Colliery.
Workless claimants, registered jobseekers, were in November 2012 slightly higher than the regional average of 4.9%, at 5.3% of the population based on a statistical compilation by The Guardian, which is also higher than the national average of 3.8%.[9]
Of the council wards, the Wakefield East and Wakefield North areas regularly return Labour councillors, whereas the others are marginal. The Ossett ward is particularly unpredictable, and has elected Conservative, Labour, Liberal Democrat and UKIP councillors since 2005. The other wards are contested between Labour and Conservative.
Members of Parliament
Elections
Elections in the 2010s
| Party | Candidate | Votes | % | ± | |
|---|---|---|---|---|---|
| Labour | Mary Creagh | 22,987 | 49.7 | +9.4 | |
| Conservative | Antony Calvert | 20,811 | 45.0 | +10.8 | |
| Yorkshire Party | Lucy Brown | 1,176 | 2.5 | N/A | |
| Liberal Democrat | Finbarr Cronin | 943 | 2.0 | -1.4 | |
| Independent | Wajid Ali | 367 | 0.8 | N/A | |
| Majority | 2,176 | 4.7 | -1.4 | ||
| Turnout | 46,284 | 65.8 | +4.9 | ||
| Labour hold | Swing | -0.7 | |||
| Party | Candidate | Votes | % | ± | |
|---|---|---|---|---|---|
| Labour | Mary Creagh | 17,301 | 40.3 | +1.0 | |
| Conservative | Antony Calvert | 14,688 | 34.2 | −1.5 | |
| UKIP | Alan Hazelhurst | 7,862 | 18.3 | +18.3 | |
| Liberal Democrat | Finbarr Cronin | 1,483 | 3.5 | −12.9 | |
| Green | Rebecca Thackray | 1,069 | 2.5 | +0.5 | |
| TUSC | Mick Griffiths | 287 | 0.7 | N/A | |
| CISTA | Elliot Barr | 283 | 0.7 | N/A | |
| Majority | 2,613 | 6.1 | |||
| Turnout | 42,973 | 60.9 | |||
| Labour hold | Swing | +1.3 | |||
| Party | Candidate | Votes | % | ± | |
|---|---|---|---|---|---|
| Labour | Mary Creagh | 17,454 | 39.3 | −4.8 | |
| Conservative | Alex Story | 15,841 | 35.6 | +9.1 | |
| Liberal Democrat | David Smith | 7,256 | 16.3 | −2.5 | |
| BNP | Ian Senior | 2,581 | 5.8 | +2.7 | |
| Green | Miriam Hawkins | 873 | 2.0 | -1.0 | |
| Independent | Mark Harrop | 439 | 1.0 | +1.0 | |
| Majority | 1,613 | 3.7 | −8.6 | ||
| Turnout | 44,444 | 62.7 | +1.3 | ||
| Labour hold | Swing | −6.9 | |||
Elections in the 2000s
| Party | Candidate | Votes | % | ± | |
|---|---|---|---|---|---|
| Labour | Mary Creagh | 18,802 | 43.3 | −6.6 | |
| Conservative | Alec Shelbrooke | 13,648 | 31.5 | +0.9 | |
| Liberal Democrat | David Ridgway | 7,063 | 16.3 | +3.9 | |
| BNP | Grant Rowe | 1,328 | 3.1 | N/A | |
| Green | Derek Hardcastle | 1,297 | 3.0 | +0.4 | |
| UKIP | John Upex | 467 | 1.1 | −0.5 | |
| English Democrat | Adrian McEnhill | 356 | 0.8 | N/A | |
| Socialist Alternative | Mick Griffiths | 319 | 0.7 | N/A | |
| Socialist Labour | Linda Sheridan | 101 | 0.2 | −1.3 | |
| Majority | 5,154 | 11.9 | −7.6 | ||
| Turnout | 43,381 | 59.3 | +4.8 | ||
| Labour hold | Swing | −3.7 | |||
| Party | Candidate | Votes | % | ± | |
|---|---|---|---|---|---|
| Labour | David Hinchliffe | 20,592 | 49.9 | −7.5 | |
| Conservative | Thelma Karran | 12,638 | 30.6 | +2.2 | |
| Liberal Democrat | Dale Douglas | 5,097 | 12.4 | +1.2 | |
| Green | Sarah Greenwood | 1,075 | 2.6 | N/A | |
| UKIP | Janice Cannon | 677 | 1.6 | N/A | |
| Socialist Labour | Abdul Aziz | 634 | 1.5 | N/A | |
| Socialist Alliance | Mick Griffiths | 541 | 1.3 | N/A | |
| Majority | 7,954 | 19.3 | −9.6 | ||
| Turnout | 41,254 | 54.5 | −14.5 | ||
| Labour hold | Swing | ||||
Elections in the 1990s
| Party | Candidate | Votes | % | ± | |
|---|---|---|---|---|---|
| Labour | David Hinchliffe | 28,977 | 57.4 | +6.8 | |
| Conservative | Jonathan Peacock | 14,373 | 28.5 | −9.8 | |
| Liberal Democrat | Douglas Dale | 5,656 | 11.2 | +0.1 | |
| Referendum | Simon Shires | 1,480 | 2.9 | N/A | |
| Majority | 14,604 | 28.9 | +16.6 | ||
| Turnout | 50,486 | 68.9 | −7.3 | ||
| Labour hold | Swing | ||||
| Party | Candidate | Votes | % | ± | |
|---|---|---|---|---|---|
| Labour | David Hinchliffe | 26,964 | 50.6 | +4.0 | |
| Conservative | David P. Fanthorpe | 20,374 | 38.3 | −3.0 | |
| Liberal Democrat | Tim J. Wright | 5,900 | 11.1 | −1.0 | |
| Majority | 6,590 | 12.4 | +7.1 | ||
| Turnout | 53,238 | 76.2 | +0.7 | ||
| Labour hold | Swing | +3.5 | |||
Elections in the 1980s
| Party | Candidate | Votes | % | ± | |
|---|---|---|---|---|---|
| Labour | David Hinchliffe | 24,509 | 46.61 | ||
| Conservative | NJ Hazell | 21,720 | 41.31 | ||
| Social Democratic | L Kamal | 6,350 | 12.08 | ||
| Majority | 2,789 | 5.30 | |||
| Turnout | 75.57 | ||||
| Labour hold | Swing | ||||
| Party | Candidate | Votes | % | ± | |
|---|---|---|---|---|---|
| Labour | Walter Harrison | 19,166 | 40.41 | ||
| Conservative | NJ Hazell | 18,806 | 39.65 | ||
| Social Democratic | D Carlton | 9,166 | 19.32 | ||
| BNP | V Parker | 295 | 0.62 | ||
| Majority | 360 | 0.76 | |||
| Turnout | 69.33 | ||||
| Labour hold | Swing | ||||
Elections in the 1970s
| Party | Candidate | Votes | % | ± | |
|---|---|---|---|---|---|
| Labour | Walter Harrison | 27,124 | 50.90 | ||
| Conservative | J Sheard | 19,571 | 36.73 | ||
| Liberal | N Collins-Tooth | 6,059 | 11.37 | ||
| National Front | A Cooper | 530 | 0.99 | ||
| Majority | 7,553 | 14.17 | |||
| Turnout | 75.57 | ||||
| Labour hold | Swing | ||||
| Party | Candidate | Votes | % | ± | |
|---|---|---|---|---|---|
| Labour | Walter Harrison | 25,616 | 54.82 | ||
| Conservative | EJL Koops | 12,810 | 27.41 | ||
| Liberal | A Fussey | 8,304 | 17.77 | ||
| Majority | 12,806 | 27.40 | |||
| Turnout | 70.23 | ||||
| Labour hold | Swing | ||||
| Party | Candidate | Votes | % | ± | |
|---|---|---|---|---|---|
| Labour | Walter Harrison | 27,032 | 51.34 | ||
| Conservative | EJL Koops | 15,614 | 29.65 | ||
| Liberal | A Fussey | 10,009 | 19.01 | ||
| Majority | 11,418 | 21.68 | |||
| Turnout | 79.87 | ||||
| Labour hold | Swing | ||||
| Party | Candidate | Votes | % | ± | |
|---|---|---|---|---|---|
| Labour | Walter Harrison | 27,352 | 58.08 | ||
| Conservative | Dale Smith | 15,668 | 33.27 | ||
| Liberal | Nancy Seear | 4,071 | 8.64 | ||
| Majority | 11,684 | 24.81 | |||
| Turnout | 72.65 | ||||
| Labour hold | Swing | ||||
Elections in the 1960s
| Party | Candidate | Votes | % | ± | |
|---|---|---|---|---|---|
| Labour | Walter Harrison | 28,907 | 65.39 | ||
| Conservative | Ron Benson | 15,299 | 34.61 | ||
| Majority | 13,608 | 30.78 | |||
| Turnout | 73.38 | ||||
| Labour hold | Swing | ||||
| Party | Candidate | Votes | % | ± | |
|---|---|---|---|---|---|
| Labour | Walter Harrison | 26,315 | 55.45 | ||
| Conservative | John Spence | 14,385 | 30.31 | ||
| Liberal | John M. Collins | 6,753 | 14.23 | ||
| Majority | 11,930 | 25.14 | |||
| Turnout | 77.97 | ||||
| Labour hold | Swing | ||||
Elections in the 1950s
| Party | Candidate | Votes | % | ± | |
|---|---|---|---|---|---|
| Labour | Arthur Creech Jones | 29,705 | 59.63 | ||
| Conservative | Michael Jopling | 20,114 | 40.37 | ||
| Majority | 9,591 | 19.25 | |||
| Turnout | 81.95 | ||||
| Labour hold | Swing | ||||
| Party | Candidate | Votes | % | ± | |
|---|---|---|---|---|---|
| Labour | Arthur Creech Jones | 28,180 | 60.45 | ||
| Conservative | Denton Hinchcliffe | 18,435 | 39.55 | ||
| Majority | 9,745 | 20.91 | |||
| Turnout | 77.92 | ||||
| Labour hold | Swing | ||||
| Party | Candidate | Votes | % | ± | |
|---|---|---|---|---|---|
| Labour | Arthur Creech Jones | 21,822 | 58.14 | -0.14 | |
| Conservative | Maurice Macmillan | 15,714 | 41.86 | +0.14 | |
| Majority | 6,108 | 16.27 | -0.29 | ||
| Turnout | 37,536 | ||||
| Labour hold | Swing | ||||
| Party | Candidate | Votes | % | ± | |
|---|---|---|---|---|---|
| Labour | Arthur Greenwood | 27,100 | 58.28 | ||
| Conservative | Maurice Grant | 19,398 | 41.72 | ||
| Majority | 7,702 | 16.56 | |||
| Turnout | 85.27 | ||||
| Labour hold | Swing | ||||
| Party | Candidate | Votes | % | ± | |
|---|---|---|---|---|---|
| Labour | Arthur Greenwood | 25,996 | 55.38 | ||
| Conservative | Harry Watson | 15,925 | 33.92 | ||
| Liberal | Stanley Berwin | 5,022 | 10.70 | ||
| Majority | 10,071 | 21.45 | |||
| Turnout | 87.31 | ||||
| Labour hold | Swing | ||||
Election in the 1940s
| Party | Candidate | Votes | % | ± | |
|---|---|---|---|---|---|
| Labour | Arthur Greenwood | 14,378 | 54.75 | ||
| Conservative | Harry Watson | 8,268 | 31.49 | ||
| Liberal | George Leonard Jack Oliver | 3,613 | 13.76 | ||
| Majority | 6,110 | 23.27 | |||
| Turnout | 80.37 | ||||
| Labour hold | Swing | ||||
Elections in the 1930s
| Party | Candidate | Votes | % | ± | |
|---|---|---|---|---|---|
| Labour | Arthur Greenwood | 15,804 | 56.03 | ||
| Conservative | AE Greaves | 12,400 | 43.97 | ||
| Majority | 3,404 | 12.07 | |||
| Turnout | 84.91 | ||||
| Labour hold | Swing | ||||
| Party | Candidate | Votes | % | ± | |
|---|---|---|---|---|---|
| Labour | Arthur Greenwood | 13,586 | 50.6 | ||
| Conservative | A. E. Greaves | 13,242 | 49.4 | ||
| Majority | 344 | ||||
| Turnout | 83.0 | ||||
| Labour gain from Conservative | Swing | ||||
| Party | Candidate | Votes | % | ± | |
|---|---|---|---|---|---|
| Conservative | George Hillman | 15,881 | 57.43 | ||
| Labour | George Sherwood | 11,774 | 42.57 | ||
| Majority | 4,107 | 14.85 | |||
| Turnout | 85.53 | ||||
| Conservative gain from Labour | Swing | ||||
Elections in the 1920s
| Party | Candidate | Votes | % | ± | |
|---|---|---|---|---|---|
| Labour | George Sherwood | 13,393 | 48.8 | +0.9 | |
| Unionist | Geoffrey Ellis | 10,180 | 37.1 | -15.0 | |
| Liberal | Leonard Parish | 3,875 | 14.1 | n/a | |
| Majority | 3,213 | 11.7 | 15.9 | ||
| Turnout | 85.6 | +5.8 | |||
| Labour gain from Unionist | Swing | +7.9 | |||
| Party | Candidate | Votes | % | ± | |
|---|---|---|---|---|---|
| Unionist | Geoffrey Ellis | 11,086 | 52.1 | +15.3 | |
| Labour | George Sherwood | 10,192 | 47.9 | +8.0 | |
| Majority | 894 | 4.2 | 7.3 | ||
| Turnout | 84.8 | +3.9 | |||
| Unionist gain from Labour | Swing | +3.6 | |||
| Party | Candidate | Votes | % | ± | |
|---|---|---|---|---|---|
| Labour | George Sherwood | 7,966 | 39.9 | -8.6 | |
| Unionist | Geoffrey Ellis | 7,345 | 36.8 | -14.7 | |
| Liberal | Eric John Lassen | 4,640 | 23.3 | n/a | |
| Majority | 621 | 3.1 | 6.1 | ||
| Turnout | 80.9 | -3.5 | |||
| Labour gain from Unionist | Swing | +3.0 | |||
| Party | Candidate | Votes | % | ± | |
|---|---|---|---|---|---|
| Unionist | Geoffrey Ellis | 10,416 | 51.5 | -0.8 | |
| Labour | Albert Bellamy | 9,798 | 48.5 | +14.8 | |
| Majority | 618 | 3.0 | -15.6 | ||
| Turnout | 84.4 | +12.3 | |||
| Unionist hold | Swing | -7.8 | |||
Elections in the 1910s
| Party | Candidate | Votes | % | ± | |
|---|---|---|---|---|---|
| C | Unionist | Edward Brotherton | 9,128 | 52.3 | |
| Labour | Albert Bellamy | 5,882 | 33.7 | ||
| Liberal | Arthur Marshall | 2,448 | 14.0 | ||
| Majority | 3,246 | 18.6 | |||
| Turnout | 72.1 | ||||
| Unionist gain from Liberal | Swing | ||||
| C indicates candidate endorsed by the coalition government. | |||||
General Election 1914/15:
Another General Election was required to take place before the end of 1915. The political parties had been making preparations for an election to take place and by the July 1914, the following candidates had been selected;
- Liberal: Arthur Marshall
- Unionist: Edward Brotherton
| Party | Candidate | Votes | % | ± | |
|---|---|---|---|---|---|
| Liberal | Arthur Marshall | 2,837 | 51.7 | n/a | |
| Conservative | Edward Brotherton | 2,651 | 48.3 | -6.2 | |
| Majority | 186 | 3.4 | n/a | ||
| Turnout | 5,488 | ||||
| Liberal gain from Conservative | Swing | n/a | |||
| Party | Candidate | Votes | % | ± | |
|---|---|---|---|---|---|
| Conservative | Edward Brotherton | 3,121 | 54.5 | +13.7 | |
| Labour | Stanton Coit | 2,602 | 45.5 | +8.6 | |
| Majority | 519 | 9.0 | +5.1 | ||
| Turnout | 90.5 | +2.0 | |||
| Conservative hold | Swing | +2.5 | |||
Elections in the 1900s
| Party | Candidate | Votes | % | ± | |
|---|---|---|---|---|---|
| Conservative | Edward Brotherton | 2,285 | 40.8 | N/A | |
| Labour Repr. Cmte. | Stanton Coit | 2,068 | 36.9 | N/A | |
| Liberal | Thomas Snape | 1,247 | 22.3 | N/A | |
| Majority | 217 | 3.9 | N/A | ||
| Turnout | 5,600 | 88.5 | N/A | ||
| Registered electors | 6,326 | ||||
| Conservative hold | Swing | N/A | |||
| Party | Candidate | Votes | % | ± | |
|---|---|---|---|---|---|
| Conservative | Edward Brotherton | 2,960 | 59.9 | N/A | |
| Labour Repr. Cmte. | Philip Snowden | 1,979 | 40.1 | N/A | |
| Majority | 981 | 19.8 | N/A | ||
| Turnout | 4,939 | 80.9 | N/A | ||
| Registered electors | 6,103 | ||||
| Conservative hold | Swing | N/A | |||
| Party | Candidate | Votes | % | ± | |
|---|---|---|---|---|---|
| Liberal Unionist | William Wentworth-Fitzwilliam | Unopposed | |||
| Liberal Unionist hold | |||||
Elections in the 1890s
| Party | Candidate | Votes | % | ± | |
|---|---|---|---|---|---|
| Conservative | William Wentworth-Fitzwilliam | 2,884 | 56.9 | +2.7 | |
| Liberal | Henry Smithson Lee Wilson | 2,185 | 43.1 | −2.7 | |
| Majority | 699 | 13.8 | +5.4 | ||
| Turnout | 5,029 | 87.5 | −2.8 | ||
| Registered electors | 5,748 | ||||
| Conservative hold | Swing | +2.7 | |||
| Party | Candidate | Votes | % | ± | |
|---|---|---|---|---|---|
| Conservative | Albany Charlesworth | 2,582 | 54.2 | +0.5 | |
| Liberal | Thomas Young Strachan[28] | 2,178 | 45.8 | −0.5 | |
| Majority | 404 | 8.4 | +1.0 | ||
| Turnout | 4,199 | 90.3 | +2.8 | ||
| Registered electors | 5,274 | ||||
| Conservative hold | Swing | +0.5 | |||
Elections in the 1880s
| Party | Candidate | Votes | % | ± | |
|---|---|---|---|---|---|
| Conservative | Edward Green | 2,253 | 53.7 | +0.0 | |
| Liberal | John James Cousins[29] | 1,946 | 46.3 | +0.0 | |
| Majority | 307 | 7.4 | +0.0 | ||
| Turnout | 4,199 | 87.5 | −4.6 | ||
| Registered electors | 4,801 | ||||
| Conservative hold | Swing | +0.0 | |||
| Party | Candidate | Votes | % | ± | |
|---|---|---|---|---|---|
| Conservative | Edward Green | 2,374 | 53.7 | +8.7 | |
| Liberal | Wentworth Beaumont[30] | 2,049 | 46.3 | −8.7 | |
| Majority | 325 | 7.4 | N/A | ||
| Turnout | 4,423 | 92.1 | +2.0 | ||
| Registered electors | 4,801 | ||||
| Conservative gain from Liberal | Swing | +8.7 | |||
| Party | Candidate | Votes | % | ± | |
|---|---|---|---|---|---|
| Conservative | Edward Green | 1,918 | 53.6 | +8.6 | |
| Liberal | William Hartley Lee[32] | 1,661 | 46.4 | −8.6 | |
| Majority | 257 | 7.2 | N/A | ||
| Turnout | 3,579 | 88.9 | −1.2 | ||
| Registered electors | 4,026 | ||||
| Conservative gain from Liberal | Swing | +8.6 | |||
- Caused by Mackie's death.
| Party | Candidate | Votes | % | ± | |
|---|---|---|---|---|---|
| Liberal | Robert Bownas Mackie | 2,194 | 55.0 | +7.6 | |
| Conservative | Thomas Kemp Sanderson | 1,796 | 45.0 | −7.6 | |
| Majority | 398 | 10.0 | N/A | ||
| Turnout | 3,990 | 90.1 | +3.2 | ||
| Registered electors | 4,430 | ||||
| Liberal gain from Conservative | Swing | +7.6 | |||
Elections in the 1870s
| Party | Candidate | Votes | % | ± | |
|---|---|---|---|---|---|
| Conservative | Thomas Kemp Sanderson | 1,814 | 52.7 | +0.1 | |
| Liberal | Robert Bownas Mackie | 1,627 | 47.3 | −0.1 | |
| Majority | 187 | 5.4 | +0.1 | ||
| Turnout | 3,441 | 88.5 | +1.6 | ||
| Registered electors | 3,889 | ||||
| Conservative hold | Swing | +0.1 | |||
- Caused by the previous election being declared void on petition, on account of corruption.[33]
| Party | Candidate | Votes | % | ± | |
|---|---|---|---|---|---|
| Conservative | Edward Green | 1,779 | 52.6 | +3.3 | |
| Liberal | Robert Bownas Mackie | 1,600 | 47.4 | −3.3 | |
| Majority | 179 | 5.3 | N/A | ||
| Turnout | 3,379 | 86.9 | +2.3 | ||
| Registered electors | 3,889 | ||||
| Conservative gain from Liberal | Swing | +3.3 | |||
Elections in the 1860s
| Party | Candidate | Votes | % | ± | |
|---|---|---|---|---|---|
| Liberal | Somerset Beaumont | 1,557 | 50.7 | −1.9 | |
| Conservative | Thomas Kemp Sanderson | 1,512 | 49.3 | +1.9 | |
| Majority | 45 | 1.5 | −3.7 | ||
| Turnout | 3,069 | 84.6 | −4.2 | ||
| Registered electors | 3,627 | ||||
| Liberal hold | Swing | −1.9 | |||
| Party | Candidate | Votes | % | ± | |
|---|---|---|---|---|---|
| Liberal | William Henry Leatham | 507 | 52.6 | +2.4 | |
| Conservative | John Dalrymple-Hay | 457 | 47.4 | −2.4 | |
| Majority | 50 | 5.2 | +4.8 | ||
| Turnout | 964 | 88.8 | −2.9 | ||
| Registered electors | 1,086 | ||||
| Liberal hold | Swing | +2.4 | |||
| Party | Candidate | Votes | % | ± | |
|---|---|---|---|---|---|
| Conservative | John Dalrymple-Hay | 455 | 51.6 | +1.8 | |
| Liberal | Richard Smethurst[34] | 426 | 48.4 | −1.8 | |
| Majority | 29 | 3.3 | N/A | ||
| Turnout | 881 | 85.5 | −6.2 | ||
| Registered electors | 1,086 | ||||
| Conservative gain from Liberal | Swing | +1.8 | |||
- The writ, which had been suspended on 27 July 1859 with Leatham unseated due to being guilty of bribery via his agents,[35] was restored and a by-election was called.
Elections in the 1850s
| Party | Candidate | Votes | % | ± | |
|---|---|---|---|---|---|
| Liberal | William Henry Leatham | 406 | 50.2 | N/A | |
| Conservative | John Charlesworth Dodgson-Charlesworth | 403 | 49.8 | N/A | |
| Majority | 3 | 0.4 | N/A | ||
| Turnout | 809 | 91.7 | N/A | ||
| Registered electors | 882 | ||||
| Liberal gain from Conservative | Swing | N/A | |||
| Party | Candidate | Votes | % | ± | |
|---|---|---|---|---|---|
| Conservative | John Charlesworth Dodgson-Charlesworth | Unopposed | |||
| Registered electors | 906 | ||||
| Conservative hold | |||||
| Party | Candidate | Votes | % | ± | |
|---|---|---|---|---|---|
| Conservative | George Sandars | 359 | 52.4 | ||
| Whig | William Henry Leatham[36] | 326 | 47.6 | ||
| Majority | 33 | 4.8 | |||
| Turnout | 685 | 89.4 | |||
| Registered electors | 766 | ||||
| Conservative hold | Swing | ||||
See also
Notes and references
- Notes
- ↑ A county constituency (for the purposes of election expenses and type of returning officer)
- ↑ As with all constituencies, the constituency elects one Member of Parliament (MP) by the first past the post system of election at least every five years.
- ↑ The wards of: Denby Dale and large parts of Almondbury, and Kirkburton
- ↑ This Cornish seat was a 19th century byword for corruption, Grampound.
- ↑ The Labour majority in 1966 was the greatest at 30.8% of the vote; that in 1983 was the narrowest since 1932, at 360 votes, see incumbent MP Walter Harrison (Lab) who did not stand for re-election in 1987.
- References
- ↑ "Electorate Figures – Boundary Commission for England". 2011 Electorate Figures. Boundary Commission for England. 4 March 2011. Archived from the original on 6 November 2010. Retrieved 13 March 2011.
- ↑ 2010 post-revision map Greater London and metropolitan areas of England
- ↑ Grid Reference Finder distance tools
- ↑ Redistribution of Seats Act 1885. Schedule 5. Contents and Boundaries of Boroughs with altered Boundaries
- ↑ List of Labour MPs elected in 2015 by % majority UK Political.info. Retrieved 2017-01-29
- ↑ Jenkins, Roy, Churchill: A Biography (London, Macmillan, 2001), page 601
- ↑ Marr, Andrew: A History of Modern Britain (2009 paperback), page xvii
- ↑ "Parliament", The Times, 18 June 1936.
- ↑ Unemployment claimants by constituency The Guardian
- ↑ Leigh Rayment's Historical List of MPs – Constituencies beginning with "W" (part 1)
- ↑ "Election Data 2015". Electoral Calculus. Archived from the original on 17 October 2015. Retrieved 17 October 2015.
- ↑ "Wakefield". BBC News. Retrieved 13 May 2015.
- ↑ "Wakefield parliamentary constituency - Election 2017 - BBC News". BBC News. Retrieved 11 June 2017.
- ↑ "Election Data 2010". Electoral Calculus. Archived from the original on 26 July 2013. Retrieved 17 October 2015.
- ↑ "UK > England > Yorkshire & the Humber > Wakefield". Election 2010. BBC. 7 May 2010. Retrieved 13 May 2010.
- ↑ "Election Data 2005". Electoral Calculus. Archived from the original on 15 October 2011. Retrieved 18 October 2015.
- ↑ "Election Data 2001". Electoral Calculus. Archived from the original on 15 October 2011. Retrieved 18 October 2015.
- ↑ "Election Data 1997". Electoral Calculus. Archived from the original on 15 October 2011. Retrieved 18 October 2015.
- ↑ "Election Data 1992". Electoral Calculus. Archived from the original on 15 October 2011. Retrieved 18 October 2015.
- ↑ "Politics Resources". Election 1992. Politics Resources. 9 April 1992. Retrieved 6 December 2010.
- ↑ "Election Data 1987". Electoral Calculus. Archived from the original on 15 October 2011. Retrieved 18 October 2015.
- ↑ "Election Data 1983". Electoral Calculus. Archived from the original on 15 October 2011. Retrieved 18 October 2015.
- 1 2 3 4 5 British Parliamentary Election Results 1918–1949, FWS Craig
- 1 2 3 4 5 British parliamentary election results, 1885–1918 (Craig)
- ↑ "Election intelligence". The Times (36725). London. 26 March 1902. p. 10.
- 1 2 3 4 5 "Election intelligence". The Times (36697). London. 21 February 1902. p. 8.
- 1 2 3 4 Craig, FWS, ed. (1974). British Parliamentary Election Results: 1885-1918. London: Macmillan Press. ISBN 9781349022984.
- ↑ The Times. 1 Jul 1892 https://www.fold3.com/document/269724534/. Retrieved 20 November 2017. Missing or empty
|title=(help) - ↑ "Yesterday's Nominations". London Evening Standard. 2 July 1886. p. 3. Retrieved 14 December 2017 – via British Newspaper Archive. (Subscription required (help)).
- ↑ "Liberal Meeting at Wakefield. Adoption of Candidate". Barnsley Chronicle. 31 October 1885. p. 8. Retrieved 14 December 2017 – via British Newspaper Archive. (Subscription required (help)).
- 1 2 3 4 5 6 7 8 9 10 Craig, F. W. S., ed. (1977). British Parliamentary Election Results 1832-1885 (e-book)
|format=requires|url=(help) (1st ed.). London: Macmillan Press. ISBN 978-1-349-02349-3. - ↑ "Summary of News". Sheffield Independent. 3 July 1885. p. 2. Retrieved 14 December 2017 – via British Newspaper Archive. (Subscription required (help)).
- ↑ "Wakefield Election Petition". Londonderry Sentinel. 25 April 1874. p. 2. Retrieved 21 January 2018 – via British Newspaper Archive. (Subscription required (help)).
- ↑ "Wakefield Election". Nottinghamshire Guardian. 28 February 1862. p. 8. Retrieved 21 March 2018 – via British Newspaper Archive. (Subscription required (help)).
- ↑ "Imperial Parliament". North Wales Chronicle. 30 July 1859. pp. 6–7. Retrieved 21 March 2018 – via British Newspaper Archive. (Subscription required (help)).
- ↑ "The Elections". Leeds Intelligencer. 10 July 1852. p. 3. Retrieved 15 July 2018 – via British Newspaper Archive. (Subscription required (help)).