Rhondda (UK Parliament constituency)
| Rhondda | |
|---|---|
|
County constituency for the House of Commons | |
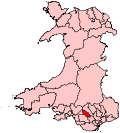 Boundary of Rhondda in Wales. | |
| Preserved county | Mid Glamorgan |
| Electorate | 52,862 (December 2010)[1] |
| Major settlements | Porth, Tonypandy, Treherbert, Treorchy, Tylorstown |
| Current constituency | |
| Created | 1974 |
| Member of parliament | Chris Bryant (Labour) |
| Number of members | One |
| Created from | Rhondda East and Rhondda West |
| 1885–1918 | |
| Number of members | One |
| Type of constituency | County constituency |
| Replaced by | Rhondda East and Rhondda West |
| Created from | Glamorganshire |
| Overlaps | |
| Welsh Assembly | South Wales Central |
| European Parliament constituency | Wales |
Rhondda is a parliamentary constituency represented in the House of Commons of the Parliament of the United Kingdom. It elects one Member of Parliament (MP) by the first past the post system of election. The current MP is Chris Bryant of the Labour Party, first elected at the 2001 general election.
Boundaries
1974-1983: The Municipal Borough of Rhondda.
1983-2010: The Borough of Rhondda.
2010–present: The Rhondda Cynon Taff County Borough electoral divisions of Cwm Clydach, Cymmer, Ferndale, Llwyn-y-pia, Maerdy, Pentre, Pen-y-graig, Porth, Tonypandy, Trealaw, Treherbert, Treorchy, Tylorstown, Ynyshir, and Ystrad.
The Westminster constituency of Rhondda is based around the southern edge of the Rhondda Cynon Taf council area, with population centres including Treherbert, Maerdy, Tylorstown, Tonypandy, and Pen-y-Graig. The seat borders the constituencies of Cynon Valley, Ogmore, Pontypridd, and Aberavon.
History
This constituency was first created under the Redistribution of Seats Act 1885, for the 1885 general election. For the 1918 general election it was divided into Rhondda East and Rhondda West.
The constituency was re-united in 1974. Since 1974, the constituency has always had a large Labour majority, and in the 1987 general election was the safest seat for any party, anywhere in Britain. In 2001, it was the only seat in the country where Liberal Democrats lost their deposit, and the Conservative Party also lost their deposit in their worst performance outside Northern Ireland.[2]
Early History: the 1885 General Election
The constituency was formed following the Third Reform Act of 1884, as a result of the rapid growth of population in the two valleys over the previous twenty years. During the 1880s the demand for working men representatives in the ranks of the Parliamentary Liberal Party were increasingly vociferous and there was a precedent for a Liberal-Labour (Lib-Lab) candidate in South Wales as Thomas Halliday had contested Merthyr Tydfil in 1874.
The local trade union, the Rhondda Steam Coal Miners' Association, laid claim to the candidacy as early as 1883, on the basis that the franchise had been extended to many working men within the county constituencies and that in Mabon, their agent for six years they had the ideal candidate.[3] The local Liberal Association, however, formed in early 1885,was dominated by middle-class business and professional men, and included a disproportionate number of colliery officials. . Lewis Davis of Ferndale, brother of David Davis, Maesyffynnon, one of the leading coalowners in the valley, was selected as president of the association.[3] Ministers, including William Morris of Noddfa, Treorchy were also prominent.[4] At a meeting in April 1885 six names were put forward as possible candidates for the nomination, including Lewis Davis, Mabon and Alfred Thomas, a leading figure in the municipal life of Cardiff.[4] Shortly afterwards, Lewis Davis was invited by the Association to be its parliamentary candidate and defeated Mabon in a ballot by 143 votes to 51. In spite of his selection, however, he declined and proposed that his son, the 22-year-old Frederick Lewis Davis, be the candidate. In a further ballot, F.L. Davis again defeated Mabon by 125 votes to 56.[3]
The refusal of the trade union movement to accept this decision and to support an independent campaign by Mabon is regarded as an important watershed in the political history of South Wales. In terms of policy there was little apparent difference between the candidates, with the only notable difference being that Mabon supported the payment of MPs while Davis did not.[3] The campaign was therefore waged on other grounds. Davis's supporters claimed that Mabon lacked legitimacy, having been rejected by the Liberal Association. Mabon's adherents, in turn, claimed that the miners' and held mass meetings throughout the two valleys to promote his candidature long before the middle-class-dominated Association was established.[3] Davis's youth and inexperience was a major issue, although he had qualified as a barrister. There were also claims of intimidation on both sides. Mabon's supporters were said to be victimised at the workplace while several of Davis's meetings were disrupted by violence.[3]
Class therefore became a major issue in the campaign. The vast majority of Mabon' supporters were trade union activists and working men, along with a relatively small number of tradesmen and professionals, some of whom had links of one form or another to the miners' union. These included Walter H. Morgan of Pontypridd, often described as the miners' lawyer. One nonconformist minister, supported Mabon, namely John Salisbury Edwards of Treorchy. In contest, Davis had the support of the vast majority of the middle-classes in the Rhondda, and natural deference together with the paternalistic influence of the Davis family, in the Rhondda Fach in particular, was a factor.[3]
On polling day, Mabon scored a clear and decisive victory.
| Party | Candidate | Votes | % | ± | |
|---|---|---|---|---|---|
| Lib-Lab | William Abraham | 3,859 | 56.3 | N/A | |
| Liberal | Frederick Lewis Davis | 2,992 | 43.7 | N/A | |
| Majority | 867 | 12.6 | N/A | ||
| Turnout | 6851 | 83.5 | N/A | ||
| Lib-Lab win (new seat) | |||||
Despite the fierce contest the two wings of the Liberal Party in the Rhondda were soon reconciled. After the result, the Davis family accepted Mabon's victory and he was not challenged thereafter for the parliamentray seat. Following the election, Mabon's supporters established the Rhondda Labour and Liberal Association which shortly afterwards absorbed the rival Liberal Association which had supported Davis.[3] Mabon was returned unopposed the following year.
| Party | Candidate | Votes | % | ± | |
|---|---|---|---|---|---|
| Lib-Lab | William Abraham | Unopposed | N/A | N/A | |
| Lib-Lab hold | Swing | N/A | |||
Members of Parliament
MPs 1885–1918
| Election | Member[5] | Party | |
|---|---|---|---|
| 1885 | William Abraham | Lib-Lab | |
| 1910 | Labour | ||
| 1918 | constituency abolished: see Rhondda East and Rhondda West | ||
MPs since 1974
| Election | Member[5] | Party | Notes | |
|---|---|---|---|---|
| Feb 1974 | Alec Jones | Labour | Shadow Welsh Secretary 1979-1983. Died in office March 1983; no by-election held due to imminent general election. | |
| 1983 | Allan Rogers | Labour | ||
| 2001 | Chris Bryant | Labour | Shadow Cabinet Member 2011–16 | |
Elections
Elections 1974-present
Elections in the 2010s
| Party | Candidate | Votes | % | ± | |
|---|---|---|---|---|---|
| Labour | Chris Bryant | 21,096 | 64.1 | +13.4 | |
| Plaid Cymru | Branwen Cennard | 7,350 | 22.3 | -4.7 | |
| Conservative | Virginia Crosbie | 3,333 | 10.1 | +3.4 | |
| UKIP | Janet Kenrick | 880 | 2.7 | -10.0 | |
| Liberal Democrat | Karen Roberts | 277 | 0.8 | -0.7 | |
| Majority | 13,746 | 41.8 | +18.2 | ||
| Turnout | 32,886 | 65.2 | +4.3 | ||
| Registered electors | 50,514 | ||||
| Labour hold | Swing | +9.1 | |||
The seat saw the fewest Conservative votes on mainland Great Britain in 2017, 22 fewer than in Manchester Gorton; likewise as to the Liberal Democrat votes, 18 votes fewer than in Blaenau Gwent[7]
| Party | Candidate | Votes | % | ± | |
|---|---|---|---|---|---|
| Labour | Chris Bryant | 15,976 | 50.7 | −4.6 | |
| Plaid Cymru | Shelley Rees-Owen | 8,521 | 27.0 | +8.9 | |
| UKIP | Ron Hughes | 3,998 | 12.7 | +11.5 | |
| Conservative | Lyn Hudson | 2,116 | 6.7 | +0.3 | |
| Liberal Democrat | George Summers | 474 | 1.5 | −9.1 | |
| Green | Lisa Rapado | 453 | 1.4 | N/A | |
| Majority | 7,455 | 23.6 | −13.6 | ||
| Turnout | 31,538 | 60.9 | +0.6 | ||
| Registered electors | 51,811 | ||||
| Labour hold | Swing | −6.8 | |||
| Party | Candidate | Votes | % | ± | |
|---|---|---|---|---|---|
| Labour | Chris Bryant | 17,183 | 55.3 | −12.8 | |
| Plaid Cymru | Geraint Davies | 5,630 | 18.1 | +2.2 | |
| Liberal Democrat | Paul Wasley | 3,309 | 10.6 | +0.2 | |
| Independent | Philip Howe | 2,599 | 8.4 | N/A | |
| Conservative | Juliette Henderson | 1,993 | 6.4 | +0.9 | |
| UKIP | Taffy John | 359 | 1.2 | N/A | |
| Majority | 11,553 | 37.2 | -14.9 | ||
| Turnout | 31,072 | 60.3 | −1.5 | ||
| Registered electors | 51,554 | ||||
| Labour hold | Swing | −7.5 | |||
Elections in the 2000s
| Party | Candidate | Votes | % | ± | |
|---|---|---|---|---|---|
| Labour | Chris Bryant | 21,198 | 68.1 | −0.2 | |
| Plaid Cymru | Percy Jones | 4,956 | 15.9 | −5.2 | |
| Liberal Democrat | Karen Roberts | 3,264 | 10.5 | +6.0 | |
| Conservative | Paul Stuart-Smith | 1,730 | 5.6 | +1.0 | |
| Majority | 16,242 | 52.1 | +4.9 | ||
| Turnout | 31,148 | 61.0 | +0.4 | ||
| Registered electors | 50,461 | ||||
| Labour hold | Swing | +2.5 | |||
| Party | Candidate | Votes | % | ± | |
|---|---|---|---|---|---|
| Labour | Chris Bryant | 23,230 | 68.3 | −6.1 | |
| Plaid Cymru | Leanne Wood | 7,183 | 21.1 | +7.8 | |
| Conservative | Peter Hobbins | 1,557 | 4.6 | +0.8 | |
| Liberal Democrat | Gavin Cox | 1,525 | 4.5 | −1.2 | |
| Independent | Glyndwr Summers | 507 | 1.5 | N/A | |
| Majority | 16,047 | 47.2 | -13.9 | ||
| Turnout | 34,002 | 60.6 | −10.9 | ||
| Registered electors | 56,121 | ||||
| Labour hold | Swing | -7.0 | |||
Elections in the 1990s
| Party | Candidate | Votes | % | ± | |
|---|---|---|---|---|---|
| Labour | Allan Rogers | 30,381 | 74.5 | +0.0 | |
| Plaid Cymru | Leanne Wood | 5,450 | 13.4 | +1.6 | |
| Liberal Democrat | Rodney Berman | 2,307 | 5.7 | +0.4 | |
| Conservative | Steven Whiting | 1,551 | 3.8 | −4.0 | |
| Referendum | Stephen Gardiner | 658 | 1.6 | N/A | |
| Green | Kevin Jakeway | 460 | 1.1 | N/A | |
| Majority | 24,931 | 61.1 | -1.6 | ||
| Turnout | 40,807 | 71.5 | -5.1 | ||
| Registered electors | 57,105 | ||||
| Labour hold | Swing | -0.80 | |||
| Party | Candidate | Votes | % | ± | |
|---|---|---|---|---|---|
| Labour | Allan Rogers | 34,243 | 74.5 | +1.2 | |
| Plaid Cymru | Geraint Davies | 5,427 | 11.8 | +2.9 | |
| Conservative | John Richards | 3,588 | 7.8 | +0.2 | |
| Liberal Democrat | Paul Nicholls-Jones | 2,431 | 5.3 | N/A | |
| Communist Party of Great Britain (Provisional Central Committee) | Mark Fischer | 245 | 0.5 | N/A | |
| Majority | 28,816 | 62.7 | −1.6 | ||
| Turnout | 45,934 | 76.6 | −1.4 | ||
| Registered electors | 59,955 | ||||
| Labour hold | Swing | −0.8 | |||
Elections in the 1980s
| Party | Candidate | Votes | % | ± | |
|---|---|---|---|---|---|
| Labour | Allan Rogers | 35,015 | 73.4 | +11.7 | |
| Plaid Cymru | Geraint Davies | 4,261 | 8.9 | −1.3 | |
| Social Democratic | John York-Williams | 3,930 | 8.2 | −8.7 | |
| Conservative | Stephen Reid | 3,611 | 7.8 | −0.5 | |
| Communist | Arthur True | 869 | 1.8 | −1.0 | |
| Majority | 30,754 | 64.5 | +19.7 | ||
| Turnout | 47,686 | 78.3 | +2.1 | ||
| Registered electors | 60,931 | ||||
| Labour hold | Swing | ||||
| Party | Candidate | Votes | % | ± | |
|---|---|---|---|---|---|
| Labour | Allan Rogers | 29,448 | 61.7 | -13.5 | |
| Social Democratic | Allan Lloyd | 8,078 | 16.9 | N/A | |
| Plaid Cymru | Geraint Davies | 4,845 | 10.2 | +0.0 | |
| Conservative | Peter Meyer | 3,973 | 8.3 | -4.6 | |
| Communist | Arthur True | 1,350 | 2.8 | -0.8 | |
| Majority | 21,370 | 44.8 | -17.4 | ||
| Turnout | 47,694 | 76.2 | -3.6 | ||
| Registered electors | 62,587 | ||||
| Labour hold | Swing | ||||
Elections in the 1970s
| Party | Candidate | Votes | % | ± | |
|---|---|---|---|---|---|
| Labour | Alec Jones | 38,007 | 75.2 | −1.9 | |
| Conservative | Peter Leyshon | 6,526 | 12.9 | +5.4 | |
| Plaid Cymru | Glyn Powell James | 4,226 | 10.2 | +1.9 | |
| Communist | Arthur True | 1,819 | 3.6 | +0.8 | |
| Majority | 31,481 | 62.2 | -6.6 | ||
| Turnout | 50,578 | 79.8 | +3.6 | ||
| Registered electors | 63,412 | ||||
| Labour hold | Swing | ||||
| Party | Candidate | Votes | % | ± | |
|---|---|---|---|---|---|
| Labour | Alec Jones | 38,654 | 77.1 | +6.4 | |
| Plaid Cymru | Donald Morgan | 4,173 | 8.3 | −4.6 | |
| Conservative | Peter Leyshon | 3,739 | 7.5 | −0.4 | |
| Liberal | Dennis James Austin | 2,142 | 4.3 | −1.6 | |
| Communist | Arthur True | 1,404 | 2.8 | +0.2 | |
| Majority | 34,481 | 68.8 | +11.0 | ||
| Turnout | 50,488 | 76.2 | −3.8 | ||
| Registered electors | 65,787 | ||||
| Labour hold | Swing | ||||
| Party | Candidate | Votes | % | ± | |
|---|---|---|---|---|---|
| Labour | Alec Jones | 36,880 | 70.7 | N/A | |
| Plaid Cymru | Glyn Powell James | 6,739 | 12.9 | N/A | |
| Conservative | Peter Leyshon | 4,111 | 7.9 | N/A | |
| Liberal | Dennis James Austin | 3,056 | 5.9 | N/A | |
| Communist | Arthur True | 1,374 | 2.6 | N/A | |
| Majority | 30,141 | 57.8 | N/A | ||
| Turnout | 52,160 | 80.0 | N/A | ||
| Registered electors | 65,192 | ||||
| Labour win (new seat) | |||||
Elections 1885-1910
Elections in the 1910s
| Party | Candidate | Votes | % | ± | |
|---|---|---|---|---|---|
| Labour | William Abraham | 9,073 | 71.0 | -7.2 | |
| Conservative | Harold Lloyd | 3,701 | 29.0 | +7.2 | |
| Majority | 5,372 | 42.0 | -14.4 | ||
| Turnout | 12,774 | 72.4 | -17.8 | ||
| Registered electors | 17,640 | ||||
| Labour hold | Swing | -7.2 | |||
| Party | Candidate | Votes | % | ± | |
|---|---|---|---|---|---|
| Labour | William Abraham | 12,436 | 78.2 | N/A | |
| Conservative | Harold Lloyd | 3,471 | 21.8 | N/A | |
| Majority | 8,965 | 56.4 | N/A | ||
| Turnout | 15,907 | 90.2 | N/A | ||
| Registered electors | 17,640 | ||||
| Labour hold | Swing | N/A | |||
Elections in the 1900s

| Party | Candidate | Votes | % | ± | |
|---|---|---|---|---|---|
| Lib-Lab | William Abraham | Unopposed | |||
| Registered electors | |||||
| Lib-Lab hold | |||||
| Party | Candidate | Votes | % | ± | |
|---|---|---|---|---|---|
| Lib-Lab | William Abraham | 8,383 | 81.7 | N/A | |
| Conservative | Robert Hughes | 1,874 | 18.3 | N/A | |
| Majority | 6,509 | 63.4 | N/A | ||
| Turnout | 10,257 | 81.7 | N/A | ||
| Registered electors | 12,549 | ||||
| Lib-Lab hold | Swing | N/A | |||
Elections in the 1890s
| Party | Candidate | Votes | % | ± | |
|---|---|---|---|---|---|
| Lib-Lab | William Abraham | Unopposed | |||
| Registered electors | |||||
| Lib-Lab hold | |||||
| Party | Candidate | Votes | % | ± | |
|---|---|---|---|---|---|
| Lib-Lab | William Abraham | Unopposed | |||
| Registered electors | |||||
| Lib-Lab hold | |||||
Elections in the 1880s
| Party | Candidate | Votes | % | ± | |
|---|---|---|---|---|---|
| Lib-Lab | William Abraham | Unopposed | |||
| Registered electors | |||||
| Lib-Lab gain from Independent Lib-Lab | |||||
| Party | Candidate | Votes | % | ± | |
|---|---|---|---|---|---|
| Independent Lib-Lab | William Abraham | 3,859 | 56.3 | N/A | |
| Liberal | Frederick Lewis Davis | 2,992 | 43.7 | N/A | |
| Majority | 867 | 12.6 | N/A | ||
| Turnout | 6,851 | 83.5 | N/A | ||
| Registered electors | 8,210 | ||||
| Independent Liberal-Labour win (new seat) | |||||
See also
- Rhondda (Assembly constituency)
- List of Parliamentary constituencies in Mid Glamorgan
- List of Parliamentary constituencies in Wales
- A map of Glamorganshire in 1885, showing its new divisions.
Notes and references
- ↑ "Beyond 20/20 WDS - Table view". 2011 Electorate Figures. StatsWales. 1 December 2010. Retrieved 13 March 2011.
- ↑ Archived 25 March 2009 at the Wayback Machine.
- 1 2 3 4 5 6 7 8 Williams. Democratic Rhondda. pp. 33–7.
- 1 2 "The Rhondda Valley Liberal Three Hundred". Cardiff Times. 11 April 1885. Retrieved 16 May 2014. .
- 1 2 Leigh Rayment's Historical List of MPs – Constituencies beginning with "R" (part 1)
- ↑ name=Wales Online>"General Election 2017: Who are the candidates standing in Rhondda?". Retrieved 15 May 2017.
- ↑ Results_of_the_United_Kingdom_general_election,_2017,_by_parliamentary_constituency
- ↑ "Election Data 2015". Electoral Calculus. Archived from the original on 17 October 2015. Retrieved 17 October 2015.
- ↑ "Election Data 2010". Electoral Calculus. Archived from the original on 26 July 2013. Retrieved 17 October 2015.
- ↑ Rhondda BBC Election - Rhondda
- ↑ "Election Data 2005". Electoral Calculus. Archived from the original on 15 October 2011. Retrieved 18 October 2015.
- ↑ "Election Data 2001". Electoral Calculus. Archived from the original on 15 October 2011. Retrieved 18 October 2015.
- ↑ "Election Data 1997". Electoral Calculus. Archived from the original on 15 October 2011. Retrieved 18 October 2015.
- ↑ "Election Data 1992". Electoral Calculus. Archived from the original on 15 October 2011. Retrieved 18 October 2015.
- ↑ "Politics Resources". Election 1992. Politics Resources. 9 April 1992. Retrieved 2010-12-06.
- ↑ "Election Data 1987". Electoral Calculus. Archived from the original on 15 October 2011. Retrieved 18 October 2015.
- ↑ "Election Data 1983". Electoral Calculus. Archived from the original on 15 October 2011. Retrieved 18 October 2015.
- 1 2 3 4 5 6 7 8 Craig, FWS, ed. (1974). British Parliamentary Election Results: 1885-1918. London: Macmillan Press. ISBN 9781349022984.
Bibliography
- Williams, Chris (1996). Democratic Rhondda: politics and Society 1885-1951. Cardiff: University of Wales Press.
- Morgan, Kenneth O. (1960). "Democratic Politics in Glamorgan, 1884-1914". Morgannwg. 4: 5–27.
External links
- Election result, 2005 (BBC)
- Election results, 1997 - 2001 (BBC)
- Election results, 1997 - 2001 (Election Demon)
- Election results, 1983 - 1992 (Election Demon)
- Election results, 1992 - 2005 (Guardian)
- Election results, 1974 - 2001 (Keele University)
- Politics Resources (Election results from 1922 onwards)
- Electoral Calculus (Election results from 1955 onwards)
- 2017 Election House Of Commons Library 2017 Election report
- A Vision Of Britain Through Time (Constituency elector numbers)