Newport East (UK Parliament constituency)
Coordinates: 51°35′35″N 2°55′12″W / 51.593°N 2.920°W
| Newport East | |
|---|---|
|
County constituency for the House of Commons | |
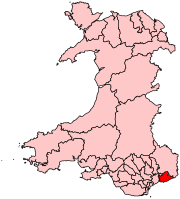 Boundary of Newport East in Wales. | |
| Preserved county | Gwent |
| Electorate | 55,224 (December 2010)[1] |
| Current constituency | |
| Created | 1983 |
| Member of parliament | Jessica Morden (Labour) |
| Number of members | One |
| Created from | Newport and Monmouth[2] |
| Overlaps | |
| Welsh Assembly | South Wales East |
| European Parliament constituency | Wales |
Newport East (Welsh: Dwyrain Casnewydd) is a parliamentary constituency represented in the House of Commons of the Parliament of the United Kingdom. It elects one Member of Parliament (MP) using the first-past-the-post voting system.
Boundaries
1983-1997: The Borough of Newport wards 2, 4, 7, 9, 11, 13, and 18 to 20, and the District of Monmouth wards 14 and 15.
1997-2010: The Borough of Newport wards of Alway, Beechwood, Langstone, Liswerry, Llanwern, Ringland, St Julian's, and Victoria, and the Borough of Monmouth wards of Caldicot Castle, Dewstow, Magor with Undy, Rogiet, Severn, and West End.
2010-present: The Newport County Borough electoral divisions of Alway, Beechwood, Langstone, Liswerry, Llanwern, Ringland, St Julian's, and Victoria, and the Monmouthshire County electoral divisions of Caldicot Castle, Dewstow, Green Lane, Mill, Rogiet, Severn, The Elms, and West End.
History
Newport East was created when the former Newport borough constituency was split into two divisions in 1983. It also included some rural areas formerly part of Monmouth county constituency. There have been only minor boundary changes since the constituency was created.
Members of Parliament
| Election | Member[3] | Party | |
|---|---|---|---|
| 1983 | Roy Hughes | Labour | |
| 1997 | Alan Howarth | ||
| 2005 | Jessica Morden | ||
Elections
Elections in the 2010s
| Party | Candidate | Votes | % | ± | |
|---|---|---|---|---|---|
| Labour | Jessica Morden | 20,804 | 56.5 | +15.8 | |
| Conservative | Natasha Asghar | 12,801 | 34.8 | +7.5 | |
| UKIP | Ian Gorman | 1,180 | 3.2 | -15.2 | |
| Liberal Democrat | Pete Brown | 966 | 2.6 | -3.8 | |
| Plaid Cymru | Cameron Wixcey | 881 | 2.4 | -1.1 | |
| Independent | Nadeem Ahmed | 188 | 0.5 | N/A | |
| Majority | 8,003 | 21.7 | +8.3 | ||
| Turnout | 36,820 | 64.3 | +1.6 | ||
| Registered electors | 57,211 | ||||
| Labour hold | Swing | +3.6 | |||
| Party | Candidate | Votes | % | ± | |
|---|---|---|---|---|---|
| Labour | Jessica Morden | 14,290 | 40.7 | +3.7 | |
| Conservative | Natasha Asghar | 9,585 | 27.3 | +4.3 | |
| UKIP | David Stock | 6,466 | 18.4 | +16.5 | |
| Liberal Democrat | Paul Halliday | 2,251 | 6.4 | -25.8 | |
| Plaid Cymru | Tony Salkeld[7] | 1,231 | 3.5 | +1.4 | |
| Green | David Mclean[8] | 887 | 2.5 | N/A | |
| Socialist Labour | Shangara Singh Bhatoe | 398 | 1.1 | +0.8 | |
| Majority | 4,705 | 13.4 | +8.6 | ||
| Turnout | 35,108 | 62.7 | -0.9 | ||
| Registered electors | 56,015 | ||||
| Labour hold | Swing | -0.3 | |||
| Party | Candidate | Votes | % | ± | |
|---|---|---|---|---|---|
| Labour | Jessica Morden | 12,744 | 37.0 | -8.2 | |
| Liberal Democrat | Ed Townsend | 11,094 | 32.2 | +8.5 | |
| Conservative | Dawn Parry | 7,918 | 23.0 | -0.5 | |
| BNP | Keith Jones | 1,168 | 3.4 | N/A | |
| Plaid Cymru | Fiona Cross | 724 | 2.1 | -1.7 | |
| UKIP | David Rowlands | 677 | 2.0 | -1.0 | |
| Socialist Labour | Elizabeth Screen | 123 | 0.4 | -0.4 | |
| Majority | 1,650 | 4.8 | -16.7 | ||
| Turnout | 34,448 | 63.6 | +5.7 | ||
| Registered electors | 54,437 | ||||
| Labour hold | Swing | -8.3 | |||
Elections in the 2000s
| Party | Candidate | Votes | % | ± | |
|---|---|---|---|---|---|
| Labour | Jessica Morden | 14,389 | 45.2 | -9.5 | |
| Liberal Democrat | Ed Townsend | 7,551 | 23.7 | +9.7 | |
| Conservative | Matthew Collings | 7,459 | 23.4 | +0.2 | |
| Plaid Cymru | Mohammad Asghar | 1,221 | 3.8 | -1.1 | |
| UKIP | Roger Thomas | 945 | 3.0 | +1.7 | |
| Socialist Labour | Elizabeth Screen | 260 | 0.8 | -0.5 | |
| Majority | 6,838 | 21.5 | -10.0 | ||
| Turnout | 31,825 | 57.9 | +3.2 | ||
| Registered electors | 54,941 | ||||
| Labour hold | Swing | -9.6 | |||
| Party | Candidate | Votes | % | ± | |
|---|---|---|---|---|---|
| Labour | Alan Howarth | 17,120 | 54.7 | -2.9 | |
| Conservative | Ian Oakley | 7,246 | 23.2 | +1.8 | |
| Liberal Democrat | Alistair Cameron | 4,394 | 14.0 | +3.6 | |
| Plaid Cymru | Madoc Batcup | 1,519 | 4.9 | +2.9 | |
| Socialist Labour | Elizabeth Screen | 420 | 1.3 | -3.9 | |
| UKIP | Neal Reynolds | 410 | 1.3 | N/A | |
| Communist | Robert Griffiths | 173 | 0.6 | N/A | |
| Majority | 9,874 | 31.5 | -4.8 | ||
| Turnout | 31,282 | 54.7 | -18.9 | ||
| Registered electors | 57,219 | ||||
| Labour hold | Swing | -2.4 | |||
Elections in the 1990s
| Party | Candidate | Votes | % | ± | |
|---|---|---|---|---|---|
| Labour | Alan Howarth | 21,481 | 57.7 | +2.7 | |
| Conservative | David Evans | 7,958 | 21.4 | −10.0 | |
| Liberal Democrat | Alistair Cameron | 3,880 | 10.4 | −1.5 | |
| Socialist Labour | Arthur Scargill | 1,951 | 5.2 | N/A | |
| Referendum | Edward Chaney-Davis | 1,267 | 3.4 | N/A | |
| Plaid Cymru | Christopher Holland | 721 | 1.9 | +0.2 | |
| Majority | 13,523 | 36.3 | +7.3 | ||
| Turnout | 37,258 | 73.1 | −7.9 | ||
| Registered electors | 50,676 | ||||
| Labour hold | Swing | +6.3 | |||
| Party | Candidate | Votes | % | ± | |
|---|---|---|---|---|---|
| Labour | Roy Hughes | 23,050 | 55.0 | +5.9 | |
| Conservative | Angela A. Emmett | 13,151 | 31.4 | −0.8 | |
| Liberal Democrat | William A. Oliver | 4,991 | 11.9 | N/A | |
| Plaid Cymru (Green) | Stephen M. Ainley | 716 | 1.7 | +0.6 | |
| Majority | 9,899 | 23.6 | +6.7 | ||
| Turnout | 41,908 | 81.2 | +0.3 | ||
| Registered electors | 51,603 | ||||
| Labour hold | Swing | ||||
Elections in the 1980s
| Party | Candidate | Votes | % | ± | |
|---|---|---|---|---|---|
| Labour | Roy Hughes | 20,518 | 49.1 | +9.5 | |
| Conservative | Graham Webster-Gardiner | 13,454 | 32.2 | −0.9 | |
| Social Democratic | Frances David | 7,383 | 17.7 | −7.9 | |
| Plaid Cymru | Gareth Butler | 458 | 1.1 | −0.6 | |
| Majority | 7,064 | 16.9 | +10.4 | ||
| Turnout | 41,813 | 79.9 | +3.3 | ||
| Registered electors | 52,199 | ||||
| Labour hold | Swing | ||||
| Party | Candidate | Votes | % | ± | |
|---|---|---|---|---|---|
| Labour | Roy Hughes | 15,931 | 39.6 | N/A | |
| Conservative | Roy Thomason | 13,301 | 33.1 | N/A | |
| Social Democratic | Frances David | 10,293 | 25.6 | N/A | |
| Plaid Cymru | David Thomas | 697 | 1.7 | N/A | |
| Majority | 2,630 | 6.5 | N/A | ||
| Turnout | 40,222 | 76.6 | N/A | ||
| Registered electors | 52,503 | ||||
| Labour win (new seat) | |||||
See also
Notes and references
- ↑ "Beyond 20/20 WDS - Table view". 2011 Electorate Figures. StatsWales. 1 December 2010. Archived from the original on 3 October 2011. Retrieved 13 March 2011.
- ↑ "'Newport East', June 1983 up to May 1997". ElectionWeb Project. Cognitive Computing Limited. Archived from the original on 14 March 2016. Retrieved 13 March 2016.
- ↑ Leigh Rayment's Historical List of MPs – Constituencies beginning with "N" (part 1)
- ↑ "Statement of Persons Nominated and Notice of Poll: Election of a Member of Parliament: Newport East Constituency" (PDF). Newport City Council. 11 May 2017. Archived (PDF) from the original on 27 January 2018. Retrieved 2 June 2017.
- ↑ "Election Data 2015". Electoral Calculus. Archived from the original on 17 October 2015. Retrieved 17 October 2015.
- 1 2 Newport East Archived 2017-08-23 at the Wayback Machine. BBC Election - Newport East
- ↑ "Under-fire Newport Ukip candidate faces calls to stand down". South Wales Argus. 27 January 2015. Archived from the original on 25 February 2015. Retrieved 25 February 2015.
- ↑ "David Mclean for Newport East and Pippa Bartolotti for Newport West". wales.greenparty.org.uk. Archived from the original on 3 February 2015. Retrieved 27 April 2018.
- ↑ "Election Data 2010". Electoral Calculus. Archived from the original on 26 July 2013. Retrieved 17 October 2015.
- ↑ "Election Data 2005". Electoral Calculus. Archived from the original on 15 October 2011. Retrieved 18 October 2015.
- ↑ "Election Data 2001". Electoral Calculus. Archived from the original on 15 October 2011. Retrieved 18 October 2015.
- ↑ "Election Data 1997". Electoral Calculus. Archived from the original on 15 October 2011. Retrieved 18 October 2015.
- ↑ "Election Data 1992". Electoral Calculus. Archived from the original on 15 October 2011. Retrieved 18 October 2015.
- ↑ "Politics Resources". Election 1992. Politics Resources. 9 April 1992. Archived from the original on 24 July 2011. Retrieved 2010-12-06.
- ↑ "Election Data 1987". Electoral Calculus. Archived from the original on 15 October 2011. Retrieved 18 October 2015.
- ↑ "Election Data 1983". Electoral Calculus. Archived from the original on 15 October 2011. Retrieved 18 October 2015.
External links
- Politics Resources (Election results from 1922 onwards)
- Electoral Calculus (Election results from 1955 onwards)
- 2017 Election House Of Commons Library 2017 Election report
- A Vision Of Britain Through Time (Constituency elector numbers)