Leeds East (UK Parliament constituency)
| Leeds East | |
|---|---|
|
Borough constituency for the House of Commons | |
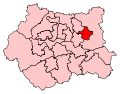 Boundary of Leeds East in West Yorkshire. | |
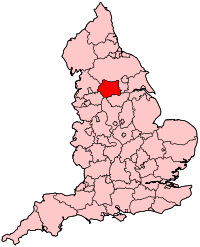 Location of West Yorkshire within England. | |
| County | West Yorkshire |
| Electorate | 64,742 (December 2010)[1] |
| Current constituency | |
| Created | 1955 |
| Member of parliament | Richard Burgon (Labour) |
| Created from | Leeds South East and Leeds North East |
| 1885–1918 | |
| Number of members | One |
| Type of constituency | Borough constituency |
| Replaced by |
Leeds North East Leeds South East |
| Created from | Leeds |
| Overlaps | |
| European Parliament constituency | Yorkshire and the Humber |
Leeds East is a constituency[n 1] represented in the House of Commons of the UK Parliament since 2015 by Richard Burgon of the Labour Party.[n 2]
The most notable of past MPs was Denis Healey who represented the constituency from 1955 to 1992. Healey was a very senior Labour politician, and was Chancellor of the Exchequer from 1974 to 1979.[2]
Boundaries
1885–1918: The Municipal Borough of Leeds ward of East, and parts of the wards of Central, North, and North East.
1955–1974: The County Borough of Leeds wards of Burmantofts, Crossgates, Halton, Harehills, and Osmondthorpe.
1974–1983: The County Borough of Leeds wards of Gipton, Halton, Osmondthorpe, Seacroft, and Whinmoor.
1983–2010: The City of Leeds wards of Burmantofts, Halton, Harehills, and Seacroft.
2010–present: The City of Leeds wards of Crossgates and Whinmoor, Gipton and Harehills, Killingbeck and Seacroft, and Temple Newsam.
History
The constituency was created in 1885 by the Redistribution of Seats Act 1885, and was first used in the general election of that year. Leeds had previously been represented by two MPs (1832–1868) and three MPs (1868–1885). From 1885 it was represented by five single-member constituencies: Leeds Central, Leeds East, Leeds North, Leeds South and Leeds West. The constituencies of Morley, Otley and Pudsey were also created in 1885.
The constituency was abolished in 1918. After the 1918 general election, Leeds was represented by Leeds Central, Leeds North, Leeds North-East (created 1918), Leeds South, Leeds South-East (created 1918), and Leeds West.
The constituency was recreated in 1955. After the 1955 general election Leeds was represented by Leeds East (created 1885, abolished 1918, recreated 1955), Leeds North East, Leeds North West (created 1950), Leeds South and Leeds South East. There were also constituencies of Batley and Morley (created 1918) and Pudsey and Otley (created 1918, replacing Pudsey).
Labour's Denis Healey held the seat for 37 years (1955–1992) and was Chancellor of the Exchequer during part of this time.
Members of Parliament
MPs 1885–1918
| Election | Member[3] | Party | |
|---|---|---|---|
| 1885 | Richard Dawson | ||
| 1886 | John Lawrence Gane | Liberal | |
| 1895 | Thomas Leuty | Liberal | |
| 1900 | Henry Cautley | Conservative | |
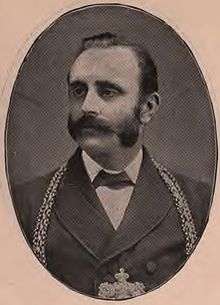
| 1906 | James O'Grady | Labour | |
| 1918 | constituency abolished | ||
MPs 1955–present
| Election | Member[3] | Party | |
|---|---|---|---|
| 1955 | Denis Healey | Labour | |
| 1992 | George Mudie | Labour | |
| 2015 | Richard Burgon | Labour | |
Elections
Elections in the 2010s
| Party | Candidate | Votes | % | ± | |
|---|---|---|---|---|---|
| Labour | Richard Burgon | 25,428 | 61.4 | +7.6 | |
| Conservative | Matthew Robinson | 12,676 | 30.6 | +9.7 | |
| UKIP | Paul Spivey | 1,742 | 4.2 | -14.8 | |
| Liberal Democrat | Ed Sanderson | 739 | 1.8 | -1.6 | |
| Green | Jaimes Moran | 434 | 1.0 | -1.9 | |
| Yorkshire Party | John Otley | 422 | 1.0 | N/A | |
| Majority | 12,752 | 30.8 | -2.0 | ||
| Turnout | 41,441 | 62.8 | +3.8 | ||
| Labour hold | Swing | -1.05 | |||
| Party | Candidate | Votes | % | ± | |
|---|---|---|---|---|---|
| Labour | Richard Burgon | 20,530 | 53.7 | +3.4 | |
| Conservative | Ryan Stephenson | 7,997 | 20.9 | -2.2 | |
| UKIP | Mark Maniatt | 7,256 | 19.0 | N/A | |
| Liberal Democrat | Ed Sanderson | 1,296 | 3.4 | -14.1 | |
| Green | Kate Bisson | 1,117 | 2.9 | N/A | |
| Majority | 12,533 | 32.8 | +5.1 | ||
| Turnout | 38,196 | 59.0 | +0.9 | ||
| Labour hold | Swing | +2.8 | |||
| Party | Candidate | Votes | % | ± | |
|---|---|---|---|---|---|
| Labour | George Mudie | 19,056 | 50.4 | −9.4 | |
| Conservative | Barry Anderson | 8,763 | 23.2 | +1.6 | |
| Liberal Democrat | Andrew Tear | 6,618 | 17.5 | +0.3 | |
| BNP | Trevor Brown | 2,947 | 7.8 | N/A | |
| Alliance for Green Socialism | Mike Davies[9] | 429 | 1.1 | N/A | |
| Majority | 10,293 | 27.2 | |||
| Turnout | 37,813 | 58.1 | +2.0 | ||
| Labour hold | Swing | −5.5 | |||
Elections in the 2000s
| Party | Candidate | Votes | % | ± | |
|---|---|---|---|---|---|
| Labour | George Mudie | 17,799 | 59.1 | −3.8 | |
| Liberal Democrat | Andrew Tear | 6,221 | 20.7 | +7.2 | |
| Conservative | Dominic Ponniah | 5,557 | 18.6 | −0.8 | |
| Independent | Peter Socrates | 500 | 1.7 | N/A | |
| Majority | 11,578 | 38.5 | −8.4 | ||
| Turnout | 30,107 | 55.0 | +3.5 | ||
| Labour hold | Swing | −5.5 | |||
| Party | Candidate | Votes | % | ± | |
|---|---|---|---|---|---|
| Labour | George Mudie | 18,290 | 62.9 | −4.5 | |
| Conservative | Barry Anderson | 5,647 | 19.4 | +0.8 | |
| Liberal Democrat | Brian Jennings | 3,923 | 13.5 | +3.2 | |
| UKIP | Raymond Northgreaves | 634 | 2.2 | N/A | |
| Socialist Labour | Mark King | 419 | 1.4 | N/A | |
| Independent | Peter Socrates | 142 | 0.5 | N/A | |
| Majority | 12,643 | 43.5 | −5.3 | ||
| Turnout | 29,055 | 51.5 | −11.3 | ||
| Labour hold | Swing | −2.7 | |||
Elections in the 1990s
| Party | Candidate | Votes | % | ± | |
|---|---|---|---|---|---|
| Labour | George Mudie | 24,151 | 67.5 | +9.8 | |
| Conservative | John Emsley | 6,685 | 18.7 | −9.6 | |
| Liberal Democrat | Madeleine Kirk | 3,689 | 10.3 | −3.7 | |
| Referendum | Leon Parrish | 1,267 | 3.5 | N/A | |
| Majority | 17,466 | 48.8 | +19.4 | ||
| Turnout | 35,792 | 62.8 | −7.2 | ||
| Labour hold | Swing | 9.7 | |||
| Party | Candidate | Votes | % | ± | |
|---|---|---|---|---|---|
| Labour | George Mudie | 24,929 | 57.7 | +9.0 | |
| Conservative | Neil Carmichael | 12,232 | 28.3 | +1.8 | |
| Liberal Democrat | Peter Wrigley | 6,040 | 14.0 | −10.8 | |
| Majority | 12,697 | 29.4 | +7.2 | ||
| Turnout | 43,201 | 70.0 | −0.2 | ||
| Labour hold | Swing | 3.6 | |||
Elections in the 1980s
| Party | Candidate | Votes | % | ± | |
|---|---|---|---|---|---|
| Labour | Denis Healey | 20,932 | 48.7 | +5.0 | |
| Conservative | John Sheard | 11,406 | 26.6 | −2.7 | |
| Liberal | Maggie Clay | 10,630 | 24.7 | −1.1 | |
| Majority | 9,526 | 22.2 | +7.7 | ||
| Turnout | 42,968 | 70.2 | +4.0 | ||
| Labour hold | Swing | +3.9 | |||
| Party | Candidate | Votes | % | ± | |
|---|---|---|---|---|---|
| Labour | Denis Healey | 18,450 | 43.8 | −11.7 | |
| Conservative | A. Bell | 12,355 | 29.3 | −4.0 | |
| Liberal | Maggie Clay | 10,884 | 25.8 | +16.0 | |
| National Front | Andrew Brons | 475 | 1.1 | +0.2 | |
| Majority | 6,095 | 14.5 | −7.7 | ||
| Turnout | 42,164 | 66.3 | −4.2 | ||
| Labour hold | Swing | −3.9 | |||
Elections in the 1970s
| Party | Candidate | Votes | % | ± | |
|---|---|---|---|---|---|
| Labour | Denis Healey | 26,346 | 55.43 | ||
| Conservative | A. Carter | 15,810 | 33.26 | ||
| Liberal | M.L. Ellis | 4,622 | 9.72 | ||
| National Front | John Stewart Rigby | 445 | 0.94 | ||
| Ecology | A.C. Hill | 206 | 0.43 | ||
| Workers Revolutionary | Barbara Slaughter | 103 | 0.22 | ||
| Majority | 10,536 | 22.17 | |||
| Turnout | 70.89 | ||||
| Labour hold | Swing | ||||
| Party | Candidate | Votes | % | ± | |
|---|---|---|---|---|---|
| Labour | Denis Healey | 24,745 | 55.64 | ||
| Conservative | J.W. Dawson | 12,434 | 27.96 | ||
| Liberal | S. Marsh | 6,970 | 15.67 | ||
| PEOPLE | N. Russell | 327 | 0.74 | ||
| Majority | 12,311 | 27.68 | |||
| Turnout | 65.66 | ||||
| Labour hold | Swing | ||||
| Party | Candidate | Votes | % | ± | |
|---|---|---|---|---|---|
| Labour | Denis Healey | 25,550 | 50.60 | ||
| Conservative | Anthony Nelson | 15,036 | 29.78 | ||
| Liberal | S. Marsh | 9,906 | 19.62 | ||
| Majority | 10,514 | 20.82 | |||
| Turnout | 75.26 | ||||
| Labour hold | Swing | ||||
| Party | Candidate | Votes | % | ± | |
|---|---|---|---|---|---|
| Labour | Denis Healey | 28,827 | 57.14 | ||
| Conservative | Patrick Crotty | 21,112 | 41.85 | ||
| Communist | Joan Bellamy | 513 | 1.02 | ||
| Majority | 7,715 | 15.29 | |||
| Turnout | 65.87 | ||||
| Labour hold | Swing | ||||
Elections in the 1960s
| Party | Candidate | Votes | % | ± | |
|---|---|---|---|---|---|
| Labour | Denis Healey | 30,073 | 61.54 | ||
| Conservative | Anthony Richard M Graham | 18,796 | 38.46 | ||
| Majority | 11,277 | 23.08 | |||
| Turnout | 72.73 | ||||
| Labour hold | Swing | ||||
| Party | Candidate | Votes | % | ± | |
|---|---|---|---|---|---|
| Labour | Denis Healey | 29,480 | 57.86 | ||
| Conservative | John A Fawcett | 21,474 | 42.14 | ||
| Majority | 8,006 | 15.71 | |||
| Turnout | 76.11 | ||||
| Labour hold | Swing | ||||
Elections in the 1950s
| Party | Candidate | Votes | % | ± | |
|---|---|---|---|---|---|
| Labour | Denis Healey | 28,707 | 54.55 | ||
| Conservative | John A Fawcett | 23,922 | 45.45 | ||
| Majority | 4,785 | 9.09 | |||
| Turnout | 79.65 | ||||
| Labour hold | Swing | ||||
| Party | Candidate | Votes | % | ± | |
|---|---|---|---|---|---|
| Labour | Denis Healey | 26,083 | 55.23 | ||
| Conservative | Cyril Donald Chapman | 21,144 | 44.77 | ||
| Majority | 4,939 | 10.46 | |||
| Turnout | 76.24 | ||||
| Labour hold | Swing | ||||
Elections in the 1910s
| Party | Candidate | Votes | % | ± | |
|---|---|---|---|---|---|
| Labour | James O'Grady | 4,028 | 68.0 | −2.0 | |
| Conservative | W.H. Clarke | 1,892 | 32.0 | +2.0 | |
| Majority | 2,136 | 36.0 | −4.0 | ||
| Turnout | 5,920 | 62.9 | −18.6 | ||
| Registered electors | 9,419 | ||||
| Labour hold | Swing | −2.0 | |||
| Party | Candidate | Votes | % | ± | |
|---|---|---|---|---|---|
| Labour | James O'Grady | 5,373 | 70.0 | +3.9 | |
| Conservative | W.H. Clarke | 2,308 | 30.0 | −3.9 | |
| Majority | 3,065 | 40.0 | +7.8 | ||
| Turnout | 7,681 | 81.5 | +12.9 | ||
| Registered electors | 9,419 | ||||
| Labour hold | Swing | +3.9 | |||
Elections in the 1900s
| Party | Candidate | Votes | % | ± | |
|---|---|---|---|---|---|
| Labour Repr. Cmte. | James O'Grady | 4,299 | 66.1 | +46.0 | |
| Conservative | Henry Cautley | 2,208 | 33.9 | −20.8 | |
| Majority | 2,091 | 32.2 | N/A | ||
| Turnout | 6,507 | 68.6 | +1.1 | ||
| Registered electors | 9,490 | ||||
| Labour Repr. Cmte. gain from Conservative | Swing | +33.4 | |||
| Party | Candidate | Votes | % | ± | |
|---|---|---|---|---|---|
| Conservative | Henry Cautley | 3,453 | 54.7 | +9.8 | |
| Liberal | J. R. Maguire | 1,586 | 25.2 | −29.9 | |
| Labour Repr. Cmte. | William Pollard Byles | 1,266 | 20.1 | N/A | |
| Majority | 1,867 | 29.5 | N/A | ||
| Turnout | 6,305 | 67.5 | −9.9 | ||
| Registered electors | 9,336 | ||||
| Conservative gain from Liberal | Swing | +19.9 | |||
Elections in the 1890s
| Party | Candidate | Votes | % | ± | |
|---|---|---|---|---|---|
| Liberal | Thomas Leuty | 3,857 | 55.1 | −0.6 | |
| Conservative | John Danvers Power[19] | 3,147 | 44.9 | +0.6 | |
| Majority | 710 | 10.2 | −1.2 | ||
| Turnout | 7,004 | 77.4 | −1.7 | ||
| Registered electors | 9,044 | ||||
| Liberal hold | Swing | −0.6 | |||
| Party | Candidate | Votes | % | ± | |
|---|---|---|---|---|---|
| Liberal | Thomas Leuty | 3,999 | 58.2 | +2.5 | |
| Conservative | John Danvers Power[19] | 2,868 | 41.8 | −2.5 | |
| Majority | 1,131 | 16.4 | +5.0 | ||
| Turnout | 6,867 | 75.9 | −3.2 | ||
| Registered electors | 9,044 | ||||
| Liberal hold | Swing | +2.5 | |||
| Party | Candidate | Votes | % | ± | |
|---|---|---|---|---|---|
| Liberal | John Lawrence Gane | 4,024 | 55.7 | −2.5 | |
| Conservative | Arthur Henry Aylmer Morton | 3,197 | 44.3 | +2.5 | |
| Majority | 827 | 11.4 | −5.0 | ||
| Turnout | 7,221 | 79.1 | +2.7 | ||
| Registered electors | 9,134 | ||||
| Liberal hold | Swing | −2.5 | |||
Elections in the 1880s
| Party | Candidate | Votes | % | ± | |
|---|---|---|---|---|---|
| Liberal | John Lawrence Gane | 3,930 | 58.2 | +10.5 | |
| Conservative | Richard Dawson | 2,820 | 41.8 | −10.5 | |
| Majority | 1,110 | 16.4 | N/A | ||
| Turnout | 6,750 | 76.4 | −6.9 | ||
| Registered electors | 8,831 | ||||
| Liberal gain from Conservative | Swing | +10.5 | |||
| Party | Candidate | Votes | % | ± | |
|---|---|---|---|---|---|
| Conservative | Richard Dawson | 3,849 | 52.3 | N/A | |
| Liberal | John Lawrence Gane | 3,504 | 47.7 | N/A | |
| Majority | 345 | 4.6 | N/A | ||
| Turnout | 7,353 | 83.3 | N/A | ||
| Registered electors | 8,831 | ||||
| Conservative win (new seat) | |||||
See also
Notes and references
- Notes
- ↑ A borough constituency (for the purposes of election expenses and type of returning officer)
- ↑ As with all constituencies, the constituency elects one Member of Parliament (MP) by the first past the post system of election at least every five years.
- References
- ↑ "Electorate Figures – Boundary Commission for England". 2011 Electorate Figures. Boundary Commission for England. 4 March 2011. Archived from the original on 6 November 2010. Retrieved 13 March 2011.
- ↑ Keegan, William. "Lord Healey: a chancellor who really knows about coalitions and crisis". The Guardian. Retrieved 13 May 2015.
- 1 2 Leigh Rayment's Historical List of MPs – Constituencies beginning with "L" (part 1)
- ↑ "Statement of Persons Nominated 2017" (PDF). Leeds City Council. Retrieved 12 May 2017.
- ↑ "Election Data 2015". Electoral Calculus. Archived from the original on 17 October 2015. Retrieved 17 October 2015.
- ↑ "Leeds East". BBC News. Retrieved 13 May 2015.
- ↑ "Election Data 2010". Electoral Calculus. Archived from the original on 26 July 2013. Retrieved 17 October 2015.
- ↑ "UK > England > Yorkshire & the Humber > Leeds East". Election 2010. BBC. 7 May 2010. Retrieved 13 May 2010.
- ↑ Events, Alliance for Green Socialism
- ↑ "Election Data 2005". Electoral Calculus. Archived from the original on 15 October 2011. Retrieved 18 October 2015.
- ↑ "Election Data 2001". Electoral Calculus. Archived from the original on 15 October 2011. Retrieved 18 October 2015.
- ↑ "Election Data 1997". Electoral Calculus. Archived from the original on 15 October 2011. Retrieved 18 October 2015.
- ↑ "Election Data 1992". Electoral Calculus. Archived from the original on 15 October 2011. Retrieved 18 October 2015.
- ↑ "Politics Resources". Election 1992. Politics Resources. 9 April 1992. Retrieved 2010-12-06.
- ↑ "Election Data 1987". Electoral Calculus. Archived from the original on 15 October 2011. Retrieved 18 October 2015.
- ↑ "Election Data 1983". Electoral Calculus. Archived from the original on 15 October 2011. Retrieved 18 October 2015.
- ↑ United Kingdom Parliamentary Election results 1983–97: English Boroughs part 1
- 1 2 3 4 5 6 7 8 9 Craig, FWS, ed. (1974). British Parliamentary Election Results: 1885-1918. London: Macmillan Press. ISBN 9781349022984.
- 1 2 "Mr Balfour on the Union of the Unionist Party". Huddersfield Chronicle. 27 Apr 1895. p. 8. Retrieved 23 November 2017.
| Parliament of the United Kingdom | ||
|---|---|---|
| Preceded by Altrincham and Sale |
Constituency represented by the Chancellor of the Exchequer 1974–1979 |
Succeeded by Surrey East |