West Bromwich East (UK Parliament constituency)
| West Bromwich East | |
|---|---|
|
Borough constituency for the House of Commons | |
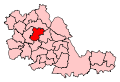 Boundary of West Bromwich East in West Midlands. | |
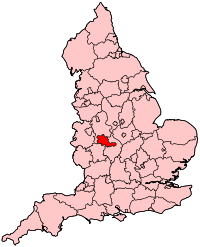 Location of West Midlands within England. | |
| County | West Midlands |
| Electorate | 63,008 (December 2010)[1] |
| Current constituency | |
| Created | 1974 |
| Member of parliament | Tom Watson (Labour) |
| Number of members | One |
| Created from | West Bromwich |
| Overlaps | |
| European Parliament constituency | West Midlands |
West Bromwich East is a constituency[n 1] represented in the House of Commons of the UK Parliament since 2001 by Tom Watson, a member of the Labour Party.[n 2]
Members of Parliament
| Election | Member[2] | Party | |
|---|---|---|---|
| Feb 1974 | Peter Snape | Labour | |
| 2001 | Tom Watson | Labour | |
Constituency profile
West Bromwich itself is the main town, which has West Bromwich Albion F.C. and a historic centre, with a programme of investment in 21st century apartments as with nearby Birmingham. Since the recessions of the 1970s and early 1980s, West Bromwich East has suffered from high unemployment, and as a result of the current recession which began in 2008 unemployment peaked at 14.3%. Only Birmingham, Ladywood nearby had higher unemployment rates in all of Britain.[3]
Workless claimants who were registered jobseekers were in November 2012 higher than the national average of 3.8%, at 7.6% of the population based on a statistical compilation by The Guardian, however this was lower than in West Bromwich West with 8.1% of its constituents of working age in receipt of this benefit, which is seen as the lower gauge of the breadth of unemployment.[4]
Boundaries
West Bromwich East is one of four constituencies covering the Metropolitan Borough of Sandwell, covering the east and north-east of the borough. It includes most of the town of West Bromwich and the part of Great Barr that is in Sandwell.
2010–present: The Metropolitan Borough of Sandwell wards of Charlemont with Grove Vale, Friar Park, Great Barr with Yew Tree, Greets Green and Lyng, Hateley Heath, Newton, and West Bromwich Central.
1997–2010: The Metropolitan Borough of Sandwell wards of Charlemont, Friar Park, Great Barr, Greets Green and Lyng, Hateley Heath, Newton, and West Bromwich Central.
1983–1997: The Metropolitan Borough of Sandwell wards of Charlemont, Friar Park, Great Barr, Hateley Heath, Newton, and West Bromwich Central.
1974–1983: The County Borough of West Bromwich wards of Charlemont, Friar Park, Great Barr, Hateley Heath, Newton, Sandwell, and Tantany.
The seat formerly shared some wards with West Bromwich West: before 2010 instead placed in the latter seat were a small minority of 1,697 electors in the west of the wards of Friar Park and Greets Green and Lyng, also a negligible portion of Wednesbury South was contained in West Bromwich East.[n 3][5]
History
The constituency was formed in 1974 and took its present wards in 1997 (small parts of which remained shared until 2010, see above).
- Political history
Since its formation the constituency has only elected Labour MPs. Most recent electoral results present a safe seat for the Labour Party, who won the seat with large majorities in the 1990s and 2000s, although this was not the case in the 1980s when the Conservative Party came close to winning the seat. Labour's lowest majority was 298 (0.71%) in 1983.
Elections
Elections in the 2010s
| Party | Candidate | Votes | % | ± | |
|---|---|---|---|---|---|
| Labour | Tom Watson | 22,664 | 58.0 | ||
| Conservative | Emma Crane | 14,951 | 38.2 | ||
| Liberal Democrat | Karen Trench | 625 | 1.6 | ||
| Green | John Macefield | 533 | 1.4 | ||
| Independent | Colin Rankine | 325 | 0.8 | ||
| Majority | 7,713 | 19.8 | |||
| Turnout | 39,098 | 61.3 | |||
| Labour hold | Swing | ||||
| Party | Candidate | Votes | % | ± | |
|---|---|---|---|---|---|
| Labour | Tom Watson | 18,817 | 50.2 | ||
| Conservative | Olivia Seccombe | 9,347 | 24.9 | ||
| UKIP | Steve Latham | 7,949 | 21.2 | ||
| Liberal Democrat | Flo Clucas | 751 | 2.0 | ||
| Green | Barry Lim | 628 | 1.7 | ||
| Majority | 9,470 | 25.3 | |||
| Turnout | 37,492 | 58.9 | |||
| Labour hold | Swing | ||||
| Party | Candidate | Votes | % | ± | |
|---|---|---|---|---|---|
| Labour | Tom Watson | 17,657 | 46.5 | ||
| Conservative | Alistair Thompson | 10,961 | 28.9 | ||
| Liberal Democrat | Ian Garrett | 4,993 | 13.2 | ||
| BNP | Terry Lewin | 2,205 | 5.8 | ||
| English Democrat | Mark Cowles | 1,150 | 3.0 | ||
| UKIP | Steve Grey | 984 | 2.6 | ||
| Majority | 6,696 | 17.6 | |||
| Turnout | 37,950 | 60.4 | |||
| Labour hold | Swing | ||||
Elections in the 2000s
| Party | Candidate | Votes | % | ± | |
|---|---|---|---|---|---|
| Labour | Tom Watson | 19,741 | 55.6 | ||
| Conservative | Rosemary Bromwich | 8,089 | 22.8 | ||
| Liberal Democrat | Ian Garrett | 4,386 | 12.4 | ||
| BNP | Carl Butler | 2,329 | 6.6 | ||
| UKIP | Steven Grey | 607 | 1.7 | ||
| Socialist Labour | Judith Sambrook | 200 | 0.6 | ||
| Independent | Margaret Macklin | 160 | 0.5 | ||
| Majority | 11,652 | 32.8 | |||
| Turnout | 35,512 | 58.6 | |||
| Labour hold | Swing | ||||
| Party | Candidate | Votes | % | ± | |
|---|---|---|---|---|---|
| Labour | Tom Watson | 18,250 | 55.9 | ||
| Conservative | David McFarlane | 8,487 | 26.0 | ||
| Liberal Democrat | Ian Garrett | 4,507 | 13.8 | ||
| UKIP | Steven Gray | 835 | 2.6 | ||
| Socialist Labour | Satbir Johal | 585 | 1.8 | ||
| Majority | 9,763 | 29.9 | |||
| Turnout | 32,664 | 53.4 | |||
| Labour hold | Swing | ||||
Elections in the 1990s
| Party | Candidate | Votes | % | ± | |
|---|---|---|---|---|---|
| Labour | Peter Snape | 23,710 | 57.2 | ||
| Conservative | Brian Matsell | 10,126 | 22.4 | ||
| Liberal Democrat | Martyn Smith | 6,179 | 14.9 | ||
| Referendum | Graham Mulley | 1,472 | 3.5 | ||
| Majority | 13,584 | 32.7 | |||
| Turnout | 41,487 | 65.4 | |||
| Labour hold | Swing | ||||
| Party | Candidate | Votes | % | ± | |
|---|---|---|---|---|---|
| Labour | Peter Snape | 19,913 | 46.2 | ||
| Conservative | Crispin Blunt | 17,100 | 39.7 | ||
| Liberal Democrat | Martyn Smith | 5,630 | 13.1 | ||
| National Front | John Lord | 477 | 1.1 | ||
| Majority | 2,813 | 6.5 | |||
| Turnout | 43,120 | 75.7 | |||
| Labour hold | Swing | ||||
Elections in the 1980s
| Party | Candidate | Votes | % | ± | |
|---|---|---|---|---|---|
| Labour | Peter Snape | 18,162 | 42.6 | ||
| Conservative | Roger Woodhouse | 17,179 | 40.3 | ||
| Liberal | Martyn Smith | 7,268 | 17.1 | ||
| Majority | 983 | 2.3 | |||
| Turnout | 73.2 | ||||
| Labour hold | Swing | ||||
| Party | Candidate | Votes | % | ± | |
|---|---|---|---|---|---|
| Labour | Peter Snape | 15,894 | 38.1 | ||
| Conservative | C Cole | 15,596 | 37.4 | ||
| Liberal | Martyn G Smith | 10,200 | 24.5 | ||
| Majority | 298 | 0.7 | |||
| Turnout | 70.2 | ||||
| Labour hold | Swing | ||||
Elections in the 1970s
| Party | Candidate | Votes | % | ± | |
|---|---|---|---|---|---|
| Labour | Peter Snape | 19,279 | 47.0 | ||
| Conservative | J Wright | 17,308 | 42.2 | ||
| Liberal | Martyn G Smith | 3,228 | 7.9 | ||
| National Front | C Allsopp | 1,175 | 2.9 | ||
| Majority | 1,971 | 4.8 | |||
| Turnout | 71.1 | ||||
| Labour hold | Swing | ||||
| Party | Candidate | Votes | % | ± | |
|---|---|---|---|---|---|
| Labour | Peter Snape | 19,942 | 50.5 | ||
| Conservative | David Mellor | 12,413 | 31.4 | ||
| Liberal | JPT Hunt | 5,442 | 13.8 | ||
| National Front | G Bowen | 1,692 | 4.3 | ||
| Majority | 7,529 | 19.1 | |||
| Turnout | 67.6 | ||||
| Labour hold | Swing | ||||
| Party | Candidate | Votes | % | ± | |
|---|---|---|---|---|---|
| Labour | Peter Snape | 21,895 | 52.8 | ||
| Conservative | DW Bell | 16,686 | 40.2 | ||
| National Front | Martin Webster | 2,907 | 7.0 | ||
| Majority | 5,209 | 12.6 | |||
| Turnout | 71.9 | ||||
| Labour hold | Swing | ||||
See also
Notes and references
- Notes
- ↑ A borough constituency (for the purposes of election expenses and type of returning officer)
- ↑ As with all constituencies, the constituency elects one Member of Parliament (MP) by the first past the post system of election at least every five years.
- ↑ Consisting of 48 electors at the time of reassessment.
- References
- ↑ "Electorate Figures – Boundary Commission for England". 2011 Electorate Figures. Boundary Commission for England. 4 March 2011. Retrieved 13 March 2011.
- ↑ Leigh Rayment's Historical List of MPs – Constituencies beginning with "W" (part 2)
- ↑
- ↑ Unemployment claimants by constituency The Guardian
- ↑ 2010 post-revision map Greater London and metropolitan areas of England
- ↑ "Statement of Persons nominated 2017". Sandwell Borough Council. Retrieved 13 May 2017.
- ↑ "Election Data 2015". Electoral Calculus. Archived from the original on 17 October 2015. Retrieved 17 October 2015.
- ↑ "Election Data 2010". Electoral Calculus. Archived from the original on 17 October 2015. Retrieved 17 October 2015.
- ↑ "Election Data 2005". Electoral Calculus. Archived from the original on 15 October 2011. Retrieved 18 October 2015.
- ↑ "Election Data 2001". Electoral Calculus. Archived from the original on 15 October 2011. Retrieved 18 October 2015.
- ↑ "Election Data 1997". Electoral Calculus. Archived from the original on 15 October 2011. Retrieved 18 October 2015.
- ↑ "Election Data 1992". Electoral Calculus. Archived from the original on 15 October 2011. Retrieved 18 October 2015.
- ↑ "Election Data 1987". Electoral Calculus. Archived from the original on 15 October 2011. Retrieved 18 October 2015.
- ↑ "Election Data 1983". Electoral Calculus. Archived from the original on 15 October 2011. Retrieved 18 October 2015.