Mid Derbyshire (UK Parliament constituency)
| Mid Derbyshire | |
|---|---|
|
County constituency for the House of Commons | |
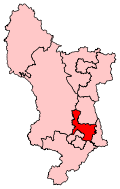 Boundary of Mid Derbyshire in Derbyshire for the 2010 general election. | |
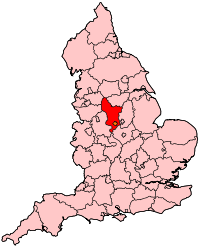 Location of Derbyshire within England. | |
| County | Derbyshire |
| Electorate | 66,855 (2015 Election)[1] |
| Major settlements |
Belper, Borrowash, Duffield, West Hallam in Derby: Allestree, Oakwood and Spondon |
| Current constituency | |
| Created | 2010 |
| Member of parliament | Pauline Latham OBE (Conservative Party) |
| Created from | Amber Valley |
| 1885–1918 | |
| Type of constituency | County constituency |
| Replaced by | Belper |
| Created from | South Derbyshire |
| Overlaps | |
| European Parliament constituency | East Midlands |
Mid Derbyshire is a constituency[n 1] represented in the House of Commons of the UK Parliament since its 2010 creation by Pauline Latham, a Conservative.[n 2]
Boundaries
Following their review of parliamentary representation, the Boundary Commission for England created this seat. Neighbouring constituencies have had consequential boundary changes, with Erewash and Amber Valley two of the most affected.
The constituency is made up of the following electoral wards:
- Belper Central; Belper East; Belper North; Belper South; Duffield, part of the borough of Amber Valley
- Allestree, Oakwood and Spondon, part of the City of Derby
- Little Eaton and Breadsall; Ockbrook and Borrowash; Stanley; West Hallam and Dale Abbey, part of the borough of Erewash
Members of Parliament
MPs 1885–1918
| Election | Member[2] | Party | |
|---|---|---|---|
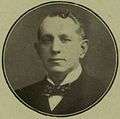
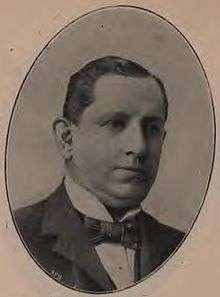
| 1885 | Sir James Alfred Jacoby | Liberal | |
| 1909 | John Hancock | Labour | |
| 1915 | Liberal | ||
| 1918 | constituency abolished | ||
MPs since 2010
| Election | Member[2] | Party | |
|---|---|---|---|
| 2010 | Pauline Latham | Conservative | |
Elections
Elections in the 2010s
| Party | Candidate | Votes | % | ± | |
|---|---|---|---|---|---|
| Conservative | Pauline Latham | 29,513 | 58.6 | +6.4 | |
| Labour | Alison Martin | 17,897 | 35.5 | +10.1 | |
| Liberal Democrat | Adam Wain | 1,793 | 3.6 | −1.2 | |
| Green | Sue MacFarlane | 1,168 | 2.3 | −1.7 | |
| Majority | 11,616 | 23.0 | −3.8 | ||
| Turnout | 50,461 [4] | 74.6 | +4.0 | ||
| Conservative hold | Swing | -1.35 | |||
| Party | Candidate | Votes | % | ± | |
|---|---|---|---|---|---|
| Conservative | Pauline Latham | 24,908 | 52.2 | +3.9 | |
| Labour | Nicola Heaton | 12,134 | 25.4 | +1.0 | |
| UKIP | Martin Fitzpatrick | 6,497 | 13.6 | +11 | |
| Liberal Democrat | Hilary Jones[6] | 2,292 | 4.8 | -15.7 | |
| Green | Sue MacFarlane[7] | 1,898 | 4.0 | +4.0 | |
| Majority | 12,774 | 26.8 | +2.9 | ||
| Turnout | 47,729 | 70.6 | -0.8 | ||
| Conservative hold | Swing | +1.45 | |||
| Party | Candidate | Votes | % | ± | |
|---|---|---|---|---|---|
| Conservative | Pauline Latham | 22,877 | 48.3 | +1.1 | |
| Labour | Hardyal Dhindsa | 11,585 | 24.5 | −10.2 | |
| Liberal Democrat | Sally McIntosh | 9,711 | 20.5 | +4.5 | |
| BNP | Lewis Allsebrook | 1,698 | 3.6 | N/A | |
| UKIP | Anthony Kay | 1,252 | 2.6 | +0.5 | |
| Monster Raving Loony | R.U.Seerius | 219 | 0.5 | N/A | |
| Majority | 11,292 | 23.9 | +11.4 | ||
| Turnout | 47,342 | 71.4 | +4.9 | ||
| Conservative hold | Swing | +5.65 | |||
Elections in the 1910s
General Election 1914/15:
Another General Election was required to take place before the end of 1915. The political parties had been making preparations for an election to take place and by July 1914, the following candidates had been selected;
- Liberal: John Hancock
- Unionist:
| Party | Candidate | Votes | % | ± | |
|---|---|---|---|---|---|
| Labour | John Hancock | 6,557 | 60.5 | -3.4 | |
| Conservative | David Rhys | 4,287 | 39.5 | +3.4 | |
| Majority | 2,270 | 21.0 | -6.8 | ||
| Turnout | 79.4 | -7.2 | |||
| Labour hold | Swing | -3.4 | |||
| Party | Candidate | Votes | % | ± | |
|---|---|---|---|---|---|
| Labour | John Hancock | 7,557 | 63.9 | +3.4 | |
| Conservative | Francis Francis | 4,268 | 36.1 | -3.4 | |
| Majority | 3,289 | 27.8 | +6.8 | ||
| Turnout | 86.6 | +2.6 | |||
| Labour hold | Swing | +3.4 | |||
Elections in the 1900s
| Party | Candidate | Votes | % | ± | |
|---|---|---|---|---|---|
| Lib-Lab | John Hancock | 6,735 | 60.5 | −6.5 | |
| Conservative | Samuel Cresswell | 4,392 | 39.5 | +6.5 | |
| Majority | 2,343 | 21.0 | −13.0 | ||
| Turnout | 11,127 | 84.0 | +1.4 | ||
| Registered electors | 13,244 | ||||
| Lib-Lab hold | Swing | +6.5 | |||
- Hancock, who was sponsored by the Derbyshire Miners Association was chosen by the local Liberal Association as their candidate. During the campaign he agreed that he would sign the Labour Party constitution, so some records describe him as the Labour party candidate.
Jacoby
| Party | Candidate | Votes | % | ± | |
|---|---|---|---|---|---|
| Liberal | James Alfred Jacoby | 7,065 | 67.0 | +10.5 | |
| Conservative | Samuel Cresswell | 3,475 | 33.0 | -10.5 | |
| Majority | 3,590 | 34.0 | +21.0 | ||
| Turnout | 10,540 | 82.6 | -0.4 | ||
| Registered electors | 12,757 | ||||
| Liberal hold | Swing | +10.5 | |||
| Party | Candidate | Votes | % | ± | |
|---|---|---|---|---|---|
| Liberal | James Alfred Jacoby | 5,323 | 56.5 | +3.4 | |
| Conservative | Henry St John Digby Raikes | 4,094 | 43.5 | −3.4 | |
| Majority | 1,229 | 13.0 | +6.8 | ||
| Turnout | 9,417 | 83.0 | -5.5 | ||
| Registered electors | 11,347 | ||||
| Liberal hold | Swing | +3.4 | |||
Elections in the 1890s
Jacoby
| Party | Candidate | Votes | % | ± | |
|---|---|---|---|---|---|
| Liberal | James Alfred Jacoby | 4,926 | 53.1 | -2.5 | |
| Conservative | William Bridgeman | 4,351 | 46.9 | +2.5 | |
| Majority | 575 | 6.2 | -5.0 | ||
| Turnout | 9,277 | 88.5 | +9.1 | ||
| Registered electors | 10,479 | ||||
| Liberal hold | Swing | -2.5 | |||
| Party | Candidate | Votes | % | ± | |
|---|---|---|---|---|---|
| Liberal | James Alfred Jacoby | 4,899 | 55.6 | +0.4 | |
| Conservative | John Satterfield Sanders | 3,907 | 44.4 | -0.4 | |
| Majority | 992 | 11.2 | +0.8 | ||
| Turnout | 8,806 | 79.4 | -7.1 | ||
| Registered electors | 11,089 | ||||
| Liberal hold | Swing | +0.4 | |||
Elections in the 1880s
| Party | Candidate | Votes | % | ± | |
|---|---|---|---|---|---|
| Liberal | James Alfred Jacoby | 4,569 | 55.2 | -8.8 | |
| Liberal Unionist | Charles Seely | 3,706 | 44.8 | +8.8 | |
| Majority | 863 | 10.4 | -17.6 | ||
| Turnout | 8,275 | 86.5 | -2.5 | ||
| Registered electors | 9,571 | ||||
| Liberal hold | Swing | -8.8 | |||
| Party | Candidate | Votes | % | ± | |
|---|---|---|---|---|---|
| Liberal | James Alfred Jacoby | 5,447 | 64.0 | N/A | |
| Conservative | John Burton Barrow | 3,067 | 36.0 | N/A | |
| Majority | 2,380 | 28.0 | N/A | ||
| Turnout | 8,514 | 89.0 | N/A | ||
| Registered electors | 9,571 | ||||
| Liberal win (new seat) | |||||
See also
Notes and references
- Notes
- ↑ A county constituency (for the purposes of election expenses and type of returning officer)
- ↑ As with all constituencies, the constituency elects one Member of Parliament (MP) by the first past the post system of election at least every five years.
- References
- ↑ "Archived copy". Archived from the original on 2015-04-06. Retrieved 2015-05-08. >
- 1 2 Leigh Rayment's Historical List of MPs – Constituencies beginning with "D" (part 1)
- ↑ https://www.bbc.co.uk/news/politics/constituencies/E14000814
- ↑ https://news.derby.gov.uk/full-general-election-2017-results/
- ↑ "Election Data 2015". Electoral Calculus. Archived from the original on 17 October 2015. Retrieved 17 October 2015.
- ↑ http://www.derbytelegraph.co.uk/Derby-Liberal-Democrat-leader-Hilary-Jones-stand/story-20859309-detail/story.html/</
- ↑ "Archived copy". Archived from the original on 2015-02-04. Retrieved 2015-02-04.
- ↑ "Election Data 2010". Electoral Calculus. Archived from the original on 26 July 2013. Retrieved 17 October 2015.
- 1 2 3 4 5 6 7 8 9 British Parliamentary Election Results 1885-1918, FWS Craig
- ↑ Debrett's House of Commons & Judicial Bench, 1916
- ↑ Debrett's House of Commons & Judicial Bench, 1916
- 1 2 3 4 5 6 The Liberal Year Book, 1907
- ↑ Debrett's House of Commons & Judicial Bench, 1901
- ↑ Debrett's House of Commons & Judicial Bench, 1901
- ↑ Debrett's House of Commons & Judicial Bench, 1896
- ↑ Debrett's House of Commons & Judicial Bench, 1886
This article is issued from
Wikipedia.
The text is licensed under Creative Commons - Attribution - Sharealike.
Additional terms may apply for the media files.