Eddisbury (UK Parliament constituency)
| Eddisbury | |
|---|---|
|
County constituency for the House of Commons | |
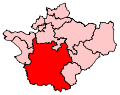 Boundary of Eddisbury in Cheshire. | |
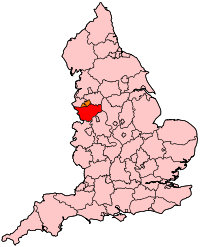 Location of Cheshire within England. | |
| County | Cheshire |
| Electorate | 65,914 (December 2010)[1] |
| Major settlements | Winsford, Tarvin, Audlem, Kelsall, Malpas and Tarporley |
| Current constituency | |
| Created | 1983 |
| Member of parliament | Antoinette Sandbach (Conservative) |
| Number of members | One |
| Created from | Northwich, Nantwich and Runcorn[2] |
| 1885–1950 | |
| Number of members | One |
| Type of constituency | County constituency |
| Replaced by | Crewe, Northwich, Knutsford and Runcorn |
| Created from | South Cheshire |
| Overlaps | |
| European Parliament constituency | North West England |
Eddisbury is a constituency[n 1] in Cheshire represented in the House of Commons of the UK Parliament since 2015 by Antoinette Sandbach, a Conservative.[n 2]
Boundaries
1885–1918: The Municipal Borough of the City of Chester, the Sessional Division of Broxton, and parts of the Sessional Divisions of Chester Castle, Eddisbury, Nantwich, and Northwich.
1918–1950: The Urban District of Tarporley, the Rural Districts of Malpas and Tarvin, in the Rural District of Northwich the civil parishes of Crowton, Cuddington, Darnhall, Delamere, Eddisbury, Little Budworth, Marton, Oakmere, and Wimboldsley, in the Rural District of Runcorn the civil parishes of Alvanley, Frodsham, Frodsham Lordship, Helsby, Kingsley, Kingswood, Mauley, Newton-by-Frodsham, and Norley, and part of the Rural District of Nantwich.
1983–1997: The District of Vale Royal wards of Church, Cuddington and Marton, Davenham and Moulton, Forest, Frodsham East, Frodsham North West, Frodsham South, Gorst Wood, Gravel, Hartford, Helsby Central, Helsby North, Helsby South and Alvanley Ward, Kingsley, Mara, Milton, Oulton, Over One, Over Two, Swanlow, Tarporley, Vale Royal, Weaver, and Wharton, and the City of Chester wards of Barrow, Farndon, Malpas, Tarvin, Tattenhall, Tilston, and Waverton.
1997–2010: The District of Vale Royal wards of Cuddington and Marton, Davenham and Moulton, Gravel, Mara, Oulton, Over One, Over Two, Swanlow, Tarporley, Vale Royal, and Wharton, the Borough of Crewe and Nantwich wards of Acton, Audlem, Bunbury, Combermere, Minshull, Peckforton, and Wrenbury, and the City of Chester wards of Barrow, Farndon, Malpas, Tarvin, Tattenhall, Tilston, and Waverton.
2010–present: The Borough of Vale Royal wards of Cuddington and Oakmere, Davenham and Moulton, Mara, Tarporley and Oulton, Winsford Dene, Winsford Gravel, Winsford Over, Winsford Swanlow, Winsford Verdin, and Winsford Wharton, the Borough of Crewe and Nantwich wards of Acton, Audlem, Bunbury, Minshull, Peckforton, and Wrenbury, and the City of Chester wards of Barrow, Farndon, Kelsall, Malpas, Tarvin, Tattenhall, Tilston, and Waverton.
The constituency is mostly rural, covering the south-west of Cheshire, noted in minerals for salt mining and within easy access to the cities of Liverpool, Manchester and the industrial and manufacturing centres of the Wirral Peninsula and Deeside. To the east of the seat lies part of Delamere Forest. The main town in the constituency is Winsford; other main settlements include Tarvin, Audlem, Kelsall, Malpas and Tarporley.
History
The constituency was re-established in 1983, largely replacing the former Nantwich constituency and is named for the former hundred of Eddisbury. Since then, it has always been held by a Conservative. Between 1983 and 1999, it was represented by Alastair Goodlad, who resigned upon being appointed the United Kingdom's High Commissioner to Australia. The ensuing by-election was won by Stephen O'Brien, who held the seat until 2015.
The closest the Labour Party has come to winning the seat was in the 1997 general election, when the Conservative majority was reduced to just 1,185. Eddisbury consists of mainly rural villages and small towns which are favourable to the Conservative party; Labour's only strength is in the constituency's largest town, Winsford, which currently has the seat's only local councillors. Labour fell from second to third place in the 2010 general election—the Conservative candidate held the seat with a majority of over 13,000 and a Liberal Democrat moved into second place. The 2015 election saw Labour move back into second place, and the Conservative majority fell by 1.8%.
Members of Parliament
MPs 1885–1950
| Election | Member[3] | Party | |
|---|---|---|---|
| 1885 | Henry James Tollemache | Conservative | |
| 1906 | Arthur Stanley | Liberal | |
| 1910 | Harry Barnston | Conservative | |
| 1929 | Richard John Russell | Liberal | |
| 1931 | National Liberal | ||
| 1943 by-election | John Loverseed | Common Wealth | |
| 1944 | Independent | ||
| 1945 | Labour | ||
| 1945 | Sir John Barlow | National Liberal | |
| 1950 | constituency abolished | ||
MPs since 1983
| Election | Member[3] | Party | |
|---|---|---|---|
| 1983 | Sir Alastair Goodlad | Conservative | |
| 1999 by-election | Stephen O'Brien | Conservative | |
| 2015 | Antoinette Sandbach | Conservative | |
Elections
Elections in the 2010s
June 2017
| Party | Candidate | Votes | % | ± | |
|---|---|---|---|---|---|
| Conservative | Antoinette Sandbach | 29,192 | 56.9 | +5.8 | |
| Labour | Cathy Reynolds | 17,250 | 33.6 | +10.0 | |
| Liberal Democrat | Ian Priestner | 2,804 | 5.5 | -3.6 | |
| UKIP | John Bickley | 1,109 | 2.2 | -10.0 | |
| Green | Mark Green | 785 | 1.5 | -1.9 | |
| Pirate | Morgan Hill | 179 | 0.3 | +0.3 | |
| Majority | 11,942 | 23.2 | -4.2 | ||
| Turnout | 51,319 | 73.15 | +4.15 | ||
| Conservative hold | Swing | -2.1 | |||
May 2015
| Party | Candidate | Votes | % | ± | |
|---|---|---|---|---|---|
| Conservative | Antoinette Sandbach | 24,167 | 51.0 | −0.6 | |
| Labour | James Laing | 11,193 | 23.6 | +2.1 | |
| UKIP | Rob Millington | 5,778 | 12.2 | +8.0 | |
| Liberal Democrat | Ian Priestner | 4,289 | 9.1 | −13.4 | |
| Green | Andrew Garman | 1,624 | 3.4 | N/A | |
| CISTA | George Antar | 301 | 0.6 | N/A | |
| Majority | 12,974 | 27.4 | |||
| Turnout | 47,352 | 69.0 | |||
| Conservative hold | Swing | −1.4 | |||
May 2010
| Party | Candidate | Votes | % | ± | |
|---|---|---|---|---|---|
| Conservative | Stephen O'Brien | 23,472 | 51.7 | +4.8 | |
| Liberal Democrat | Bob Thompson | 10,217 | 22.5 | +4.5 | |
| Labour | Pat Merrick | 9,794 | 21.6 | −10.5 | |
| UKIP | Charles Dodman | 1,931 | 4.3 | +1.3 | |
| Majority | 13,255 | 29.2 | |||
| Turnout | 45,414 | 69.5 | |||
| Conservative hold | Swing | +0.2 | |||
Elections in the 2000s
| Party | Candidate | Votes | % | ± | |
|---|---|---|---|---|---|
| Conservative | Stephen O'Brien | 21,181 | 46.4 | +0.1 | |
| Labour | Mark Green | 14,986 | 32.8 | −3.2 | |
| Liberal Democrat | Joanne Crotty | 8,182 | 17.9 | +2.2 | |
| UKIP | Steve Roxborough | 1,325 | 2.9 | +0.9 | |
| Majority | 6,195 | 13.6 | |||
| Turnout | 45,674 | 63.2 | −1.0 | ||
| Conservative hold | Swing | +1.6 | |||
| Party | Candidate | Votes | % | ± | |
|---|---|---|---|---|---|
| Conservative | Stephen O'Brien | 20,556 | 46.3 | +3.8 | |
| Labour | George Eyres | 15,988 | 36.0 | −4.1 | |
| Liberal Democrat | Paul Roberts | 6,975 | 15.7 | +2.5 | |
| UKIP | David Carson | 868 | 2.0 | N/A | |
| Majority | 4,568 | 10.3 | |||
| Turnout | 44,387 | 64.2 | −11.5 | ||
| Conservative hold | Swing | ||||
Elections in the 1990s
| Party | Candidate | Votes | % | ± | |
|---|---|---|---|---|---|
| Conservative | Stephen O'Brien | 15,465 | 44.8 | +2.3 | |
| Labour | Margaret R. Hanson | 13,859 | 40.2 | +0.1 | |
| Liberal Democrat | Paul D. Roberts | 4,757 | 13.8 | +0.6 | |
| Monster Raving Loony | Alan Hope | 238 | 0.7 | N/A | |
| Independent Conservative | Robert J. Everest | 98 | 0.3 | N/A | |
| Natural Law | Dinah Grice | 80 | 0.2 | N/A | |
| Majority | 1,606 | 4.7 | |||
| Turnout | 34,497 | 51.4 | −24.4 | ||
| Conservative hold | Swing | ||||
| Party | Candidate | Votes | % | ± | |
|---|---|---|---|---|---|
| Conservative | Alastair Goodlad | 21,027 | 42.5 | −8.5 | |
| Labour | Margaret R. Hanson | 19,842 | 40.1 | +9.6 | |
| Liberal Democrat | David Reaper | 6,540 | 13.2 | −3.8 | |
| Referendum | Norine D. Napier | 2,041 | 4.2 | N/A | |
| Majority | 1,185 | 2.4 | |||
| Turnout | 49,450 | 75.8 | |||
| Conservative hold | Swing | −9.1 | |||
| Party | Candidate | Votes | % | ± | |
|---|---|---|---|---|---|
| Conservative | Alastair Goodlad | 31,625 | 51.0 | −0.1 | |
| Labour | Norma M. Edwards | 18,928 | 30.5 | +7.0 | |
| Liberal Democrat | Derrick W. Lyon | 10,543 | 17.0 | −6.6 | |
| Green | Andrew Basden | 783 | 1.3 | −0.4 | |
| Natural Law | Nigel P.J. Pollard | 107 | 0.2 | N/A | |
| Majority | 12,697 | 20.5 | −7.0 | ||
| Turnout | 61,986 | 82.6 | +4.5 | ||
| Conservative hold | Swing | −3.5 | |||
Elections in the 1980s
| Party | Candidate | Votes | % | ± | |
|---|---|---|---|---|---|
| Conservative | Alastair Goodlad | 29,474 | 51.1 | −2.4 | |
| Liberal | Roderick Fletcher | 13,639 | 23.7 | −1.8 | |
| Labour | Catriona Grigg | 13,574 | 23.5 | +2.5 | |
| Green | Andrew Basden | 976 | 1.7 | N/A | |
| Majority | 15,835 | 27.5 | |||
| Turnout | 57,663 | 78.0 | |||
| Conservative hold | Swing | −0.3 | |||
| Party | Candidate | Votes | % | ± | |
|---|---|---|---|---|---|
| Conservative | Alastair Goodlad | 28,407 | 53.5 | N/A | |
| Liberal | Roderick Fletcher | 13,561 | 25.5 | N/A | |
| Labour | David Hanson | 11,169 | 21.0 | N/A | |
| Majority | 14,846 | 28.0 | N/A | ||
| Turnout | 53,137 | 74.8 | N/A | ||
| Conservative win (new seat) | |||||
Elections in the 1940s
| Party | Candidate | Votes | % | ± | |
|---|---|---|---|---|---|
| Liberal National | John Barlow | 15,294 | 57.7 | +16.7 | |
| Labour | John Loverseed | 7,392 | 27.9 | −15.8 | |
| Liberal | Dunstan Michael Carr Curtis | 3,808 | 14.4 | −0.9 | |
| Majority | 7,902 | 29.8 | |||
| Turnout | 26,494 | 75.2 | 32.5 | ||
| Liberal National gain from Common Wealth | Swing | +16.2 | |||
| Party | Candidate | Votes | % | ± | |
|---|---|---|---|---|---|
| Common Wealth | John Loverseed | 8,023 | 43.7 | n/a | |
| Liberal National | Thomas Peacock | 7,537 | 41.0 | n/a | |
| Independent Liberal | Harold Heathcote Williams | 2,803 | 15.3 | n/a | |
| Majority | 486 | 2.7 | n/a | ||
| Turnout | 18,363 | 56.1 | n/a | ||
| Common Wealth gain from Liberal National | Swing | n/a | |||
General Election 1939/40:
Another general election was required to take place before the end of 1940. The political parties had been making preparations for an election to take place from 1939 and by the end of this year, the following candidates had been selected;
- Liberal National: Richard Russell
- Liberal: William Gretton Ward
Elections in the 1930s
| Party | Candidate | Votes | % | ± | |
|---|---|---|---|---|---|
| Liberal National | Richard Russell | unopposed | n/a | n/a | |
| Liberal National hold | Swing | n/a | |||
| Party | Candidate | Votes | % | ± | |
|---|---|---|---|---|---|
| Liberal National | Richard Russell | unopposed | n/a | n/a | |
| Liberal National hold | Swing | n/a | |||
Elections in the 1920s
| Party | Candidate | Votes | % | ± | |
|---|---|---|---|---|---|
| Liberal | Richard Russell | 13,688 | 51.6 | +5.7 | |
| Unionist | Roderick George Fenwick-Palmer | 12,862 | 48.4 | −5.7 | |
| Majority | 826 | 3.2 | N/A | ||
| Turnout | 26,550 | 86.8 | −0.1 | ||
| Registered electors | 30,593 | ||||
| Liberal gain from Unionist | Swing | +5.7 | |||
| Party | Candidate | Votes | % | ± | |
|---|---|---|---|---|---|
| Liberal | Richard Russell | 10,223 | 53.4 | +7.5 | |
| Unionist | Roderick George Fenwick-Palmer | 8,931 | 46.6 | −7.5 | |
| Majority | 1,292 | 6.8 | N/A | ||
| Turnout | 19,154 | 80.6 | −6.3 | ||
| Registered electors | 23,760 | ||||
| Liberal gain from Unionist | Swing | +7.5 | |||
| Party | Candidate | Votes | % | ± | |
|---|---|---|---|---|---|
| Unionist | Harry Barnston | 11,006 | 54.1 | +3.5 | |
| Liberal | Richard Russell | 9,337 | 45.9 | −3.5 | |
| Majority | 1,669 | 8.2 | +7.0 | ||
| Turnout | 20,343 | 86.9 | +10.5 | ||
| Registered electors | 23,409 | ||||
| Unionist hold | Swing | +3.5 | |||
| Party | Candidate | Votes | % | ± | |
|---|---|---|---|---|---|
| Unionist | Harry Barnston | 8,716 | 50.6 | N/A | |
| Liberal | Richard Russell | 8,520 | 49.4 | N/A | |
| Majority | 196 | 1.2 | N/A | ||
| Turnout | 17,236 | 76.4 | N/A | ||
| Registered electors | 22,547 | ||||
| Unionist hold | Swing | N/A | |||
| Party | Candidate | Votes | % | ± | |
|---|---|---|---|---|---|
| Unionist | Harry Barnston | Unopposed | |||
| Unionist hold | |||||
| Party | Candidate | Votes | % | ± | |
|---|---|---|---|---|---|
| C | Unionist | Harry Barnston | Unopposed | ||
| Unionist hold | |||||
| C indicates candidate endorsed by the coalition government. | |||||
Election results 1885–1918
Elections in the 1880s

| Party | Candidate | Votes | % | ± | |
|---|---|---|---|---|---|
| Conservative | Henry James Tollemache | 4,285 | 50.7 | N/A | |
| Liberal | Lawrence Irwell | 4,164 | 49.3 | N/A | |
| Majority | 121 | 1.4 | N/A | ||
| Turnout | 8,449 | 81.0 | N/A | ||
| Registered electors | 10,436 | ||||
| Conservative win (new seat) | |||||
| Party | Candidate | Votes | % | ± | |
|---|---|---|---|---|---|
| Conservative | Henry James Tollemache | 4,357 | 54.2 | +3.5 | |
| Liberal | James Tomkinson | 3,678 | 45.8 | -3.5 | |
| Majority | 679 | 8.4 | +7.0 | ||
| Turnout | 8,035 | 77.0 | -4.0 | ||
| Registered electors | 10,436 | ||||
| Conservative hold | Swing | +3.5 | |||
Elections in the 1890s
| Party | Candidate | Votes | % | ± | |
|---|---|---|---|---|---|
| Conservative | Henry James Tollemache | 4,578 | 53.1 | −1.1 | |
| Liberal | James Tomkinson | 4,042 | 46.9 | +1.1 | |
| Majority | 536 | 6.2 | −2.2 | ||
| Turnout | 8,620 | 84.2 | +7.2 | ||
| Registered electors | 10,232 | ||||
| Conservative hold | Swing | −1.1 | |||
| Party | Candidate | Votes | % | ± | |
|---|---|---|---|---|---|
| Conservative | Henry James Tollemache | 5,176 | 60.6 | +7.5 | |
| Liberal | Roger Bate | 3,371 | 39.4 | -7.5 | |
| Majority | 1,805 | 21.2 | +15.0 | ||
| Turnout | 8,547 | 83.3 | -0.9 | ||
| Registered electors | 10,262 | ||||
| Conservative hold | Swing | +7.5 | |||
Elections in the 1900s
| Party | Candidate | Votes | % | ± | |
|---|---|---|---|---|---|
| Conservative | Henry James Tollemache | Unopposed | |||
| Conservative hold | |||||
| Party | Candidate | Votes | % | ± | |
|---|---|---|---|---|---|
| Liberal | Arthur Stanley | 5,315 | 55.9 | N/A | |
| Conservative | Edward Cotton-Jodrell | 4,192 | 44.1 | N/A | |
| Majority | 1,123 | 11.8 | N/A | ||
| Turnout | 9,507 | 86.5 | N/A | ||
| Registered electors | 10,988 | ||||
| Liberal gain from Conservative | Swing | N/A | |||
Elections in the 1910s
| Party | Candidate | Votes | % | ± | |
|---|---|---|---|---|---|
| Conservative | Harry Barnston | 5,664 | 53.2 | +9.1 | |
| Liberal | Arthur Stanley | 4,976 | 46.8 | -9.1 | |
| Majority | 688 | 6.4 | N/A | ||
| Turnout | 10,640 | 92.6 | +6.1 | ||
| Registered electors | 11,488 | ||||
| Conservative gain from Liberal | Swing | +9.1 | |||
| Party | Candidate | Votes | % | ± | |
|---|---|---|---|---|---|
| Conservative | Harry Barnston | 5,312 | 51.4 | −1.8 | |
| Liberal | Arthur Stanley | 5,023 | 48.6 | +1.8 | |
| Majority | 289 | 2.8 | −3.6 | ||
| Turnout | 10,335 | 90.0 | −2.6 | ||
| Registered electors | 11,488 | ||||
| Conservative hold | Swing | −1.8 | |||
General Election 1914/15:
Another General Election was required to take place before the end of 1915. The political parties had been making preparations for an election to take place and by the July 1914, the following candidates had been selected;
- Unionist: Harry Barnston
- Liberal: Hayward
| Party | Candidate | Votes | % | ± | |
|---|---|---|---|---|---|
| C | Unionist | Harry Barnston | Unopposed | ||
| Unionist hold | |||||
| C indicates candidate endorsed by the coalition government. | |||||
See also
Notes and references
- Notes
- ↑ A county constituency (for the purposes of election expenses and type of returning officer)
- ↑ As with all constituencies, the constituency elects one Member of Parliament (MP) by the first past the post system of election at least every five years.
- References
Craig, F. W. S. (1983). British parliamentary election results 1918–1949 (3 ed.). Chichester: Parliamentary Research Services. ISBN 0-900178-06-X.
- ↑ "Electorate Figures – Boundary Commission for England". 2011 Electorate Figures. Boundary Commission for England. 4 March 2011. Archived from the original on 6 November 2010. Retrieved 13 March 2011.
- ↑ "'Eddisbury', June 1983 up to May 1997". ElectionWeb Project. Cognitive Computing Limited. Archived from the original on 12 March 2016. Retrieved 11 March 2016.
- 1 2 Leigh Rayment's Historical List of MPs – Constituencies beginning with "E" (part 1)
- ↑ "Eddisbury parliamentary constituency". BBC News.
- ↑ "Election Data 2015". Electoral Calculus. Archived from the original on 17 October 2015. Retrieved 17 October 2015.
- ↑ "Eddisbury". BBC News. Retrieved 11 May 2015.
- ↑ "Election Data 2010". Electoral Calculus. Archived from the original on 26 July 2013. Retrieved 17 October 2015.
- ↑ Boundary change information . Results from BBC Website
- ↑ "Election Data 2005". Electoral Calculus. Archived from the original on 15 October 2011. Retrieved 18 October 2015.
- ↑ "Election Data 2001". Electoral Calculus. Archived from the original on 15 October 2011. Retrieved 18 October 2015.
- ↑ "Election Data 1997". Electoral Calculus. Archived from the original on 15 October 2011. Retrieved 18 October 2015.
- ↑ "Election Data 1992". Electoral Calculus. Archived from the original on 15 October 2011. Retrieved 18 October 2015.
- ↑ "UK General Election results April 1992". Richard Kimber's Political Science Resources. Politics Resources. 9 April 1992. Retrieved 2010-12-06.
- ↑ "Election Data 1987". Electoral Calculus. Archived from the original on 15 October 2011. Retrieved 18 October 2015.
- ↑ "Election Data 1983". Electoral Calculus. Archived from the original on 15 October 2011. Retrieved 18 October 2015.
- 1 2 3 4 5 6 7 F W S Craig, British Parliamentary Election Results 1918–1949; Political Reference Publications, Glasgow 1949
- ↑ British Parliamentary Election Results 1885–1918, FWS Craig
- 1 2 3 4 5 6 The Liberal Year Book, 1907
- ↑ Debrett's House of Commons & Judicial Bench, 1886
- 1 2 Debrett's House of Commons & Judicial Bench, 1901
- ↑ Craig, FWS, ed. (1974). British Parliamentary Election Results: 1885-1918. London: Macmillan Press. ISBN 9781349022984.
- ↑ Debrett's House of Commons & Judicial Bench, 1916
- ↑ Debrett's House of Commons & Judicial Bench, 1916