United Kingdom general election, 1959
|
| |||||||||||||||||||||||||||||||||||||||||||||
| |||||||||||||||||||||||||||||||||||||||||||||
All 630 seats in the House of Commons 316 seats needed for a majority | |||||||||||||||||||||||||||||||||||||||||||||
|---|---|---|---|---|---|---|---|---|---|---|---|---|---|---|---|---|---|---|---|---|---|---|---|---|---|---|---|---|---|---|---|---|---|---|---|---|---|---|---|---|---|---|---|---|---|
| Opinion polls | |||||||||||||||||||||||||||||||||||||||||||||
| Turnout |
78.7%, | ||||||||||||||||||||||||||||||||||||||||||||
| |||||||||||||||||||||||||||||||||||||||||||||
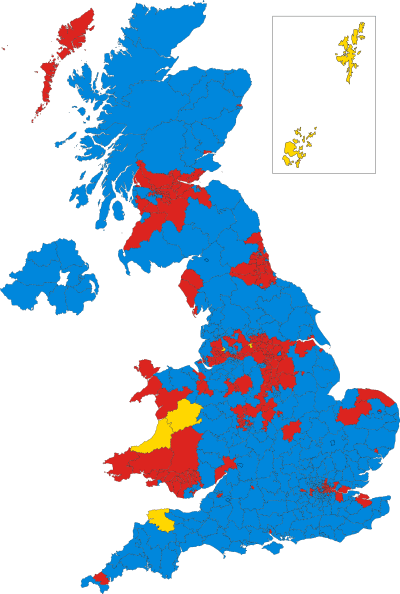 Colours denote the winning party—as shown in § Results | |||||||||||||||||||||||||||||||||||||||||||||
| |||||||||||||||||||||||||||||||||||||||||||||
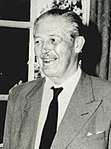
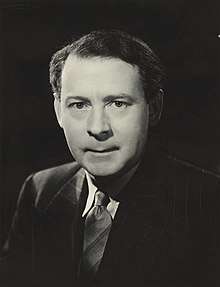
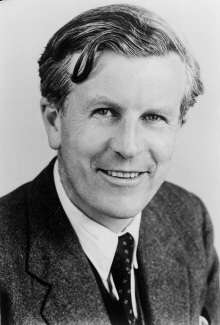
The 1959 United Kingdom general election was held on Thursday, 8 October 1959. It marked a third consecutive victory for the ruling Conservative Party, now led by Harold Macmillan. For the second time in a row, the Conservatives increased their overall majority in Parliament, to 101 seats over the Labour Party led by Hugh Gaitskell. The Liberal Party led by Jo Grimond again returned only six MPs to the House of Commons, but managed to increase their overall share of the vote to 5.9%; compared to just 2.7% four years earlier. To date, the 1959 general election marks the only occasion since the Second World War when a government has managed to increase it's overall majority whilst seeking a third term in government. However, despite this electoral success; the Conservatives failed to win the most seats in Scotland, and have not done so since. This election marks the beginning of Labour's domination of Scottish seats at Westminster, which lasted until the rise of the Scottish National Party at the 2015 general election. Both future Liberal leader Jeremy Thorpe and future Conservative Party leader and eventual Prime Minister Margaret Thatcher first entered the House of Commons at this election.
Background
After the Suez Crisis in 1956, Anthony Eden, the Conservative Prime Minister, became unpopular. He resigned early in 1957, and was succeeded by Chancellor of the Exchequer Harold Macmillan. At that point, the Labour Party, whose leader Hugh Gaitskell had succeeded Clement Attlee after the 1955 general election, enjoyed large leads in opinion polls over the Conservative Party, and it looked as if Labour could win.[1]
The Liberal Party also had a new leader, Jo Grimond, so all three parties contested the election with a new leader at the helm.[1]
However, the Conservatives enjoyed an upturn in fortunes as the economy improved under Macmillan's leadership, and his personal approval ratings remained high. By September 1958, the Conservatives had moved ahead of Labour in the opinion polls.[1]
Campaign
All the three main parties had changed leadership since the previous election. The Conservatives fought under the slogan "Life is better with the Conservatives, don't let Labour ruin it" and were boosted by a pre-election economic boom. Macmillan very effectively "summed up" the mood of the British public when he said that most of the people had "never had it so good". Macmillan was very popular, and was described as a politician of the centre ground; in the 1930s he had represented a constituency in northern England (Stockton-on-Tees), which had experienced large-scale unemployment and poverty. The first week of polling put the Conservatives ahead of Labour by over 5%, but this narrowed as the campaign continued. The Labour Party fought a generally effective campaign, with television broadcasts masterminded by Tony Benn under the umbrella of their manifesto entitled Britain Belongs to You, which accused the Conservatives of complacency over the growing gap between rich and poor.[2] Hugh Gaitskell made a mistake in declaring that a Labour government would not raise taxes if it came to power—even though the Labour manifesto contained pledges to increase spending; especially to increase pensions. This led voters to doubt Labour's spending plans, and is usually cited as a key reason for their defeat.[1]
Results
Early on election night it became clear that the Conservative Party had been returned to government with an increased majority. However, there were swings to Labour in parts of north-west England, and in Scotland; where Labour had overtaken the Conservatives as the largest single party in terms of seats. The Labour domination of Scottish seats would last for another 56 years, until the rise of the Scottish National Party (SNP) in the wake of the 2014 Scottish independence referendum; which left Labour with just a single seat in Parliament after the 2015 general election. For the fourth general election in a row, the Conservatives increased their number of seats, despite experiencing a slight decrease in their share of the vote. For Labour, the result was disappointing; despite appearing more united than they had in recent years under Gaitskell's leadership, the party suffered a third consecutive defeat. Future Prime Minister Margaret Thatcher was elected to the House of Commons for the first time as the MP for Finchley. Future Liberal Party leader Jeremy Thorpe was also elected to Parliament for the first time, as the MP North Devon.
The Daily Mirror, despite being a staunch supporter of the Labour Party, wished Macmillan "good luck" on it's front page following his election victory.
The BBC's election coverage, presented by Richard Dimbleby, was shown on BBC Parliament on 9 October 2009 to mark the fiftieth anniversary of the election.
| 365 | 258 | 6 | 1 |
| Conservative | Labour | Lib | O |
| Candidates | Votes | ||||||||||
|---|---|---|---|---|---|---|---|---|---|---|---|
| Party | Leader | Stood | Elected | Gained | Unseated | Net | % of total | % | No. | Net % | |
| Conservative | Harold Macmillan | 625 | 365 | 28 | 8 | +20 | 57.9 | 49.4 | 13,750,875 | ||
| Labour | Hugh Gaitskell | 621 | 258 | 9 | 28 | −19 | 41.0 | 43.8 | 12,216,172 | ||
| Liberal | Jo Grimond | 216 | 6 | 1 | 1 | 0 | 1.0 | 5.9 | 1,640,760 | ||
| Plaid Cymru | Gwynfor Evans | 20 | 0 | 0 | 0 | 0 | 0.3 | 77,571 | |||
| Sinn Féin | Paddy McLogan | 12 | 0 | 0 | 2 | −2 | 0.2 | 63,415 | |||
| Communist | John Gollan | 18 | 0 | 0 | 0 | 0 | 0.1 | 30,896 | |||
| SNP | Jimmy Halliday | 5 | 0 | 0 | 0 | 0 | 0.1 | 21,738 | |||
| Ind. Labour Group | Frank Hanna | 1 | 0 | 0 | 0 | 0 | 0.1 | 20,062 | |||
| Ind. Conservative | N/A | 2 | 1 | 1 | 0 | +1 | 0.2 | 0.1 | 14,118 | ||
| Independent | N/A | 5 | 0 | 0 | 0 | 0 | 0.0 | 7,492 | |||
| Fife Socialist League | Lawrence Daly | 1 | 0 | 0 | 0 | 0 | 0.0 | 4,886 | |||
| Independent Liberal | N/A | 2 | 0 | 0 | 0 | 0 | 0.0 | 4,473 | |||
| Union Movement | Oswald Mosley | 1 | 0 | 0 | 0 | 0 | 0.0 | 2,821 | |||
| Lancastrian | Tom Emmott | 1 | 0 | 0 | 0 | 0 | 0.0 | 1,889 | |||
| National Labour | John Bean | 1 | 0 | 0 | 0 | 0 | 0.0 | 1,685 | |||
| Fellowship | Ronald Mallone | 1 | 0 | 0 | 0 | 0 | 0.0 | 1,189 | |||
| Ind. Labour Party | Fred Morel | 2 | 0 | 0 | 0 | 0 | 0.0 | 923 | |||
| Socialist (GB) | N/A | 1 | 0 | 0 | 0 | 0 | 0.0 | 899 | |||
| Alert Party | George Forrester | 1 | 0 | 0 | 0 | 0 | 0.0 | 788 | |||
| Government's new majority | 100 |
| Total votes cast | 27,862,652 |
| Turnout | 78.7% |
Votes summary
Seat summary
Transfers of seats
- All comparisons are with the 1955 election.
- In some cases the change is due to the MP defecting to the gaining party. Such circumstances are marked with a *.
- In other circumstances the change is due to the seat having been won by the gaining party in a by-election in the intervening years, and then retained in 1959. Such circumstances are marked with a †.
- 1 Sinn Féin winner in 1955 overturned on petition. The second-placed Ulster Unionist candidate was also overturned, by resolution of the House; eventually the 1956 by-election was held, which returned an Independent Unionist. This candidate later defected to the Ulster Unionists.
- 2 Sinn Féin winner in 1955 overturned on petition for criminal conviction. The second-placed candidate, an Ulster Unionist, was awarded the seat. He retained it in 1959.
- 3 Seat had been won by the Liberals in a 1958 by-election.
See also
Notes
- ↑ Conservatives include the National Liberal Party, Scottish Unionist Party and Ulster Unionists.
References
- 1 2 3 4 "8 October 1959", BBC Politics 97, retrieved 20 May 2013
- ↑ 1959: Macmillan wins Tory hat trick, BBC News, 5 April 2005, retrieved 20 May 2018
Sources
- Butler, David E.; Rose, R. (1960), The British General Election of 1959, London: Macmillan, the standard scholarly study
- Craig, F. W. S. (1989), British Electoral Facts: 1832–1987, Dartmouth: Gower, ISBN 0900178302
- Thorpe, Andrew (2001), A History of the British Labour Party, Palgrave, ISBN 0-333-92908-X
External links
Manifestos
- The Next Five Years, 1959 Conservative Party manifesto
- Britain Belongs to You: The Labour Party's Policy for Consideration by the British People, 1959 Labour Party manifesto
- People Count, 1959 Liberal Party manifesto
| General elections |
|
|---|---|
| Local elections |
|
| European elections | |
| Referendums | |