Wokingham (UK Parliament constituency)
| Wokingham | |
|---|---|
|
County constituency for the House of Commons | |
|
Boundary of Wokingham in Berkshire. | |
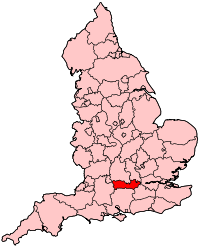 Location of Berkshire within England. | |
| County | Berkshire |
| Electorate | 75,886 (December 2010)[1] |
| Current constituency | |
| Created | 1950 |
| Member of parliament | John Redwood (Conservative) |
| Number of members | One |
| Created from | Newbury and Windsor |
| 1885–1918 | |
| Type of constituency | County constituency |
| Replaced by | Newbury and Windsor |
| Created from | Berkshire |
| Overlaps | |
| European Parliament constituency | South East England |
Wokingham is a parliamentary constituency represented in the House of Commons of the Parliament of the United Kingdom. It elects one Member of Parliament (MP) by the first past the post system of election.
Boundaries
1885–1918: The Sessional Divisions of Maidenhead and Windsor, part of the Sessional Division of Wokingham, and in the Sessional Division of Reading the parishes of East Swallowfield and West Swallowfield.
1950–1955: The Municipal Borough of Wokingham, and the Rural Districts of Easthampstead and Wokingham.
1955–1974: The Municipal Borough of Wokingham, the Rural Districts of Easthampstead and Wokingham, and the County Borough of Reading ward of Park.
1974–1983: The Municipal Borough of Wokingham, the Rural District of Easthampstead, and in the Rural District of Wokingham the parishes of Remenham, Ruscombe, St Nicholas Hurst, Twyford, Wargrave, and Wokingham Without.
1983–1997: The District of Wokingham wards of Bulmershe, California, Charvil, Coronation, Emmbrook, Evendons, Hurst, Little Hungerford, Loddon, Norreys, Redhatch, Remenham and Wargrave, St Sebastian's, Sonning, South Lake, Twyford and Ruscombe, Wescott, Whitegates, and Winnersh.
1997–2010: The District of Wokingham wards of Arborfield, Barkham, Emmbrook, Evendons, Little Hungerford, Norreys, Redhatch, Shinfield, Swallowfield, Wescott, and Winnersh, and the District of Newbury wards of Burghfield and Mortimer.
2010–present: The District of Wokingham wards of Arborfield, Barkham, Emmbrook, Evendons, Hawkedon, Hillside, Maiden Erlegh, Norreys, Shinfield North, Shinfield South, Swallowfield, Wescott, and Winnersh, and the District of Newbury wards of Burghfield, Mortimer, and Sulhamstead.
The seat is centred on the southern part of Wokingham district, including a small part of the east of West Berkshire. It is in the South East region of England.
The neighbouring constituencies (clockwise from north) are: Reading West, Reading East, Maidenhead, Bracknell, North East Hampshire, Basingstoke, North West Hampshire and Newbury.
History
The first Wokingham constituency was created in 1885, when the previous three-seat constituency of Berkshire was divided into four single-member constituencies, this one also being described as the 'Eastern division of Berkshire'. The second version of the seat was created in 1950 (Wokingham itself being before then in the Newbury constituency) and has been represented since 1987 by the high-profile Conservative John Redwood.
Members of Parliament
MPs 1885–1918
| Election | Member[2] | Party | |
|---|---|---|---|
| 1885 | Sir George Russell, Bt. | Conservative | |
| 1898 by-election | Oliver Young | Conservative | |
| 1901 by-election | Ernest Gardner | Conservative | |
| 1918 | Constituency abolished | ||
MPs since 1950
| Election | Member[2] | Party | |
|---|---|---|---|
| 1950 | Peter Remnant | Conservative | |
| 1959 | William van Straubenzee | Conservative | |
| 1987 | John Redwood | Conservative | |
Elections
Elections in the 2010s
| Party | Candidate | Votes | % | ± | |
|---|---|---|---|---|---|
| Conservative | John Redwood | 33,806 | 56.6 | -1.1 | |
| Labour | Andy Croy | 15,008 | 25.1 | +10.6 | |
| Liberal Democrat | Clive Jones | 9,512 | 15.9 | +2.4 | |
| Green | Russell Seymour | 1,364 | 2.3 | -1.5 | |
| Majority | 18,798 | 31.5 | -11.7 | ||
| Turnout | 59,690 | 75.1 | +3.2 | ||
| Conservative hold | Swing | -5.85 | |||
| Party | Candidate | Votes | % | ± | |
|---|---|---|---|---|---|
| Conservative | John Redwood | 32,329 | 57.7 | +5.0 | |
| Labour | Andy Croy | 8,132 | 14.5 | +4.4 | |
| Liberal Democrat | Clive Jones | 7,572 | 13.5 | −14.5 | |
| UKIP | Philip Cunnington[6] | 5,516 | 9.9 | +6.8 | |
| Green | Adrian Windisch | 2,092 | 3.7 | +2.7 | |
| Independent | Kaz Lokuciewski | 358 | 0.6 | N/A | |
| Majority | 24,197 | 43.2 | +19.5 | ||
| Turnout | 55,999 | 71.9 | +0.4 | ||
| Conservative hold | Swing | +0.3 | |||
| Party | Candidate | Votes | % | ± | |
|---|---|---|---|---|---|
| Conservative | John Redwood | 28,754 | 52.7 | +4.6 | |
| Liberal Democrat | Prue Bray | 15,262 | 28.0 | −4.7 | |
| Labour | George Davidson | 5,516 | 10.1 | −4.9 | |
| Independent | Mark Ashwell | 2,340 | 4.3 | N/A | |
| UKIP | Ann Zebedee | 1,664 | 3.1 | +0.9 | |
| Green | Marjory Bisset | 567 | 1.0 | N/A | |
| Monster Raving Loony | Peter "Top Cat Bananaman" Owen | 329 | 0.6 | −0.6 | |
| Independent | Robin Smith | 96 | 0.2 | N/A | |
| Majority | 13,492 | 24.7 | +9.0 | ||
| Turnout | 54,528 | 71.5 | +4.4 | ||
| Conservative hold | Swing | +4.7 | |||
Elections in the 2000s
| Party | Candidate | Votes | % | ± | |
|---|---|---|---|---|---|
| Conservative | John Redwood | 22,174 | 48.1 | +2.0 | |
| Liberal Democrat | Prue Bray | 14,934 | 32.4 | 0.0 | |
| Labour | David Black | 6,991 | 15.2 | −2.2 | |
| UKIP | Frank Carstairs | 994 | 2.2 | +0.2 | |
| Monster Raving Loony | Peter "Top Cat Bananaman" Owen | 569 | 1.2 | −0.8 | |
| BNP | Richard Colborne | 376 | 0.8 | N/A | |
| Telepathic Partnership | Michael Hall | 34 | 0.1 | N/A | |
| Majority | 7,240 | 15.7 | +2.0 | ||
| Turnout | 46,072 | 67.1 | +3.0 | ||
| Conservative hold | Swing | +1.0 | |||
| Party | Candidate | Votes | % | ± | |
|---|---|---|---|---|---|
| Conservative | John Redwood | 20,216 | 46.1 | −4.0 | |
| Liberal Democrat | Royce Longton | 14,222 | 32.4 | +1.1 | |
| Labour | Matthew Syed | 7,633 | 17.4 | +0.6 | |
| UKIP | Franklin Carstairs | 897 | 2.0 | N/A | |
| Monster Raving Loony | Peter "Top Cat Bananaman" Owen | 880 | 2.0 | +0.3 | |
| Majority | 5,994 | 13.7 | -5.0 | ||
| Turnout | 43,848 | 64.1 | −11.0 | ||
| Conservative hold | Swing | ||||
Elections in the 1990s
| Party | Candidate | Votes | % | ± | |
|---|---|---|---|---|---|
| Conservative | John Redwood | 25,086 | 50.1 | -11.3 | |
| Liberal Democrat | Royce Longton | 15,721 | 31.4 | +6.3 | |
| Labour | Patricia Colling | 8,424 | 16.8 | +4.3 | |
| Monster Raving Loony | Peter "Top Cat Bananaman" Owen | 877 | 1.8 | +1.1 | |
| Majority | 9,365 | 18.7 | -17.6 | ||
| Turnout | 50,108 | 75.0 | -6.8 | ||
| Conservative hold | Swing | ||||
| Party | Candidate | Votes | % | ± | |
|---|---|---|---|---|---|
| Conservative | John Redwood | 43,497 | 61.4 | +0.0 | |
| Liberal Democrat | Paul G.T. Simon | 17,788 | 25.1 | −4.8 | |
| Labour | Nelson T.G. Bland | 8,846 | 12.5 | +3.8 | |
| Monster Raving Loony | Peter "Top Cat Bananaman" Owen | 531 | 0.7 | N/A | |
| Independent | Philip Harriss | 148 | 0.2 | N/A | |
| Majority | 25,709 | 36.3 | +4.9 | ||
| Turnout | 70,810 | 81.8 | +3.7 | ||
| Conservative hold | Swing | +2.4 | |||
Elections in the 1980s
| Party | Candidate | Votes | % | ± | |
|---|---|---|---|---|---|
| Conservative | John Redwood | 39,808 | 61.4 | +1.0 | |
| Liberal | John Leston | 19,421 | 29.9 | −1.7 | |
| Labour | Peter Morgan | 5,622 | 8.7 | +0.7 | |
| Majority | 20,387 | 31.5 | +2.7 | ||
| Turnout | 64,851 | 78.1 | +2.1 | ||
| Conservative hold | Swing | +0.8 | |||
| Party | Candidate | Votes | % | ± | |
|---|---|---|---|---|---|
| Conservative | William van Straubenzee | 32,925 | 60.4 | +5.96 | |
| Liberal | John Leston | 17,227 | 31.6 | +13.37 | |
| Labour | M. Orton | 4,362 | 8.0 | -18.24 | |
| Majority | 15,698 | 28.8 | +0.6 | ||
| Turnout | 54,514 | 76.0 | -2.22 | ||
| Conservative hold | Swing | -3.71 | |||
Elections in the 1970s
| Party | Candidate | Votes | % | ± | |
|---|---|---|---|---|---|
| Conservative | William van Straubenzee | 36,194 | 54.44 | +11.29 | |
| Labour | AE Furley | 17,448 | 26.24 | -3.06 | |
| Liberal | P Mullarky | 12,120 | 18.23 | -9.32 | |
| National Front | G Sanders | 722 | 1.09 | N/A | |
| Majority | 18,746 | 28.20 | +14.35 | ||
| Turnout | 65,762 | 78.22 | +2.62 | ||
| Conservative hold | Swing | +7.18 | |||
| Party | Candidate | Votes | % | ± | |
|---|---|---|---|---|---|
| Conservative | William van Straubenzee | 24,009 | 43.15 | ||
| Labour | RW Crew | 16,304 | 29.30 | ||
| Liberal | T Blyth | 15,329 | 27.55 | ||
| Majority | 7,705 | 13.85 | |||
| Turnout | 75.60 | ||||
| Conservative hold | Swing | ||||
| Party | Candidate | Votes | % | ± | |
|---|---|---|---|---|---|
| Conservative | William van Straubenzee | 27,223 | 45.16 | ||
| Liberal | SMM Cuff | 16,791 | 27.85 | ||
| Labour | RW Crew | 16,269 | 26.99 | ||
| Majority | 10,432 | 17.31 | |||
| Turnout | 82.84 | ||||
| Conservative hold | Swing | ||||
| Party | Candidate | Votes | % | ± | |
|---|---|---|---|---|---|
| Conservative | William van Straubenzee | 43,183 | 55.00 | ||
| Labour | Christopher AR Helm | 22,630 | 28.82 | ||
| Liberal | Denis HV Case | 12,704 | 16.18 | ||
| Majority | 20,553 | 26,18 | |||
| Turnout | 72.21 | ||||
| Conservative hold | Swing | ||||
Elections in the 1960s
| Party | Candidate | Votes | % | ± | |
|---|---|---|---|---|---|
| Conservative | William van Straubenzee | 34,011 | 47.89 | ||
| Labour | Raymond Carter | 24,437 | 34.41 | ||
| Liberal | Margaret Wingfield | 12,564 | 17.69 | ||
| Majority | 9,574 | 13.48 | |||
| Turnout | 79.23 | ||||
| Conservative hold | Swing | ||||
| Party | Candidate | Votes | % | ± | |
|---|---|---|---|---|---|
| Conservative | William van Straubenzee | 32,777 | 50.23 | ||
| Labour | John Ellis | 17,954 | 27.52 | ||
| Liberal | Margaret Wingfield | 13,875 | 21.26 | ||
| Ind. Conservative | Charles Ford | 645 | 0.99 | ||
| Majority | 14,823 | 22.72 | |||
| Turnout | 79.21 | ||||
| Conservative hold | Swing | ||||
Elections in the 1950s
| Party | Candidate | Votes | % | ± | |
|---|---|---|---|---|---|
| Conservative | William van Straubenzee | 30,896 | 57.53 | ||
| Labour | Terence Boston | 14,905 | 27.76 | ||
| Liberal | Claud William J Rout | 7,899 | 14.71 | ||
| Majority | 15,991 | 29.78 | |||
| Turnout | 79.98 | ||||
| Conservative hold | Swing | ||||
| Party | Candidate | Votes | % | ± | |
|---|---|---|---|---|---|
| Conservative | Peter Remnant | 25,843 | 59.52 | ||
| Labour | Terence Boston | 12,895 | 29.70 | ||
| Liberal | John Patrick McQuade | 4,679 | 10.78 | ||
| Majority | 12,948 | 29.82 | |||
| Turnout | 76.63 | ||||
| Conservative hold | Swing | ||||
| Party | Candidate | Votes | % | ± | |
|---|---|---|---|---|---|
| Conservative | Peter Remnant | 21,652 | 61.01 | ||
| Labour | Eric A Hubble | 10,606 | 29.88 | ||
| Liberal | John Patrick McQuade | 3,233 | 9.11 | ||
| Majority | 11,046 | 31.12 | |||
| Turnout | 78.45 | ||||
| Conservative hold | Swing | ||||
| Party | Candidate | Votes | % | ± | |
|---|---|---|---|---|---|
| Conservative | Peter Remnant | 20,612 | 57.7 | N/A | |
| Labour | Eric A Hubble | 10,296 | 28.8 | N/A | |
| Liberal | John Patrick McQuade | 4,793 | 13.4 | N/A | |
| Majority | 10,316 | 28.9 | N/A | ||
| Turnout | 35,701 | 81.0 | N/A | ||
| Conservative win (new seat) | |||||
Elections in the 1910s
| Party | Candidate | Votes | % | ± | |
|---|---|---|---|---|---|
| Conservative | Ernest Gardner | Unopposed | |||
| Conservative hold | |||||
| Party | Candidate | Votes | % | ± | |
|---|---|---|---|---|---|
| Conservative | Ernest Gardner | 8,132 | 66.5 | +10.4 | |
| Liberal | Holford Knight | 4,095 | 33.5 | −10.4 | |
| Majority | 4,037 | 33.0 | +20.8 | ||
| Turnout | 12,227 | 85.3 | +2.2 | ||
| Registered electors | 14,327 | ||||
| Conservative hold | Swing | +10.4 | |||
Elections in the 1900s
| Party | Candidate | Votes | % | ± | |
|---|---|---|---|---|---|
| Conservative | Ernest Gardner | 6,075 | 56.1 | N/A | |
| Liberal | George Gordon | 4,750 | 43.9 | N/A | |
| Majority | 1,325 | 12.2 | N/A | ||
| Turnout | 10,825 | 83.1 | N/A | ||
| Registered electors | 13,033 | ||||
| Conservative hold | Swing | N/A | |||
| Party | Candidate | Votes | % | ± | |
|---|---|---|---|---|---|
| Conservative | Ernest Gardner | Unopposed | |||
| Conservative hold | |||||
| Party | Candidate | Votes | % | ± | |
|---|---|---|---|---|---|
| Conservative | Oliver Young | Unopposed | |||
| Conservative hold | |||||
Elections in the 1890s
| Party | Candidate | Votes | % | ± | |
|---|---|---|---|---|---|
| Conservative | Oliver Young | 4,726 | 56.2 | N/A | |
| Liberal | George William Palmer | 3,690 | 43.8 | N/A | |
| Majority | 1,036 | 12.4 | N/A | ||
| Turnout | 8,416 | 75.2 | N/A | ||
| Registered electors | 11,189 | ||||
| Conservative hold | Swing | N/A | |||
- Caused by Russell's death.
| Party | Candidate | Votes | % | ± | |
|---|---|---|---|---|---|
| Conservative | George Russell | Unopposed | |||
| Conservative hold | |||||
| Party | Candidate | Votes | % | ± | |
|---|---|---|---|---|---|
| Conservative | George Russell | 4,986 | 64.6 | N/A | |
| Liberal | Frederick Joseph Patton[17] | 2,738 | 35.4 | N/A | |
| Majority | 2,248 | 29.2 | N/A | ||
| Turnout | 7,724 | 76.2 | N/A | ||
| Registered electors | 10,142 | ||||
| Conservative hold | Swing | N/A | |||
Elections in the 1880s
| Party | Candidate | Votes | % | ± | |
|---|---|---|---|---|---|
| Conservative | George Russell | Unopposed | |||
| Conservative hold | |||||
| Party | Candidate | Votes | % | ± | |
|---|---|---|---|---|---|
| Conservative | George Russell | 4,710 | 60.6 | N/A | |
| Liberal | Edwin Lawrence | 3,062 | 39.4 | N/A | |
| Majority | 1,648 | 21.2 | N/A | ||
| Turnout | 7,772 | 83.9 | N/A | ||
| Registered electors | 9,258 | ||||
| Conservative win (new seat) | |||||
See also
Notes and references
- ↑ "Electorate Figures – Boundary Commission for England". 2011 Electorate Figures. Boundary Commission for England. 4 March 2011. Retrieved 13 March 2011.
- 1 2 Leigh Rayment's Historical List of MPs – Constituencies beginning with "W" (part 5)
- ↑ "Statement of Persons Nomiated". Wokingham Borough Council. Retrieved 12 May 2017.
- ↑ "Election Data 2015". Electoral Calculus. Archived from the original on 17 October 2015. Retrieved 17 October 2015.
- ↑ http://www.wokingham.gov.uk/council-and-meetings/elections-and-voting/election-results/?assetdet7653806=363574&categoryesctl7532897=7719
- ↑ "Meet the Wokingham UKIP Prospective Parliamentary Candidate - UK Independence Party". www.wokinghamukip.org.uk.
- ↑ "Election Data 2010". Electoral Calculus. Archived from the original on 26 July 2013. Retrieved 17 October 2015.
- ↑ "BBC News - Election 2010 - Constituency - Wokingham". bbc.co.uk.
- ↑ "Election Data 2005". Electoral Calculus. Archived from the original on 15 October 2011. Retrieved 18 October 2015.
- ↑ "Election Data 2001". Electoral Calculus. Archived from the original on 15 October 2011. Retrieved 18 October 2015.
- ↑ "Election Data 1997". Electoral Calculus. Archived from the original on 15 October 2011. Retrieved 18 October 2015.
- ↑ "Election Data 1992". Electoral Calculus. Archived from the original on 15 October 2011. Retrieved 18 October 2015.
- ↑ "Politics Resources". Election 1992. Politics Resources. 9 April 1992. Retrieved 6 December 2010.
- ↑ "Election Data 1987". Electoral Calculus. Archived from the original on 15 October 2011. Retrieved 18 October 2015.
- ↑ "Election Data 1983". Electoral Calculus. Archived from the original on 15 October 2011. Retrieved 18 October 2015.
- 1 2 3 4 5 6 7 8 9 10 Craig, FWS, ed. (1974). British Parliamentary Election Results: 1885-1918. London: Macmillan Press. ISBN 9781349022984.
- ↑ "Notices: Parliamentary Election, 1892. Eastern or Wokingham Division of the County of Berks". Reading Mercury. 20 Aug 1892. Retrieved 20 November 2017.
- ↑ The Liberal Year Book, 1907
- ↑ Debrett's House of Commons & Judicial Bench, 1886