Thurrock (UK Parliament constituency)
| Thurrock | |
|---|---|
|
Borough constituency for the House of Commons | |
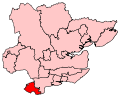 Boundary of Thurrock in Essex. | |
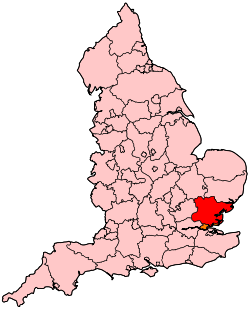 Location of Essex within England. | |
| County | Essex |
| Electorate | 77,667 (December 2010)[1] |
| Major settlements | Grays, Tilbury, South Ockendon and Chafford |
| Current constituency | |
| Created | 1945 |
| Member of parliament | Jackie Doyle-Price (Conservative) |
| Number of members | One |
| Created from | South East Essex |
| Overlaps | |
| European Parliament constituency | East of England |
Thurrock is a constituency[n 1] represented in the House of Commons of the UK Parliament since 2010 by Jackie Doyle-Price, a Conservative.[n 2]
Boundaries

1945-1983: The Urban District of Thurrock.
1983-2010: The Borough of Thurrock wards of Aveley, Belhus, Chadwell St Mary, East Tilbury, Grays Thurrock North, Grays Thurrock Town, Little Thurrock, Ockendon, Stifford, Tilbury, and West Thurrock.
2010–present: The Borough of Thurrock wards of Aveley and Uplands, Belhus, Chadwell St Mary, Chafford and North Stifford, Grays Riverside, Grays Thurrock, Little Thurrock Blackshots, Little Thurrock Rectory, Ockendon, South Chafford, Stifford Clays, Tilbury Riverside and Thurrock Park, Tilbury St Chads, West Thurrock, and South Stifford.
History
- History of boundaries
The loss of the area to the east was of a similar landscape and built environment, except for Canvey Island which demographically has a high retired proportion of its population. Its scant social housing contrasts with its modest incomes and fewer than average large gardens and large houses as is common in coastal communities.
- History of results
Thurrock was for 38 years from and including 1945 a large-majority Labour seat in parliamentary elections. The post-Falklands War election in 1983 gave majority of less than 4% of the vote to a recently-split Labour Party — for which see SDP. A Conservative gained the Thurrock seat in 1987 with a small majority. In 1992 the division was regained by a Labour candidate, namely Andrew MacKinlay, who was during his tenure as MP criticised for his questioning technique used of weapons expert Dr. David Kelly.
In the 2010 general election, a Conservative gained the seat, with Jackie Doyle-Price being elected as the MP with a majority of 92 votes, the third most marginal in that election.[2] The 2015 result gave the seat the 8th most marginal majority of the Conservative Party's 331 seats by percentage of majority.[3]
The seat has bellwether outcome status since 1997.
- Prominent frontbenchers
Dr Oonagh McDonald was Opposition Spokesman on Defence from 1981–1983, and then Opposition Spokesman on Treasury and Economic Affairs from 1983–1987.
Constituency profile
Held by the Conservatives with a majority of just over 300 votes, Thurrock is a marginal seat between the Conservatives and Labour. This industrial Essex seat, east of London, includes the towns of Grays, Tilbury and Purfleet and 18 miles of the north bank of the Thames.
Historically known for quarrying and heavy industry, it is now a retail destination thanks to the Lakeside shopping centre. Retail and distribution are big employers, while Tilbury Power Station has closed and Coryton oil refinery is being redeveloped as a business park. Tilbury is also London's major port, handling millions of tonnes of cargo a year and is a major cruise ship terminal.
Workless claimants, registered jobseekers, were in November 2012 higher than the national average of 3.8%, at 4.8% of the population based on a statistical compilation by The Guardian. The regional average for the Eastern England region was considerably lower, at 3.2% of the population.[4]
Members of Parliament
| Election | Member[5] | Party | Notes | |
|---|---|---|---|---|
| 1945 | Leslie Solley | Labour | ||
| 1949 | Labour Independent Group | |||
| 1950 | Hugh Delargy | Labour | Died May 1976 | |
| 1976 by-election | Oonagh McDonald | Labour | ||
| 1987 | Tim Janman | Conservative | ||
| 1992 | Andrew MacKinlay | Labour | ||
| 2010 | Jackie Doyle-Price | Conservative | ||
Elections
Elections in the 2010s
At the 2015 general election the already-marginal seat became a 3-way ultra-marginal seat. Less than 1,000 votes separated the top three candidates.
In 2017, the Conservatives needed to defend against both UKIP and Labour to hold it. It was number 1 on UKIP's 2017 target list, the party only needed a 0.98% swing to win the seat from third place.[6] The constituency was also at number 7 on Labour's target list, with a 0.54% swing needed for their candidate to win the seat.[7] In the event, the swing to Labour was around 0.2% and the Conservatives held the seat. This marks the third consecutive time Thurrock has been won by a majority of under 1,000 votes, making it the most marginal seat in Essex by a substantial margin (the next most marginal, Rochford and Southend East as of the 2017 general election, has a majority of more than 5,500 votes).
| Party | Candidate | Votes | % | ± | |
|---|---|---|---|---|---|
| Conservative | Jackie Doyle-Price | 19,880 | 39.5 | ||
| Labour | John Kent | 19,535 | 38.8 | ||
| UKIP | Tim Aker | 10,112 | 20.1 | ||
| Liberal Democrat | Kevin McNamara | 798 | 1.6 | ||
| Majority | 345 | 0.7 | |||
| Turnout | 50,325 | 64.4 | |||
| Conservative hold | Swing | -0.2 | |||
| Party | Candidate | Votes | % | ± | |
|---|---|---|---|---|---|
| Conservative | Jackie Doyle-Price | 16,692 | 33.7 | −3.1 | |
| Labour | Polly Billington[11] | 16,156 | 32.6 | −4.0 | |
| UKIP | Tim Aker[12] | 15,718 | 31.7 | +24.3 | |
| Liberal Democrat | Rhodri Jamieson-Ball | 644 | 1.3 | −9.4 | |
| CISTA | Jamie Barnes | 244 | 0.5 | N/A | |
| Independent | Daniel Munyambu | 79 | 0.2 | N/A | |
| All People's Party | Aba Kristilolu | 31 | 0.1 | N/A | |
| Majority | 536 | 1.1 | |||
| Turnout | 49,564 | 63.9 | |||
| Conservative hold | Swing | 0.4 | |||
| Party | Candidate | Votes | % | ± | |
|---|---|---|---|---|---|
| Conservative | Jackie Doyle-Price | 16,869 | 36.8 | +3.6 | |
| Labour | Carl Morris | 16,777 | 36.6 | −9.6 | |
| Liberal Democrat | Carys Davis | 4,901 | 10.7 | −0.4 | |
| BNP | Emma Colgate | 3,618 | 7.9 | +2.1 | |
| UKIP | Clive Broad | 3,390 | 7.4 | +4.0 | |
| Christian Peoples | Arinola Araba | 267 | 0.6 | N/A | |
| Majority | 92 | 0.2 | |||
| Turnout | 45,822 | 59.1 | +4.2 | ||
| Conservative gain from Labour | Swing | +6.6 | |||
Elections in the 2000s
| Party | Candidate | Votes | % | ± | |
|---|---|---|---|---|---|
| Labour | Andrew MacKinlay | 20,636 | 47.2 | −9.3 | |
| Conservative | Garry Hague | 14,261 | 32.6 | +2.8 | |
| Liberal Democrat | Earnshaw Palmer | 4,770 | 10.9 | +0.6 | |
| BNP | Nick Geri | 2,526 | 5.8 | N/A | |
| UKIP | Carol Jackson | 1,499 | 3.4 | 0.0 | |
| Majority | 6,375 | 14.6 | |||
| Turnout | 43,692 | 54.9 | 5.9 | ||
| Labour hold | Swing | −6.1 | |||
| Party | Candidate | Votes | % | ± | |
|---|---|---|---|---|---|
| Labour | Andrew MacKinlay | 21,121 | 56.5 | −6.8 | |
| Conservative | Mike Penning | 11,124 | 29.8 | +3.0 | |
| Liberal Democrat | John Lathan | 3,846 | 10.3 | +2.2 | |
| UKIP | Christopher Sheppard | 1,271 | 3.4 | +1.6 | |
| Majority | 9,997 | 26.7 | |||
| Turnout | 37,362 | 49.0 | −16.7 | ||
| Labour hold | Swing | ||||
Elections in the 1990s
| Party | Candidate | Votes | % | ± | |
|---|---|---|---|---|---|
| Labour | Andrew MacKinlay | 29,896 | 63.3 | +17.8 | |
| Conservative | Andrew Rosindell | 12,640 | 26.8 | −16.9 | |
| Liberal Democrat | Joe White | 3,843 | 8.1 | −1.4 | |
| UKIP | Peter Compobassi | 833 | 1.8 | N/A | |
| Majority | 17,256 | 36.55 | |||
| Turnout | 47,212 | 65.79 | |||
| Labour hold | Swing | +17.2 | |||
| Party | Candidate | Votes | % | ± | |
|---|---|---|---|---|---|
| Labour | Andrew MacKinlay | 24,791 | 45.9 | +4.8 | |
| Conservative | Tim Janman | 23,619 | 43.7 | +1.2 | |
| Liberal Democrat | Alan J. Banton | 5,145 | 9.5 | −7.0 | |
| Pensioners' Party | Charles Rogers | 391 | 0.7 | N/A | |
| Anti-Federalist League | Peter Compobassi | 117 | 0.2 | N/A | |
| Majority | 1,172 | 2.2 | +0.7 | ||
| Turnout | 54,063 | 78.1 | +6.6 | ||
| Labour gain from Conservative | Swing | +1.8 | |||
Elections in the 1980s
| Party | Candidate | Votes | % | ± | |
|---|---|---|---|---|---|
| Conservative | Tim Janman | 20,527 | 42.5 | ||
| Labour | Oonagh McDonald | 19,837 | 41.0 | ||
| Social Democratic | Donald Benson | 7,970 | 16.5 | ||
| Majority | 690 | 1.43 | |||
| Turnout | 48,334 | 71.5 | |||
| Conservative gain from Labour | Swing | ||||
| Party | Candidate | Votes | % | ± | |
|---|---|---|---|---|---|
| Labour | Oonagh McDonald | 17,600 | 39.21 | ||
| Conservative | T Jallon | 15,878 | 35.37 | ||
| Social Democratic | Donald Benson | 9,761 | 21.74 | ||
| Independent | M Bibby | 1,200 | 2.67 | ||
| BNP | R Sinclair | 252 | 0.6 | ||
| Communist | J Paul | 199 | 0.4 | ||
| Majority | 1,722 | 3.8 | |||
| Turnout | 44,891 | 67.7 | |||
| Labour hold | Swing | ||||
Elections in the 1970s
| Party | Candidate | Votes | % | ± | |
|---|---|---|---|---|---|
| Labour | Oonagh McDonald | 33,449 | 48.55 | ||
| Conservative | Tony Baldry | 27,030 | 39.24 | ||
| Liberal | M Crowson | 6,445 | 9.36 | ||
| National Front | E Burdett | 1,358 | 1.97 | ||
| Independent | B Chattaway | 365 | 0.53 | ||
| Workers Revolutionary | M Daly | 242 | 0.35 | ||
| Majority | 6,419 | 9.32 | |||
| Turnout | 68,884 | 75.11 | |||
| Labour hold | Swing | ||||
| Party | Candidate | Votes | % | ± | |
|---|---|---|---|---|---|
| Labour | Oonagh McDonald | 22,191 | 45.27 | -10.30 | |
| Conservative | Percy Lomax | 17,352 | 35.39 | +10.95 | |
| Liberal | Anthony Charlton | 5,977 | 12.19 | -7.80 | |
| National Front | John Roberts | 3,255 | 6.64 | N/A | |
| English National | Frank Hansford-Miller | 187 | 0.38 | N/A | |
| World Grid Sunshine Room Party | Peter Bishop | 72 | 0.15 | N/A | |
| Majority | 4,839 | 9.88 | |||
| Turnout | 49,034 | ||||
| Labour hold | Swing | ||||
| Party | Candidate | Votes | % | ± | |
|---|---|---|---|---|---|
| Labour | Hugh Delargy | 34,066 | 55.57 | ||
| Conservative | P Lomax | 14,986 | 24.44 | ||
| Liberal | A Charlton | 12,255 | 19.99 | ||
| Majority | 19,080 | 31.12 | |||
| Turnout | 68.54 | ||||
| Labour hold | Swing | ||||
| Party | Candidate | Votes | % | ± | |
|---|---|---|---|---|---|
| Labour | Hugh Delargy | 36,217 | 52.15 | ||
| Conservative | Graham Bright | 17,699 | 25.48 | ||
| Liberal | Kaye Fleetwood | 15,534 | 22.37 | ||
| Majority | 18,518 | 26.66 | |||
| Turnout | 78.41 | ||||
| Labour hold | Swing | ||||
| Party | Candidate | Votes | % | ± | |
|---|---|---|---|---|---|
| Labour | Hugh Delargy | 30,874 | 55.75 | ||
| Conservative | Graham Bright | 19,486 | 35.18 | ||
| Liberal | Kaye Fleetwood | 5,024 | 9.07 | ||
| Majority | 11,388 | 20.56 | |||
| Turnout | 55,384 | 65.67 | |||
| Labour hold | Swing | ||||
Elections in the 1960s
| Party | Candidate | Votes | % | ± | |
|---|---|---|---|---|---|
| Labour | Hugh Delargy | 31,998 | 60.67 | ||
| Conservative | Cedric J Hodgson | 14,094 | 26.72 | ||
| Liberal | James C Moran | 6,648 | 12.61 | ||
| Majority | 17,904 | 33.95 | |||
| Turnout | 72.74 | ||||
| Labour hold | Swing | ||||
| Party | Candidate | Votes | % | ± | |
|---|---|---|---|---|---|
| Labour | Hugh Delargy | 30,372 | 57.22 | ||
| Conservative | Robert McCrindle | 14,615 | 27.53 | ||
| Liberal | A Noel H Blackburn | 8,094 | 15.25 | ||
| Majority | 15,757 | 29.68 | |||
| Turnout | 53,081 | 74.22 | |||
| Labour hold | Swing | ||||
Elections in the 1950s
| Party | Candidate | Votes | % | ± | |
|---|---|---|---|---|---|
| Labour | Hugh Delargy | 32,270 | 61.52 | ||
| Conservative | William E McNamara | 20,188 | 38.48 | ||
| Majority | 12,082 | 23.03 | |||
| Turnout | 52,458 | 78.23 | |||
| Labour hold | Swing | ||||
| Party | Candidate | Votes | % | ± | |
|---|---|---|---|---|---|
| Labour | Hugh Delargy | 31,375 | 66.16 | ||
| Conservative | Gerald A Petty | 16,046 | 33.84 | ||
| Majority | 15,329 | 32.33 | |||
| Turnout | 75.24 | ||||
| Labour hold | Swing | ||||
| Party | Candidate | Votes | % | ± | |
|---|---|---|---|---|---|
| Labour | Hugh Delargy | 28,851 | 65.55 | ||
| Conservative | Godfrey Lagden | 15,166 | 34.45 | ||
| Majority | 13,685 | 31.09 | |||
| Turnout | 82.81 | ||||
| Labour hold | Swing | ||||
| Party | Candidate | Votes | % | ± | |
|---|---|---|---|---|---|
| Labour | Hugh Delargy | 22,893 | 52.68 | ||
| Conservative | Airey Neave | 13,306 | 30.62 | ||
| Independent Labour | Leslie Solley | 4,250 | 9.78 | ||
| Liberal | William Harold Henry Siddons | 3,010 | 6.93 | ||
| Majority | 9,587 | 22.06 | |||
| Turnout | 85.28 | ||||
| Labour hold | Swing | ||||
Election in the 1940s
| Party | Candidate | Votes | % | ± | |
|---|---|---|---|---|---|
| Labour | Leslie Solley | 23,171 | 70.05 | ||
| Conservative | T Adam | 9,909 | 29.95 | ||
| Majority | 13,262 | 40.09 | |||
| Turnout | 76.89 | ||||
| Labour hold | Swing | ||||
See also
Notes
- ↑ A county constituency (for the purposes of election expenses and type of returning officer)
- ↑ As with all constituencies, the constituency elects one Member of Parliament (MP) by the first past the post system of election at least every five years.
References
- ↑ "Electorate Figures – Boundary Commission for England". 2011 Electorate Figures. Boundary Commission for England. 4 March 2011. Archived from the original on 6 November 2010. Retrieved 13 March 2011.
- ↑ The 2010 marginality of the result placed the seat immediately behind the majorities of Dan Byles (Con), 54 votes and Michelle Gildernew (SF), 2 votes
- ↑ List of Conservative MPs elected in 2015 by % majority UK Political.info. Retrieved 2017-01-29
- ↑ Unemployment claimants by constituency The Guardian
- ↑ Leigh Rayment's Historical List of MPs – Constituencies beginning with "T" (part 1)
- ↑
- ↑
- ↑ "STATEMENT OF PERSONS NOMINATED, NOTICE OF POLL AND SITUATION OF POLLING STATIONS Election of a Member of Parliament for Thurrock" (PDF). Thurrock Council. Retrieved 15 May 2017.
- ↑ "Election Data 2015". Electoral Calculus. Archived from the original on 17 October 2015. Retrieved 17 October 2015.
- ↑ "Thurrock". bbc.co.uk.
- ↑ "The Labour Party". labour.org.uk. Archived from the original on 5 August 2013.
- ↑ "Tim Aker announced as UKIP candidate for Thurrock". Your Thurrock. Retrieved 2014-02-20.
- ↑ "Election Data 2010". Electoral Calculus. Archived from the original on 26 July 2013. Retrieved 17 October 2015.
- ↑ "BBC NEWS – Election 2010 – Thurrock". BBC News.
- ↑ "Election Data 2005". Electoral Calculus. Archived from the original on 15 October 2011. Retrieved 18 October 2015.
- ↑ "Election Data 2001". Electoral Calculus. Archived from the original on 15 October 2011. Retrieved 18 October 2015.
- ↑ "Election Data 1997". Electoral Calculus. Archived from the original on 15 October 2011. Retrieved 18 October 2015.
- ↑ "Election Data 1992". Electoral Calculus. Archived from the original on 15 October 2011. Retrieved 18 October 2015.
- ↑ "UK General Election results April 1992". Richard Kimber's Political Science Resources. Politics Resources. 9 April 1992. Retrieved 6 December 2010.
- ↑ "Election Data 1987". Electoral Calculus. Archived from the original on 15 October 2011. Retrieved 18 October 2015.
- ↑ "Election Data 1983". Electoral Calculus. Archived from the original on 15 October 2011. Retrieved 18 October 2015.
- ↑ "UK General Election results: June 1983 [Archive]". politicsresources.net.
- ↑ "UK General Election results: May 1979 [Archive]". politicsresources.net.