Twickenham (UK Parliament constituency)
| Twickenham | |
|---|---|
|
Borough constituency for the House of Commons | |
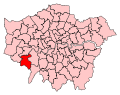 Boundary of Twickenham in Greater London. | |
| County | Greater London |
| Electorate | 79,172 (December 2010)[1] |
| Major settlements | Twickenham, Hampton and Teddington |
| Current constituency | |
| Created | 1918 |
| Member of parliament | Vince Cable (Liberal Democrats) |
| Number of members | One |
| Created from | Brentford |
| Overlaps | |
| European Parliament constituency | London |
Twickenham is a constituency[n 1] represented in the House of Commons of the UK Parliament since 2017 by Sir Vince Cable, the leader of the Liberal Democrats.[n 2]
In the period 2015 to 2017 the seat was represented by a Conservative, as between 1918 and 1997. Since 2017, it has been represented by a Liberal Democrat, as it was from 1997 to 2015. The boundaries of the seat are since 1945 similar to those of the abolished Municipal Borough of Twickenham.
Boundaries
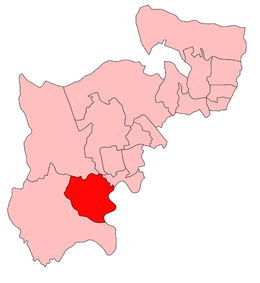

1918-1945: The Urban Districts of Heston and Isleworth, and Twickenham.
1945: boundaries substantially changed - losing territory in the north to form Heston and Isleworth, gaining territory from Spelthorne to the south including Hampton, Teddington, Hampton Wick, Hampton Court Park and Bushy Park
1945-1974: The Municipal Borough of Twickenham.
- Since 1974 formed from similar wards in the London Borough of Richmond upon Thames as follows:
1974-1983: Central Twickenham, East Twickenham, Hampton, Hampton Hill, Hampton Wick, Heathfield, South Twickenham, Teddington, West Twickenham, and Whitton.
1983-1997: Central Twickenham, Hampton, Hampton Hill, Hampton Nursery, Hampton Wick, Heathfield, South Twickenham, Teddington, West Twickenham, and Whitton.
1997-2010: Central Twickenham, East Twickenham, Hampton, Hampton Hill, Hampton Nursery, Hampton Wick, Heathfield, South Twickenham, Teddington, West Twickenham, and Whitton.
2010-present: The London Borough of Richmond upon Thames wards of Fulwell and Hampton Hill, Hampton, Hampton North, Hampton Wick, Heathfield, St Margaret's and North Twickenham, South Twickenham, Teddington, Twickenham Riverside, West Twickenham, and Whitton.
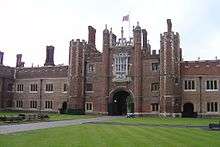
The seat covers the south western half of the London Borough of Richmond, that part of the borough on the north bank of the River Thames.[n 3] It chiefly contains the towns or London districts of Twickenham, Hampton, Teddington and Whitton. Smaller sub-localities by order of commercial activity are Hampton Hill, Hampton Wick, St Margarets, Fulwell, Strawberry Hill and Hampton Court hamlet proper.[n 4] Features includes Hampton Court Palace, Bushy Park (one of the Royal Parks of London), and the Rugby Football Union's national ground, Twickenham Stadium.
History of boundaries
- 1918–1945
During this period the Hamptons (Hampton, Hampton Hill, Hampton Court and Hampton Wick) and Teddington were excluded from the seat, which instead contained two urban districts to the north of subsequent boundaries, Isleworth and Hounslow, an area at the time with key economic sectors of construction, brewing, warehousing and goods transportation. As such these areas had some support for the Labour Party, who in their best result in the seat, lost the 1929 by-election in the seat by 503 votes (1.6% of the vote).
- 1945-date
In 1945, the area saw as an unusual corollary to its shift southwards, the swing nationally, of +11.7% (Con-to-Lab) converted in the more strongly middle-class redefined seat to a major cut in the 24% Conservative majority [n 5] swinging −15.3% to a Liberal opponent, George Granville Slack. In February 1974 and from 1979 until seizing victory in 1997, the runner-up party became the Liberal Party or their successor, the Liberal Democrats and the ward boundaries became only slightly adjusted to reflect changes made in the borderlines made at the local level of government.
History
From 1931 until 1983, Twickenham was a safe seat of the Conservative Party and from 1983 until 1997 a marginal seat for that party.
Liberal Democrat Vince Cable gained the seat during the 1997 landslide Conservative defeat and held it until 2015. The seat was one of very few in Britain that gave the Liberal Democrats a majority of votes in the 2005 and 2010 elections, being their sixth best performance nationally in 2010.[n 6] Cable was Secretary of State for Business from 2010 to 2015, but unexpectedly lost his seat to the Conservative candidate Tania Mathias in the 2015 general election during the nationwide collapse in the Liberal Democrat vote.
Cable regained the seat in the 2017 snap election by a 14.8% majority and an absolute majority at 52.8% of the vote; this was the highest vote percentage for the Liberal Democrats in any constituency nationally.[2]
In recent elections, the seat has had notably high turnouts. At the 2015 general election, Twickenham had the highest turnout in England and the fourth highest in the UK.[3] In 2017, the turnout was 79.7%, the highest of any constituency in the UK.[4]
Constituency profile
As described by the boundaries, the area enjoys substantial parkland and Thameside landscapes, coupled with a variety of commuter train services to Central London including semi-fast services from Twickenham itself to London Waterloo.
Twickenham is the only constituency situated entirely within the London Borough of Richmond upon Thames and, as such, is made up completely of middle-class suburbia, similar to the neighbouring constituencies of Kingston & Surbiton, Richmond Park (both in Greater London) and Esher & Walton in Surrey. Workless claimants, registered jobseekers, were in November 2012 significantly lower in Twickenham than the national average of 3.8%, at 1.7% of the population based on a statistical compilation by The Guardian.[5]
Members of Parliament
| Year | Member | Party | Notes | |
|---|---|---|---|---|
| 1918 | Sir William Joynson-Hicks | Unionist | Home Secretary (1924-1929), Minister of Health (1923-1924) | |
| 1929 by-election | Sir John Ferguson | Unionist | ||
| 1932 by-election | Hylton Murray-Philipson | Conservative | ||
| 1934 by-election | Air Cdre Alfred Critchley | Conservative | ||
| 1935 | Sir Edward Keeling | Conservative | ||
| 1955 by-election | Gresham Cooke | Conservative | Died 22nd Feb 1970 - no by-election held | |
| 1970 | Toby Jessel | Conservative | ||
| 1997 | Dr Vince Cable | Liberal Democrat | Deputy Leader of the Liberal Democrats (2006-2010) Secretary of State for Business, Innovation and Skills & President of the Board of Trade (2010-2015) | |
| 2015 | Tania Mathias | Conservative | ||
| 2017 | Sir Vince Cable | Liberal Democrat | Leader of the Liberal Democrats | |
Election results

Elections in the 2010s
| Party | Candidate | Votes | % | ± | |
|---|---|---|---|---|---|
| Liberal Democrat | Vince Cable | 34,969 | 52.8 | +14.8 | |
| Conservative | Tania Mathias | 25,207 | 38.0 | -3.3 | |
| Labour | Katherine Dunne | 6,114 | 9.2 | -2.3 | |
| Majority | 9,762 | 14.8 | N/A | ||
| Turnout | 66,290 | 79.5 | +2.2 | ||
| Registered electors | 83,362 | ||||
| Liberal Democrat gain from Conservative | Swing | +9.0 | |||
| Party | Candidate | Votes | % | ± | |
|---|---|---|---|---|---|
| Conservative | Tania Mathias | 25,580 | 41.3 | +7.2 | |
| Liberal Democrat | Vince Cable | 23,563 | 38.0 | −16.4 | |
| Labour | Nick Grant | 7,129 | 11.5 | +3.8 | |
| UKIP | Barry Edwards | 3,069 | 4.9 | +3.5 | |
| Green | Tanya Williams | 2,463 | 4.0 | +2.8 | |
| Christian | Dominic Stockford | 174 | 0.3 | N/A | |
| Magna Carta | David Wedgwood | 26 | 0.0 | N/A | |
| Majority | 2,017 | 3.3 | N/A | ||
| Turnout | 62,004 | 77.3 | +2.5 | ||
| Registered electors | 80,250 | ||||
| Conservative gain from Liberal Democrat | Swing | +11.8 | |||
| Party | Candidate | Votes | % | ± | |
|---|---|---|---|---|---|
| Liberal Democrat | Vince Cable | 32,483 | 54.4 | +2.7 | |
| Conservative | Deborah Thomas | 20,343 | 34.1 | +1.7 | |
| Labour | Brian Tomlinson | 4,583 | 7.7 | −3.7 | |
| UKIP | Brian Gilbert | 868 | 1.5 | +0.0 | |
| Green | Stephen Roest | 674 | 1.1 | −1.7 | |
| BNP | Chris Hurst | 654 | 1.1 | N/A | |
| Citizens for Undead Rights and Equality | Harry Cole | 76 | 0.1 | N/A | |
| Magna Carta | Paul Armstrong | 40 | 0.0 | N/A | |
| Majority | 12,140 | 20.3 | +1.0 | ||
| Turnout | 59,721 | 74.8 | +2.4 | ||
| Registered electors | 80,569 | ||||
| Liberal Democrat hold | Swing | +0.5 | |||
Elections in the 2000s
| Party | Candidate | Votes | % | ± | |
|---|---|---|---|---|---|
| Liberal Democrat | Vince Cable | 26,696 | 51.6 | +2.9 | |
| Conservative | Paul Maynard | 16,731 | 32.4 | −1.0 | |
| Labour | Brian Whitington | 5,868 | 11.4 | −2.4 | |
| Green | Henry B. Leveson-Gower | 1,445 | 2.8 | 0.0 | |
| UKIP | Douglas Orchard | 766 | 1.5 | +0.3 | |
| Independent | Brian P. Gibert | 117 | 0.2 | N/A | |
| Rainbow Dream Ticket | George Weiss | 64 | 0.1 | N/A | |
| Majority | 9,965 | 19.3 | +4.0 | ||
| Turnout | 51,687 | 71.8 | +5.4 | ||
| Registered electors | 71,444 | ||||
| Liberal Democrat hold | Swing | +2.0 | |||
| Party | Candidate | Votes | % | ± | |
|---|---|---|---|---|---|
| Liberal Democrat | Vince Cable | 24,344 | 48.7 | +3.6 | |
| Conservative | Nicholas Longworth | 16,689 | 33.4 | −4.3 | |
| Labour | Dean Rogers | 6,903 | 13.8 | −1.8 | |
| Green | Judith Maciejowska | 1,423 | 2.8 | N/A | |
| UKIP | Ray Hollebone | 579 | 1.2 | N/A | |
| Majority | 7,655 | 15.3 | +8.0 | ||
| Turnout | 49,938 | 66.4 | −12.6 | ||
| Registered electors | 72,225 | ||||
| Liberal Democrat hold | Swing | +4.0 | |||
Elections in the 1990s
| Party | Candidate | Votes | % | ± | |
|---|---|---|---|---|---|
| Liberal Democrat | Vince Cable | 26,237 | 45.1 | +5.4 | |
| Conservative | Toby Jessel | 21,956 | 37.8 | −12.6 | |
| Labour | Eva Tutchell | 9,065 | 15.6 | +6.3 | |
| Independent English Conservative and Referendum | Jane Harrison | 589 | 1.0 | N/A | |
| Rainbow Dream Ticket | Terence D. Haggar | 155 | 0.3 | N/A | |
| Natural Law | Anthony J.W. Hardy | 142 | 0.2 | −0.1 | |
| Majority | 4,281 | 7.3 | N/A | ||
| Turnout | 58,144 | 79.3 | -4.9 | ||
| Registered electors | 73,569 | ||||
| Liberal Democrat gain from Conservative | Swing | -8.8 | |||
| Party | Candidate | Votes | % | ± | |
|---|---|---|---|---|---|
| Conservative | Toby Jessel | 26,804 | 50.4 | −1.5 | |
| Liberal Democrat | Vince Cable | 21,093 | 39.7 | +1.4 | |
| Labour | Michael D. Gold | 4,919 | 9.3 | +0.9 | |
| Natural Law | Gary P. Gill | 152 | 0.3 | N/A | |
| Democratic Liberal and Conservatives | D.W. Griffith | 103 | 0.2 | N/A | |
| Liberal | A.J. Miners | 85 | 0.2 | N/A | |
| Majority | 5,711 | 10.7 | −2.8 | ||
| Turnout | 53,156 | 84.2 | +2.7 | ||
| Registered electors | 63,072 | ||||
| Conservative hold | Swing | −1.5 | |||
Elections in the 1980s
| Party | Candidate | Votes | % | ± | |
|---|---|---|---|---|---|
| Conservative | Toby Jessel | 27,331 | 51.9 | +1.5 | |
| Liberal | John Waller | 20,204 | 38.3 | −2.5 | |
| Labour | Valerie Vaz | 4,415 | 8.4 | +0.9 | |
| Green | David Batchelor | 746 | 1.4 | +0.5 | |
| Majority | 7,127 | 13.5 | +3.9 | ||
| Turnout | 52,696 | 81.5 | +3.7 | ||
| Registered electors | 64,661 | ||||
| Conservative hold | Swing | −0.5 | |||
| Party | Candidate | Votes | % | ± | |
|---|---|---|---|---|---|
| Conservative | Toby Jessel | 25,110 | 50.4 | −1.8 | |
| Liberal | John Waller | 20,318 | 40.8 | +10.9 | |
| Labour | P.A. Nicholas | 3,732 | 7.5 | −9.2 | |
| Ecology | John J. Clarke | 424 | 0.9 | N/A | |
| National Front | T.J. Denville-Faulkner | 234 | 0.5 | −0.7 | |
| Independent | R.W. Kenyon | 40 | 0.1 | N/A | |
| Majority | 4,792 | 9.6 | -12.8 | ||
| Turnout | 49,858 | 77.8 | -2.5 | ||
| Registered electors | 64,116 | ||||
| Conservative hold | Swing | +7.0 | |||
Elections in the 1970s
| Party | Candidate | Votes | % | ± | |
|---|---|---|---|---|---|
| Conservative | Toby Jessel | 30,017 | 52.2 | +5.7 | |
| Liberal | John Waller | 17,169 | 29.9 | +5.7 | |
| Labour | David Wetzel | 9,591 | 16.7 | −12.1 | |
| National Front | M. Braithwaite | 686 | 1.2 | N/A | |
| Majority | 12,848 | 22.4 | +4.7 | ||
| Turnout | 57,463 | 80.3 | +5.9 | ||
| Registered electors | 71,535 | ||||
| Conservative hold | Swing | ||||
| Party | Candidate | Votes | % | ± | |
|---|---|---|---|---|---|
| Conservative | Toby Jessel | 24,959 | 46.5 | +0.2 | |
| Labour | M. Cunningham | 15,452 | 28.8 | +2.1 | |
| Liberal | Stephen Kramer | 13,021 | 24.2 | −2.8 | |
| Anti EEC | W. Burgess | 287 | 0.5 | N/A | |
| Majority | 9,507 | 17.7 | -1.6 | ||
| Turnout | 53,719 | 74.4 | -8.7 | ||
| Registered electors | 72,210 | ||||
| Conservative hold | Swing | ||||
| Party | Candidate | Votes | % | ± | |
|---|---|---|---|---|---|
| Conservative | Toby Jessel | 27,595 | 46.3 | -8.1 | |
| Liberal | Stephen Kramer | 16,092 | 27.0 | +14.6 | |
| Labour | Ronald M. Taylor | 15,909 | 26.7 | -5.6 | |
| Majority | 11,503 | 19.3 | -2.8 | ||
| Turnout | 59,596 | 83.1 | +12.2 | ||
| Registered electors | 71,682 | ||||
| Conservative hold | Swing | ||||
| Party | Candidate | Votes | % | ± | |
|---|---|---|---|---|---|
| Conservative | Toby Jessel | 28,571 | 54.4 | +6.7 | |
| Labour | John H.W. Grant | 16,950 | 32.3 | -1.7 | |
| Liberal | David Kenneth Rebak | 6,516 | 12.4 | -5.9 | |
| Independent | Richard Franklin | 462 | 0.9 | N/A | |
| Majority | 11,621 | 22.1 | +8.4 | ||
| Turnout | 52,499 | 70.9 | -7.7 | ||
| Registered electors | 74,038 | ||||
| Conservative hold | Swing | ||||
Elections in the 1960s
| Party | Candidate | Votes | % | ± | |
|---|---|---|---|---|---|
| Conservative | Gresham Cooke | 26,512 | 47.7 | -1.2 | |
| Labour | David Carlton | 18,884 | 34.0 | +6.8 | |
| Liberal | Simon Goldblatt | 10,160 | 18.3 | -3.7 | |
| Majority | 7,628 | 13.7 | -8.1 | ||
| Turnout | 55,556 | 78.6 | +0.9 | ||
| Registered electors | 70,675 | ||||
| Conservative hold | Swing | ||||
| Party | Candidate | Votes | % | ± | |
|---|---|---|---|---|---|
| Conservative | Gresham Cooke | 27,427 | 48.9 | -8.3 | |
| Labour | W Eric Wolff | 15,231 | 27.2 | -1.1 | |
| Liberal | John Woolfe | 12,306 | 22.0 | +7.4 | |
| Nuclear Disarmament | Michael H. Craft | 1,073 | 1.9 | N/A | |
| Majority | 12,196 | 21.8 | -7.1 | ||
| Turnout | 56,037 | 77.7 | -2.1 | ||
| Registered electors | 72,154 | ||||
| Conservative hold | Swing | ||||
Elections in the 1950s
| Party | Candidate | Votes | % | ± | |
|---|---|---|---|---|---|
| Conservative | Gresham Cooke | 33,677 | 57.2 | -1.2 | |
| Labour | Anne Kerr | 16,638 | 28.3 | -1.9 | |
| Liberal | Kenwyn Arthur Powell | 8,589 | 14.6 | +3.1 | |
| Majority | 17,039 | 28.9 | +0.7 | ||
| Turnout | 58,904 | 79.8 | +2.8 | ||
| Registered electors | 73,852 | ||||
| Conservative hold | Swing | ||||
| Party | Candidate | Votes | % | ± | |
|---|---|---|---|---|---|
| Conservative | Gresham Cooke | 33,726 | 58.4 | -2.7 | |
| Labour | Pat O'Gorman | 17,450 | 30.2 | -7.7 | |
| Liberal | Margaret Neilson | 6,626 | 11.5 | N/A | |
| Majority | 16,276 | 28.2 | +4.0 | ||
| Turnout | 57,802 | 77.0 | -4.3 | ||
| Registered electors | 75,106 | ||||
| Conservative hold | Swing | ||||
| Party | Candidate | Votes | % | ± | |
|---|---|---|---|---|---|
| Conservative | Gresham Cooke | 23,075 | 64.0 | +1.9 | |
| Labour | R. P. Pitman | 12,953 | 36.0 | -1.9 | |
| Majority | 10,122 | 28.1 | +3.8 | ||
| Turnout | 36,028 | 47.3 | -38.4 | ||
| Registered electors | 76,147 | ||||
| Conservative hold | Swing | -1.9 | |||
| Party | Candidate | Votes | % | ± | |
|---|---|---|---|---|---|
| Conservative | Edward Keeling | 39,080 | 62.1 | +6.2 | |
| Labour | Ethel E.B. Chipchase | 23,871 | 37.9 | +2.8 | |
| Majority | 15,209 | 24.2 | +3.4 | ||
| Turnout | 62,951 | 81.3 | -4.4 | ||
| Registered electors | 77,444 | ||||
| Conservative hold | Swing | ||||
| Party | Candidate | Votes | % | ± | |
|---|---|---|---|---|---|
| Conservative | Edward Keeling | 36,757 | 55.9 | +7.9 | |
| Labour | John Stonehouse | 23,088 | 35.1 | -6.8 | |
| Liberal | Derek Alan Forwood | 5,950 | 9.0 | -1.2 | |
| Majority | 13,669 | 20.8 | +14.7 | ||
| Turnout | 65,795 | 85.7 | +11.7 | ||
| Registered electors | 76,810 | ||||
| Conservative hold | Swing | ||||
Elections in the 1940s
| Party | Candidate | Votes | % | ± | |
|---|---|---|---|---|---|
| Conservative | Edward Keeling | 26,045 | 48.0 | -15.3 | |
| Labour | Arthur Irvine | 22,736 | 41.9 | +4.2 | |
| Liberal | Granville Slack | 5,509 | 10.2 | N/A | |
| Majority | 3,309 | 6.1 | -18.4 | ||
| Turnout | 54,290 | 74.0 | +7.5 | ||
| Registered electors | 73,336 | ||||
| Conservative hold | Swing | ||||
Elections in the 1930s
| Party | Candidate | Votes | % | ± | |
|---|---|---|---|---|---|
| Conservative | Edward Keeling | 37,635 | 62.3 | -11.7 | |
| Labour Co-op | Percy Holman | 22,823 | 37.7 | +11.7 | |
| Majority | 14,812 | 24.5 | -23.5 | ||
| Turnout | 60,458 | 66.5 | -4.8 | ||
| Registered electors | 90,929 | ||||
| Conservative hold | Swing | ||||
| Party | Candidate | Votes | % | ± | |
|---|---|---|---|---|---|
| Conservative | Alfred Critchley | 23,395 | 56.1 | -0.1 | |
| Labour Co-op | Percy Holman | 19,890 | 43.9 | +0.1 | |
| Majority | 5,505 | 12.2 | -0.2 | ||
| Turnout | 43,285 | 55.5 | +3.6 | ||
| Registered electors | 81,529 | ||||
| Conservative hold | Swing | -0.1 | |||
| Party | Candidate | Votes | % | ± | |
|---|---|---|---|---|---|
| Conservative | Hylton Murray-Philipson | 21,688 | 56.2 | -17.8 | |
| Labour Co-op | Percy Holman | 16,881 | 43.8 | +17.8 | |
| Majority | 4,807 | 12.4 | -35.6 | ||
| Turnout | 38,569 | 51.9 | -19.4 | ||
| Registered electors | 74,272 | ||||
| Conservative hold | Swing | 17.8 | |||
| Party | Candidate | Votes | % | ± | |
|---|---|---|---|---|---|
| Conservative | John Ferguson | 39,161 | 74.0 | +26.3 | |
| Labour Co-op | Percy Holman | 13,793 | 26.0 | -20.1 | |
| Majority | 25,398 | 48.0 | +46.4 | ||
| Turnout | 42,954 | 71.3 | +21.8 | ||
| Registered electors | 74,272 | ||||
| Conservative hold | Swing | +23.2 | |||
Elections in the 1920s
| Party | Candidate | Votes | % | ± | |
|---|---|---|---|---|---|
| Unionist | John Ferguson | 14,705 | 47.7 | -0.8 | |
| Labour | Thomas Jackson Mason | 14,202 | 46.1 | +11.3 | |
| Liberal | Frederick Paterson | 1,920 | 6.2 | -10.5 | |
| Majority | 503 | 1.6 | -12.1 | ||
| Turnout | 30,827 | 49.5 | -20.3 | ||
| Registered electors | 62,264 | ||||
| Unionist hold | Swing | -6.6 | |||
| Party | Candidate | Votes | % | ± | |
|---|---|---|---|---|---|
| Unionist | William Joynson-Hicks | 21,087 | 48.5 | -21.9 | |
| Labour | Thomas Jackson Mason | 15,121 | 34.8 | +5.2 | |
| Liberal | Frederick Paterson | 7,246 | 16.7 | N/A | |
| Majority | 5,966 | 13.7 | -27.1 | ||
| Turnout | 43,454 | 69.8 | -0.2 | ||
| Registered electors | 62,263 | ||||
| Unionist hold | Swing | -13.6 | |||
| Party | Candidate | Votes | % | ± | |
|---|---|---|---|---|---|
| Unionist | William Joynson-Hicks | 18,889 | 70.4 | +15.0 | |
| Labour | Stanley Simon Sherman | 7,945 | 29.6 | +5.9 | |
| Majority | 10,944 | 40.8 | +9.1 | ||
| Turnout | 26,834 | 70.0 | +8.0 | ||
| Registered electors | 38,353 | ||||
| Unionist hold | Swing | +4.6 | |||

| Party | Candidate | Votes | % | ± | |
|---|---|---|---|---|---|
| Unionist | William Joynson-Hicks | 12,903 | 55.4 | N/A | |
| Labour | Stanley Simon Sherman | 5,509 | 23.7 | N/A | |
| Liberal | Charles Baker | 4,858 | 20.9 | N/A | |
| Majority | 7,394 | 31.7 | N/A | ||
| Turnout | 23,270 | 62.0 | N/A | ||
| Registered electors | 37,558 | ||||
| Unionist hold | Swing | N/A | |||
| Party | Candidate | Votes | % | ± | |
|---|---|---|---|---|---|
| Unionist | William Joynson-Hicks | Unopposed | |||
| Registered electors | 37,073 | ||||
| Unionist hold | |||||
Elections in the 1910s
| Party | Candidate | Votes | % | ± | |
|---|---|---|---|---|---|
| C | Unionist | William Joynson-Hicks | 14,015 | 83.2 | N/A |
| Labour | Humphrey Chalmers | 2,823 | 16.8 | N/A | |
| Majority | 11,192 | 66.4 | N/A | ||
| Turnout | 16,838 | 48.2 | N/A | ||
| Registered electors | 34,924 | ||||
| Unionist win (new seat) | |||||
| C indicates candidate endorsed by the coalition government. | |||||
See also
Notes and references
- Notes
- ↑ A borough constituency (for the purposes of election expenses and type of returning officer)
- ↑ As with all constituencies, the constituency elects one Member of Parliament (MP) by the first past the post system of election at least every five years.
- ↑ However mostly further south as the river is on a north-south axis at this point
- ↑ An ill-defined but major neighbourhood of East Molesey often self-identifies as and ascribes to itself Hampton Court by virtue of its station and long standing sweep of shops of that name, across historic and actual boundaries, across the Thames in Surrey, this is not part of the Hampton Court hamlet mentioned.
- ↑ Also known as one-party swing
- ↑ By share of the vote, behind five seats: Orkney and Shetland, Westmoreland and Lonsdale, Bath, Yeovil, and Norfolk North
- References
- ↑ "Electorate Figures - Boundary Commission for England". 2011 Electorate Figures. Boundary Commission for England. 4 March 2011. Archived from the original on 6 November 2010. Retrieved 13 March 2011.
- ↑ "GE2017 - Constituency results". Britain Elects (Google Docs). Retrieved 11 June 2017.
- ↑ "Turnout - General Elections Online". geo.digiminster.
- ↑ "Results of the 2017 General Election". BBC News.
- ↑ Unemployment claimants by constituency The Guardian
- ↑ "Vince Cable is to run for parliament in snap election". The Independent. 18 April 2017.
- ↑ http://researchbriefings.files.parliament.uk/documents/CBP-7979/CBP-7979.pdf
- ↑ "Election Data 2015". Electoral Calculus. Archived from the original on 17 October 2015. Retrieved 17 October 2015.
- ↑ "Election results for Twickenham, 7 May 2015". 7 May 2015.
- ↑ "Election Data 2010". Electoral Calculus. Archived from the original on 26 July 2013. Retrieved 17 October 2015.
- ↑ British Parliament by-election: 1955
- 1 2 3 Craig, F. W. S. (1983). British parliamentary election results 1918-1949 (3 ed.). Chichester: Parliamentary Research Services. ISBN 0-900178-06-X.
Sources
- Boundary Commission for England
- Leigh Rayment's Historical List of MPs – Constituencies beginning with "T" (part 2)
- Craig, F. W. S. (1983) [1969]. British parliamentary election results 1918-1949 (3rd ed.). Chichester: Parliamentary Research Services. ISBN 0-900178-06-X.
External links
- Politics Resources (Election results from 1922 onwards)
- Electoral Calculus (Election results from 1955 onwards)