Saffron Walden (UK Parliament constituency)
| Saffron Walden | |
|---|---|
|
County constituency for the House of Commons | |
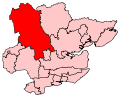 Boundary of Saffron Walden in Essex. | |
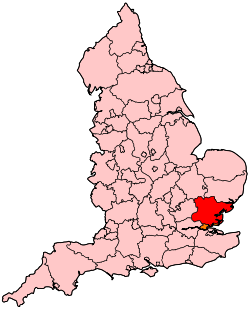 Location of Essex within England. | |
| County | Essex |
| Electorate | 77,109 (December 2010)[1] |
| Major settlements | Saffron Walden, Great Dunmow, Halstead |
| Current constituency | |
| Created | 1885 |
| Member of parliament | Kemi Badenoch (Conservative) |
| Number of members | One |
| Created from | West Essex |
| Overlaps | |
| European Parliament constituency | East of England |
Saffron Walden is a constituency[n 1] represented in the House of Commons of the UK Parliament since 2017 by Kemi Badenoch, a Conservative.[n 2]
Boundaries
1885-1918: The Municipal Borough of Saffron Walden, the Sessional Divisions of Freshwell, Hinckford North, and Walden, part of the Sessional Division of Hinckford South (Halstead Bench), the part of the Municipal Borough of Sudbury in the county of Essex, and the civil parish of Thaxted.
1918-1950: The Municipal Borough of Saffron Walden, the Urban District of Halstead, and the Rural Districts of Belchamp, Bumpstead, Dunmow, Halstead, Saffron Walden, and Stansted.
1950-1974: The Municipal Borough of Saffron Walden, the Urban District of Halstead, the Rural Districts of Dunmow, Halstead, and Saffron Walden, and in the Rural District of Braintree the civil parishes of Bardfield Saling and Great Bardfield.
1974-1983: The Municipal Borough of Saffron Walden, the Urban District of Halstead, and the Rural Districts of Dunmow, Halstead, and Saffron Walden.
1983-1997: The District of Uttlesford, and the District of Braintree wards of Bumpstead, Castle Hedingham, Colne Engaine and Greenstead Green, Earls Colne, Gosfield, Halstead St Andrews, Halstead Trinity, Sible Hedingham, Stour Valley Central, Stour Valley North, Stour Valley South, Upper Colne, and Yeldham.
1997-2010: The District of Uttlesford, and the District of Braintree wards of Bumpstead, Castle Hedingham, Colne Engaine and Greenstead Green, Halstead St Andrews, Halstead Trinity, Sible Hedingham, Stour Valley Central, Stour Valley North, Stour Valley South, Upper Colne, and Yeldham.
2010-present: The District of Uttlesford, and the Borough of Chelmsford wards of Boreham and The Leighs, Broomfield and The Walthams, Chelmsford Rural West, and Writtle.
The 2010 redistribution removed the area around Halstead in Braintree district from the constituency and replaced it with the northern wards of the Borough of Chelmsford.
History
This constituency was created on slightly different, larger boundaries under the Redistribution of Seats Act 1885. Aside from the towns much of the area is rural farmland and small villages.
This has been a Conservative safe seat based on election results since 1922, in which period the majorities have occasionally been marginal, but with the seat now boasting a majority of over 24,000, with Labour finishing second in the seat in the 2017 UK General Election, the first time this has happened since 1970.
Constituency profile
The constituency is by far the largest and most rural in Essex, and covers the entire north-west corner of the county: an area of almost 400 square miles (1,000 km2).[2] It borders Hertfordshire and Cambridgeshire, and also extends deep into the middle of Essex near Chelmsford.
Three medium-sized market towns, Saffron Walden, Dunmow and Halstead are in the constituency. All three have historic links, and are busy and regionally visitor-drawing towns in the South East.
The largest single source of employment in the constituency is Stansted Airport, while there are also a host of small businesses, many of them high-tech, along and at the ends of the London-Cambridge corridor.
- In statistics
The constituency consists of Census Output Areas of two local government districts with similar characteristics. Uttlesford district forms the bulk, and has a working population whose income is close to the national average and much lower than average reliance upon social housing.[3] At the end of 2012 the unemployment rate in the constituency stood at 1.6% of the population claiming jobseekers allowance, compared to the regional average of 2.4%.[4] The borough contributing to the bulk of the seat has a very low 10.1% of its population without a car, 17.7% of the population without qualifications and a high 31.9% had level 4 qualifications or above. In terms of tenure 71.6% of homes are owned outright or on a mortgage as at the 2011 census across the Uttlesford district.[5]
Members of Parliament
Since the snap election in 2017, this safe Conservative seat has been represented by Kemi Badenoch. It was held for many years by former Chancellor of the Exchequer Rab Butler and by former Deputy Speaker of the House of Commons Sir Alan Haselhurst.

| Election | Member[6] | Party | Notes | |
|---|---|---|---|---|
| 1885 | Herbert Gardner | Liberal | ||
| 1895 | Charles Gold | Liberal | ||
| 1900 | Armine Wodehouse | Liberal | ||
| 1901 | Joseph Pease | Liberal | ||
| 1910 | Douglas Proby | Conservative | ||
| 1910 | Cecil Beck | Liberal | ||
| 1919 | Coalition Liberal | |||
| 1921 | Independent Parliamentary Group | |||
| 1922 | William Foot Mitchell | Unionist | ||
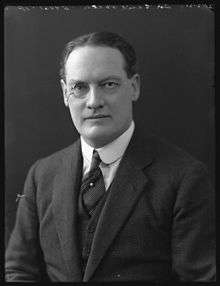
| 1929 | Rab Butler | Conservative | Chancellor of the Exchequer 1951-1955. Father of the House 1964-1965. Disqualified February 1965 on being raised to the peerage. | |
| 1965 by-election | Sir Peter Kirk | Conservative | Died April 1977. | |
| 1977 by-election | Sir Alan Haselhurst | Conservative | Previously MP for Middleton and Prestwich 1970-1974. Chairman of Ways and Means 1997-2010. | |
| 2017 | Kemi Badenoch | Conservative | ||
Elections
Elections in the 2010s
| Party | Candidate | Votes | % | ± | |
|---|---|---|---|---|---|
| Conservative | Kemi Badenoch | 37,629 | 61.8 | +4.6 | |
| Labour | Jane Berney | 12,663 | 20.8 | +8.9 | |
| Liberal Democrat | Mike Hibbs | 8,528 | 14.0 | +3.4 | |
| UKIP | Lorna Howe | 2,091 | 3.4 | -10.4 | |
| Majority | 24,966 | 41.0 | -2.4 | ||
| Turnout | 60,911 | 73.1 | +1.7 | ||
| Conservative hold | Swing | -2.2 | |||
| Party | Candidate | Votes | % | ± | |
|---|---|---|---|---|---|
| Conservative | Alan Haselhurst | 32,926 | 57.2 | +1.7 | |
| UKIP | Peter Day | 7,935 | 13.8 | +9.7 | |
| Labour | Jane Berney | 6,791 | 11.8 | +2.1 | |
| Liberal Democrat | Mike Hibbs | 6,079 | 10.6 | −16.9 | |
| Green | Karmel Stannard | 2,174 | 3.8 | +2.4 | |
| Residents for Uttlesford | Heather Asker | 1,658 | 2.9 | N/A | |
| Majority | 24,991 | 43.4 | +15.4 | ||
| Turnout | 57,563 | 71.4 | -0.2 | ||
| Conservative hold | Swing | −4.0 | |||
| Party | Candidate | Votes | % | ± | |
|---|---|---|---|---|---|
| Conservative | Alan Haselhurst | 30,155 | 55.4 | +4.6 | |
| Liberal Democrat | Peter Wilcock | 14,913 | 27.4 | −2.2 | |
| Labour | Barbara Light | 5,288 | 9.7 | −4.5 | |
| UKIP | Roger Lord | 2,288 | 4.2 | +1.5 | |
| BNP | Chrissie Mitchell | 1,050 | 1.9 | +1.9 | |
| Green | Reza Hossain | 735 | 1.4 | +1.4 | |
| Majority | 15,242 | 28.0 | |||
| Turnout | 54,429 | 71.6 | +2.8 | ||
| Conservative hold | Swing | +3.4 | |||
Elections in the 2000s
| Party | Candidate | Votes | % | ± | |
|---|---|---|---|---|---|
| Conservative | Alan Haselhurst | 27,263 | 51.4 | +2.5 | |
| Liberal Democrat | Elfreda Tealby-Watson | 14,255 | 26.9 | +2.0 | |
| Labour | Swatantra Nandanwar | 8,755 | 16.5 | −6.1 | |
| UKIP | Raymond Tyler | 1,412 | 2.7 | −0.8 | |
| English Democrat | Raymond Brown | 860 | 1.6 | N/A | |
| Veritas | Trevor Hackett | 475 | 0.9 | N/A | |
| Majority | 13,008 | 24.5 | |||
| Turnout | 53,020 | 68.3 | +3.1 | ||
| Conservative hold | Swing | +0.3 | |||
| Party | Candidate | Votes | % | ± | |
|---|---|---|---|---|---|
| Conservative | Alan Haselhurst | 24,485 | 48.9 | +3.6 | |
| Liberal Democrat | Elfreda Tealby-Watson | 12,481 | 24.9 | −1.9 | |
| Labour | Tania Rogers | 11,305 | 22.6 | +1.1 | |
| UKIP | Richard Glover | 1,769 | 3.5 | +2.4 | |
| Majority | 12,004 | 24.0 | |||
| Turnout | 50,040 | 65.2 | −11.7 | ||
| Conservative hold | Swing | +2.3 | |||
Elections in the 1990s
| Party | Candidate | Votes | % | ± | |
|---|---|---|---|---|---|
| Conservative | Alan Haselhurst | 25,871 | 45.3 | -11.3 | |
| Liberal Democrat | Melvin H. Caton | 15,298 | 26.8 | −1.8 | |
| Labour | Malcolm J. Fincken | 12,275 | 21.5 | +7.2 | |
| Referendum | Richard Glover | 2,308 | 4.0 | N/A | |
| UKIP | Ian Evans | 658 | 1.2 | N/A | |
| Independent | Barry Tyler | 486 | 0.9 | N/A | |
| Natural Law | Christopher Edwards | 154 | 0.3 | −0.1 | |
| Majority | 10,573 | 18.5 | −13.1 | ||
| Turnout | 57,050 | 76.9 | −6.3 | ||
| Conservative hold | Swing | −6.6 | |||
| Party | Candidate | Votes | % | ± | |
|---|---|---|---|---|---|
| Conservative | Alan Haselhurst | 35,272 | 56.6 | −1.1 | |
| Liberal Democrat | Mark Hayes | 17,848 | 28.6 | −0.3 | |
| Labour | John Kotz | 8,933 | 14.3 | +2.8 | |
| Natural Law | Michael D. Miller | 260 | 0.4 | N/A | |
| Majority | 17,424 | 28.0 | −0.8 | ||
| Turnout | 62,313 | 83.2 | +4.2 | ||
| Conservative hold | Swing | −0.4 | |||
Elections in the 1980s
| Party | Candidate | Votes | % | ± | |
|---|---|---|---|---|---|
| Conservative | Alan Haselhurst | 33,354 | 57.7 | −0.2 | |
| Liberal | Mark Hayes | 16,752 | 29.0 | −0.3 | |
| Labour | Robert Gifford | 6,674 | 11.5 | +0.1 | |
| Green | George Hannah | 816 | 1.4 | N/A | |
| All Party Anti-Common Market | Oliver Smedley | 217 | 0.4 | −1.1 | |
| Majority | 16,602 | 28.72 | |||
| Turnout | 79.00 | ||||
| Conservative hold | Swing | ||||
| Party | Candidate | Votes | % | ± | |
|---|---|---|---|---|---|
| Conservative | Alan Haselhurst | 30,869 | 57.85 | ||
| Social Democratic | John Torode | 15,620 | 29.27 | ||
| Labour | RP Trory | 6,078 | 11.39 | ||
| All Party Anti-Common Market | Oliver Smedley | 797 | 1.49 | ||
| Majority | 15,249 | 28.58 | |||
| Turnout | 76.91 | ||||
| Conservative hold | Swing | ||||
Elections in the 1970s
| Party | Candidate | Votes | % | ± | |
|---|---|---|---|---|---|
| Conservative | Alan Haselhurst | 28,563 | 53.81 | ||
| Liberal | Andrew Phillips | 13,200 | 24.87 | ||
| Labour | Ben Stoneham | 10,547 | 19.87 | ||
| Independent | Oliver Smedley | 425 | 0.80 | ||
| National Front | R Bailey | 342 | 0.64 | ||
| Majority | 15,363 | 28.94 | |||
| Turnout | 81.61 | ||||
| Conservative hold | Swing | ||||
| Party | Candidate | Votes | % | ± | |
|---|---|---|---|---|---|
| Conservative | Alan Haselhurst | 22,692 | 55.74 | +12.03 | |
| Liberal | Andrew Phillips | 10,255 | 25.19 | -5.13 | |
| Labour | Ben Stoneham | 5,948 | 14.61 | -11.36 | |
| All Party Anti-Common Market | Oliver Smedley | 1,818 | 4.47 | N/A | |
| Majority | 12,437 | 30.55 | |||
| Turnout | 40,713 | ||||
| Conservative hold | Swing | ||||
| Party | Candidate | Votes | % | ± | |
|---|---|---|---|---|---|
| Conservative | Peter Kirk | 21,291 | 43.71 | ||
| Liberal | Frank P D Moore | 14,770 | 30.32 | ||
| Labour | H Green | 12,652 | 25.97 | ||
| Majority | 6,521 | 13.39 | |||
| Turnout | 78.07 | ||||
| Conservative hold | Swing | ||||
| Party | Candidate | Votes | % | ± | |
|---|---|---|---|---|---|
| Conservative | Peter Kirk | 23,013 | 44.58 | ||
| Liberal | Frank P D Moore | 15,468 | 29.97 | ||
| Labour | J Dowsett | 13,138 | 25.45 | ||
| Majority | 7,545 | 14.62 | |||
| Turnout | 83.40 | ||||
| Conservative hold | Swing | ||||
| Party | Candidate | Votes | % | ± | |
|---|---|---|---|---|---|
| Conservative | Peter Kirk | 24,549 | 52.92 | ||
| Labour | Ken Weetch | 14,885 | 32.08 | ||
| Liberal | Frank P D Moore | 6,959 | 15.00 | ||
| Majority | 9,664 | 20.83 | |||
| Turnout | 77.24 | ||||
| Conservative hold | Swing | ||||
Elections in the 1960s
| Party | Candidate | Votes | % | ± | |
|---|---|---|---|---|---|
| Conservative | Peter Kirk | 20,441 | 47.42 | ||
| Labour | Stephen Haseler | 17,176 | 39.85 | ||
| Liberal | Frank P D Moore | 5,487 | 12.73 | ||
| Majority | 3,265 | 7.57 | |||
| Turnout | 82.54 | ||||
| Conservative hold | Swing | ||||
| Party | Candidate | Votes | % | ± | |
|---|---|---|---|---|---|
| Conservative | Peter Kirk | 18,851 | 48.5 | -0.8 | |
| Labour | Michael D Cornish | 15,358 | 39.5 | +2.0 | |
| Liberal | Frank P D Moore | 4,626 | 11.9 | -1.4 | |
| Majority | 3,493 | 9.0 | |||
| Turnout | |||||
| Conservative hold | Swing | ||||
| Party | Candidate | Votes | % | ± | |
|---|---|---|---|---|---|
| Conservative | Rab Butler | 20,610 | 49.3 | ||
| Labour | Michael D Cornish | 15,655 | 37.5 | ||
| Liberal | Frank P D Moore | 6,189 | 13.3 | ||
| Majority | 4,955 | 11.85 | – | ||
| Turnout | 82.41 | ||||
| Conservative hold | Swing | ||||
Elections in the 1950s
| Party | Candidate | Votes | % | ± | |
|---|---|---|---|---|---|
| Conservative | Rab Butler | 20,955 | 53.22 | ||
| Labour | Hampden N Horne | 14,173 | 36.00 | ||
| Liberal | David J Ridley | 4,245 | 10.78 | ||
| Majority | 6,782 | 17.23 | |||
| Turnout | 81.26 | ||||
| Conservative hold | Swing | ||||
| Party | Candidate | Votes | % | ± | |
|---|---|---|---|---|---|
| Conservative | Rab Butler | 20,671 | 54.21 | ||
| Labour | Hampden N Horne | 14,253 | 37.28 | ||
| Liberal | Helen G Carson | 3,209 | 8.42 | ||
| Majority | 6,418 | 16.83 | |||
| Turnout | 79.57 | ||||
| Conservative hold | Swing | ||||
| Party | Candidate | Votes | % | ± | |
|---|---|---|---|---|---|
| Conservative | Rab Butler | 20,564 | 51.95 | ||
| Labour | Reginald Groves | 15,245 | 38.51 | ||
| Liberal | Oliver Smedley | 3,774 | 9.53 | ||
| Majority | 5,319 | 13.44 | |||
| Turnout | 82.75 | ||||
| Conservative hold | Swing | ||||
| Party | Candidate | Votes | % | ± | |
|---|---|---|---|---|---|
| Conservative | Rab Butler | 19,797 | 49.91 | ||
| Labour | Sidney Stanley Wilson | 14,908 | 37.58 | ||
| Liberal | Oliver Smedley | 4,963 | 12.51 | ||
| Majority | 4,889 | 12.32 | |||
| Turnout | 84.40 | ||||
| Conservative hold | Swing | ||||
Election in the 1940s
| Party | Candidate | Votes | % | ± | |
|---|---|---|---|---|---|
| Conservative | Rab Butler | 16,950 | 46.90 | ||
| Labour | Sidney Stanley Wilson | 15,792 | 43.70 | ||
| Liberal | George Adolphus Edinger | 3,395 | 9.39 | ||
| Majority | 1,158 | 3.20 | |||
| Turnout | 74.64 | ||||
| Conservative hold | Swing | ||||
Elections in the 1930s
General Election 1939/40: Another General Election was required to take place before the end of 1940. The political parties had been making preparations for an election to take place from 1939 and by the end of this year, the following candidates had been selected;
- Conservative: Rab Butler
- Labour: Clara Rackham[10]
| Party | Candidate | Votes | % | ± | |
|---|---|---|---|---|---|
| Conservative | Rab Butler | 19,669 | 67.13 | ||
| Labour | Clara Rackham | 9,633 | 32.87 | ||
| Majority | 10,036 | 34.25 | |||
| Turnout | 68.55 | ||||
| Conservative hold | Swing | ||||
| Party | Candidate | Votes | % | ± | |
|---|---|---|---|---|---|
| Conservative | Rab Butler | 22,501 | 77.67 | ||
| Labour | Sidney Stanley Wilson | 6,468 | 22.33 | ||
| Majority | 16,033 | 55.35 | |||
| Turnout | 70.38 | ||||
| Conservative hold | Swing | ||||
- The Liberal candidate, Arthur Musgrove Mathews withdrew at the last minute
Elections in the 1920s
| Party | Candidate | Votes | % | ± | |
|---|---|---|---|---|---|
| Unionist | Rab Butler | 13,561 | 44.5 | -7.1 | |
| Labour | William Cash | 8,642 | 28.3 | +1.7 | |
| Liberal | Arthur Musgrove Mathews | 8,307 | 27.2 | +5.4 | |
| Majority | 4,919 | 16.2 | -8.8 | ||
| Turnout | 75.8 | +2.7 | |||
| Unionist hold | Swing | -4.4 | |||
| Party | Candidate | Votes | % | ± | |
|---|---|---|---|---|---|
| Unionist | William Foot Mitchell | 12,289 | 51.6 | ||
| Labour | William Cash | 6,340 | 26.6 | ||
| Liberal | Arthur Musgrove Mathews | 5,195 | 21.8 | ||
| Majority | 5,949 | 25.0 | |||
| Turnout | 73.1 | ||||
| Unionist hold | Swing | ||||
| Party | Candidate | Votes | % | ± | |
|---|---|---|---|---|---|
| Unionist | William Foot Mitchell | 9,652 | 44.3 | +0.7 | |
| Labour | William Cash | 6,398 | 29.3 | -0.8 | |
| Liberal | Robert McNair Wilson | 5,752 | 26.4 | +13.8 | |
| Majority | 3,254 | 15.0 | +1.5 | ||
| Turnout | 67.7 | -3.4 | |||
| Unionist hold | Swing | -0.7 | |||
| Party | Candidate | Votes | % | ± | |
|---|---|---|---|---|---|
| Unionist | William Foot Mitchell | 9,844 | 43.6 | ||
| Labour | William Cash | 6,797 | 30.1 | ||
| National Liberal | W D Harbinson | 3,097 | 13.7 | ||
| Liberal | Robert McNair Wilson | 2,853 | 12.6 | ||
| Majority | 3,047 | 13.5 | |||
| Turnout | 71.1 | ||||
| Unionist gain from Liberal | Swing | ||||
Elections in the 1910s
| Party | Candidate | Votes | % | ± | |
|---|---|---|---|---|---|
| C | Liberal | Cecil Beck | 10,628 | 70.1 | +19.9 |
| Labour | Jimmy Mallon | 4,531 | 29.9 | N/A | |
| Majority | 6,097 | 40.2 | +39.8 | ||
| Turnout | 15,159 | 47.8 | −40.4 | ||
| Liberal hold | Swing | N/A | |||
| C indicates candidate endorsed by the coalition government. | |||||
| Party | Candidate | Votes | % | ± | |
|---|---|---|---|---|---|
| Liberal | Cecil Beck | Unopposed | |||
| Liberal hold | |||||

| Party | Candidate | Votes | % | ± | |
|---|---|---|---|---|---|
| Liberal | Cecil Beck | 4,071 | 50.2 | +1.8 | |
| Conservative | Douglas Proby | 4,031 | 49.8 | −1.8 | |
| Majority | 40 | 0.4 | N/A | ||
| Turnout | 8,102 | 88.2 | −2.1 | ||
| Registered electors | 9,187 | ||||
| Liberal gain from Conservative | Swing | +1.8 | |||
| Party | Candidate | Votes | % | ± | |
|---|---|---|---|---|---|
| Conservative | Douglas Proby | 4,283 | 51.6 | +10.5 | |
| Liberal | Jack Pease | 4,011 | 48.4 | −10.5 | |
| Majority | 272 | 3.2 | N/A | ||
| Turnout | 8,294 | 90.3 | +9.0 | ||
| Registered electors | 9,187 | ||||
| Conservative gain from Liberal | Swing | +10.5 | |||
Elections in the 1900s

| Party | Candidate | Votes | % | ± | |
|---|---|---|---|---|---|
| Liberal | Jack Pease | 4,203 | 58.9 | +8.0 | |
| Conservative | Walter Barttelot | 2,935 | 41.1 | −8.0 | |
| Majority | 1,268 | 17.8 | +16.0 | ||
| Turnout | 7,138 | 81.3 | +6.7 | ||
| Registered electors | 8,779 | ||||
| Liberal hold | Swing | +8.0 | |||
| Party | Candidate | Votes | % | ± | |
|---|---|---|---|---|---|
| Liberal | Jack Pease | 3,994 | 55.5 | +4.6 | |
| Conservative | Charles Wing Gray | 3,202 | 44.5 | −4.6 | |
| Majority | 792 | 11.0 | +9.2 | ||
| Turnout | 7,196 | 84.2 | +7.6 | ||
| Registered electors | 8,550 | ||||
| Liberal hold | Swing | +4.6 | |||
| Party | Candidate | Votes | % | ± | |
|---|---|---|---|---|---|
| Liberal | Armine Wodehouse | 3,247 | 50.9 | -2.1 | |
| Conservative | Charles Wing Gray | 3,137 | 49.1 | +2.1 | |
| Majority | 110 | 1.8 | -4.2 | ||
| Turnout | 6,384 | 74.6 | −6.0 | ||
| Registered electors | 8,556 | ||||
| Liberal hold | Swing | −2.1 | |||
Elections in the 1890s
| Party | Candidate | Votes | % | ± | |
|---|---|---|---|---|---|
| Liberal | Charles Gold | 3,806 | 53.0 | −10.0 | |
| Conservative | Charles Wing Gray | 3,381 | 47.0 | +10.0 | |
| Majority | 425 | 6.0 | −20.0 | ||
| Turnout | 7,187 | 80.6 | +0.9 | ||
| Registered electors | 8,920 | ||||
| Liberal hold | Swing | −10.0 | |||
| Party | Candidate | Votes | % | ± | |
|---|---|---|---|---|---|
| Liberal | Herbert Gardner | Unopposed | |||
| Liberal hold | |||||
- Caused by Gardner's appointment as President of the Board of Agriculture
| Party | Candidate | Votes | % | ± | |
|---|---|---|---|---|---|
| Liberal | Herbert Gardner | 4,564 | 63.0 | +8.0 | |
| Conservative | Philip Vernon Smith[14] | 2,683 | 37.0 | −8.0 | |
| Majority | 1,881 | 26.0 | +16.0 | ||
| Turnout | 7,247 | 79.7 | +0.4 | ||
| Registered electors | 9,098 | ||||
| Liberal hold | Swing | +8.0 | |||
Elections in the 1880s
| Party | Candidate | Votes | % | ± | |
|---|---|---|---|---|---|
| Liberal | Herbert Gardner | 4,059 | 55.0 | −6.3 | |
| Conservative | George William Brewis[15] | 3,319 | 45.0 | +6.3 | |
| Majority | 740 | 10.0 | −12.6 | ||
| Turnout | 7,378 | 79.3 | −4.1 | ||
| Registered electors | 9,306 | ||||
| Liberal hold | Swing | −6.3 | |||
| Party | Candidate | Votes | % | ± | |
|---|---|---|---|---|---|
| Liberal | Herbert Gardner | 4,755 | 61.3 | N/A | |
| Conservative | Charles Hedley Strutt | 3,006 | 38.7 | N/A | |
| Majority | 1,749 | 22.6 | N/A | ||
| Turnout | 7,761 | 83.4 | N/A | ||
| Registered electors | 9,306 | ||||
| Liberal win (new seat) | |||||
See also
Notes and references
- Notes
- ↑ A county constituency (for the purposes of election expenses and type of returning officer)
- ↑ As with all constituencies, the constituency elects one Member of Parliament (MP) by the first past the post system of election at least every five years.
- References
- ↑ "Electorate Figures – Boundary Commission for England". 2011 Electorate Figures. Boundary Commission for England. 4 March 2011. Archived from the original on 6 November 2010. Retrieved 13 March 2011.
- ↑ "Grid Reference Finder". www.gridreferencefinder.com.
- ↑ "Local statistics - Office for National Statistics". neighbourhood.statistics.gov.uk.
- ↑ Unemployment claimants by constituency The Guardian
- ↑ "2011 census interactive maps". Archived from the original on 2016-01-29.
- ↑ Leigh Rayment's Historical List of MPs – Constituencies beginning with "S" (part 1)
- ↑ "Election Data 2015". Electoral Calculus. Archived from the original on 17 October 2015. Retrieved 17 October 2015.
- ↑ "Election Data 2010". Electoral Calculus. Archived from the original on 26 July 2013. Retrieved 17 October 2015.
- ↑ "Politics Resources". Election 1992. Politics Resources. 9 April 1992. Retrieved 2010-12-06.
- ↑ Report of the Annual Conference of the Labour Party, 1939
- 1 2 3 4 Craig, F. W. S. (1983). British parliamentary election results 1918–1949 (3 ed.). Chichester: Parliamentary Research Services. ISBN 0-900178-06-X.
- 1 2 3 4 5 6 7 8 9 10 11 British parliamentary election results, 1885–1918 (Craig)
- ↑ The Times, 3 June 1901 p7
- ↑ "Saffron Walden". Herts & Cambs Reporter & Royston Crow. 18 Sep 1891. Retrieved 15 November 2017.
- ↑ "Saffron Walden Division". Essex Herald. 19 June 1886. p. 4. Retrieved 10 December 2017 – via British Newspaper Archive. (Subscription required (help)).
|
| Preceded by Essex Western |
UK Parliament constituency 1885– |
Succeeded by Current incumbent |
| Parliament of the United Kingdom | ||
|---|---|---|
| Preceded by Leeds South |
Constituency represented by the Chancellor of the Exchequer 1951–1955 |
Succeeded by Bromley |
| Preceded by Woodford |
Constituency represented by the Father of the House 1964–1965 |
Succeeded by Thirsk and Malton |