Eastbourne (UK Parliament constituency)
Coordinates: 50°46′41″N 0°17′10″E / 50.778°N 0.286°E
| Eastbourne | |
|---|---|
|
Borough constituency for the House of Commons | |
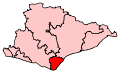 Boundary of Eastbourne in East Sussex. | |
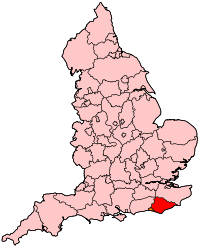 Location of East Sussex within England. | |
| County | East Sussex |
| Electorate | 78,262 (May 2015)[1] |
| Major settlements | Eastbourne |
| Current constituency | |
| Created | 1885 |
| Member of parliament | Stephen Lloyd (Liberal Democrat) |
| Number of members | One |
| Created from | East Sussex |
| Overlaps | |
| European Parliament constituency | South East England |
Eastbourne is a constituency (also known as a seat) for the House of Commons of the UK Parliament. It was created as one of nine in Sussex in 1885, since when the seat has reduced in geographic size reflecting the growth of its main settlement, Eastbourne.[n 1]
The seat was re-won in 2017 by Stephen Lloyd for the Liberal Democrats; he had first won it in 2010. The 2015 election was won by a Conservative.[n 2] Since the seat's creation it has been won by candidates from either of these two political parties (and their early forebears, the Liberal Party and the Unionist Party).
For 94 years of the 20th Century, the seat was represented by Conservative MPs. The seat in the 1930s saw three unopposed candidates: in 1932, March 1935 and November 1935. Eastbourne has been considered relative to others a very marginal seat, as well as a swing seat, since 1997 as its winner's majority has not exceeded 6.6% of the vote since the 8.9% majority won in 1992 and the seat has changed hands four times from and including the year 1992.
Members of Parliament
Constituency profile
The constituency contains urban and suburban developments, including the whole of the Eastbourne Borough Council administrative area, as well as the village of Willingdon on its outskirts, which forms a small part of the Wealden District Council administrative area.
Eastbourne itself is on the edge of the London Commuter Belt and is a coastal resort town. The Eastbourne seat has narrowed at every Boundary Commission Periodic Review, as the population of the core town has grown.
History
Origin
This seat was created by the Redistribution of Seats Act 1885. Its territory had previously been incorporated in the East Sussex constituency, which in turn had been created with two seats by the Reform Act 1832 as a division of the medieval-founded Sussex constituency which had two seats.
Boundaries
1885-1918: The Corporate Towns of Pevensey and Seaford, the Sessional Divisions of Hailsham and Uckfield (except the parishes of East Hoathly and Waldron), and part of the Sessional Division of Lewes.
1918-1950: The Borough of Eastbourne, the Rural District of Eastbourne, and in the Rural District of Hailsham the parishes of Arlington, Chalvington, Chiddingly, Hailsham, Hellingly, Laughton, and Ripe.
1950-1955: The Boroughs of Eastbourne and Bexhill, and in the Rural District of Hailsham the parishes of East Dean, Friston, Hooe, Jevington, Ninfield, Pevensey, Polegate, Wartling, Westham, and Willingdon.
1955-1974: The Borough of Eastbourne, and part of the Rural District of Hailsham.
1974-1983: The Municipal Borough of Eastbourne, and in the Rural District of Hailsham the parishes of East Dean, Friston, Jevington, Pevensey, Polegate, Westdean, Westham, and Willingdon.
1983-1997: The Borough of Eastbourne, and the District of Wealden wards of Polegate North, Polegate South, and Willingdon.
1997-2010: As prior, substituting East Dean for the Polegate wards.
2010-present: As prior, less East Dean.
From safe seat to swing seat
From 1910 until 1987 the seat returned Conservative Party candidates at every election, with only one exception (in 1906). The large rural vote within the seat, until boundary changes in 1983, bolstered support for the Conservative Party - since rural voters in South East England tended to be wealthier and more right-wing than urban voters.
The seat became a marginal, or swing seat, from the 1990 by-election onwards, being closely fought for between the two locally dominant parties. A Liberal Democrat gained the seat at the 2010 general election, in a vote which saw Eastbourne return the sixth-lowest Labour share of the vote of the 631 candidates who stood at the election, with only 4.8%.[3] In 2015, the seat was the 9th most marginal of the Conservative Party's 331 seats, by share of the vote.[4]
By-elections
- Eastbourne by-election, 1925 (Con, hold), following the resignation of the Conservative MP Sir George Ambrose Lloyd
- Eastbourne by-election, 1932 (Con, hold), following the death of the Conservative MP Edward Marjoribanks
- Eastbourne by-election, 1935 (Con, hold), following the death of the Conservative MP John Slater
- Eastbourne by-election, 1990 (LD, gain), following the assassination of the Conservative MP Ian Gow by members of the Provisional IRA.
Proposal to change constituency name
In 2016, the incumbent MP Caroline Ansell, publicly floated a proposal to change the constituency name from Eastbourne to Eastbourne & Willingdon.[5] However, the idea appeared to gain no significant public support and the MP did not formally apply to the Boundary Commission to make any change.
Election results by decade
Elections in the 2010s
| Party | Candidate | Votes | % | ± | |
|---|---|---|---|---|---|
| Liberal Democrat | Stephen Lloyd | 26,924 | 46.9 | +8.7 | |
| Conservative | Caroline Ansell | 25,315 | 44.1 | +4.5 | |
| Labour | Jake Lambert | 4,671 | 8.1 | +0.3 | |
| Green | Alex Hough | 510 | 0.9 | -1.7 | |
| Majority | 1,609 | 2.8 | |||
| Turnout | 57,420 | 72.9 | +5.3 | ||
| Liberal Democrat gain from Conservative | Swing | +2.1 | |||
| Party | Candidate | Votes | % | ± | |
|---|---|---|---|---|---|
| Conservative | Caroline Ansell | 20,934 | 39.6 | -1.1 | |
| Liberal Democrat | Stephen Lloyd | 20,201 | 38.2 | -9.1 | |
| UKIP | Nigel Jones | 6,139 | 11.6 | +9.1 | |
| Labour | Jake Lambert | 4,143 | 7.8 | +3.0 | |
| Green | Andrew Durling | 1,351 | 2.6 | N/A | |
| Independent | Paul Howard | 139 | 0.3 | N/A | |
| Majority | 733 | 1.4 | |||
| Turnout | 52,907 | 67.6 | |||
| Conservative gain from Liberal Democrat | Swing | +4.0 | |||
| Party | Candidate | Votes | % | ± | |
|---|---|---|---|---|---|
| Liberal Democrat | Stephen Lloyd | 24,658 | 47.3 | +5.6 | |
| Conservative | Nigel Waterson | 21,223 | 40.7 | −2.3 | |
| Labour | Dave Brinson | 2,497 | 4.8 | −6.0 | |
| Independent | Stephen Shing | 1,327 | 2.5 | N/A | |
| UKIP | Roger Needham | 1,305 | 2.5 | +0.0 | |
| BNP | Colin Poulter | 939 | 1.8 | N/A | |
| Independent | Michael Baldry | 101 | 0.2 | N/A | |
| Independent | Keith Gell | 74 | 0.1 | N/A | |
| Majority | 3,435 | 6.6 | |||
| Turnout | 52,124 | 67.0 | +3.8 | ||
| Liberal Democrat gain from Conservative | Swing | +4.0 | |||
Elections in the 2000s
| Party | Candidate | Votes | % | ± | |
|---|---|---|---|---|---|
| Conservative | Nigel Waterson | 21,033 | 43.5 | −0.6 | |
| Liberal Democrat | Stephen Lloyd | 19,909 | 41.1 | +1.8 | |
| Labour | Andrew Jones | 5,268 | 10.9 | −2.4 | |
| UKIP | Andrew Meggs | 1,233 | 2.5 | +0.5 | |
| Green | Clive Gross | 949 | 2.0 | N/A | |
| Majority | 1,124 | 2.3 | |||
| Turnout | 48,392 | 64.8 | +5.2 | ||
| Conservative hold | Swing | ||||
| Party | Candidate | Votes | % | ± | |
|---|---|---|---|---|---|
| Conservative | Nigel Waterson | 19,738 | 44.1 | +2.0 | |
| Liberal Democrat | Chris Berry | 17,584 | 39.3 | +0.9 | |
| Labour | Gillian Roles | 5,967 | 13.3 | +0.8 | |
| UKIP | Barry Jones | 907 | 2.0 | +1.5 | |
| Liberal | Theresia Williamson | 574 | 1.3 | −0.1 | |
| Majority | 2,154 | 4.8 | |||
| Turnout | 44,770 | 59.6 | −13.2 | ||
| Conservative hold | Swing | ||||
Elections in the 1990s
| Party | Candidate | Votes | % | ± | |
|---|---|---|---|---|---|
| Conservative | Nigel Waterson | 22,183 | 42.1 | −10.9 | |
| Liberal Democrat | Chris Berry | 20,189 | 38.3 | −2.9 | |
| Labour | David Lines | 6,576 | 12.5 | +7.8 | |
| Referendum | Trevor Lowe | 2,724 | 5.2 | N/A | |
| Liberal | Theresia Williamson | 741 | 1.4 | ||
| Natural Law | John Dawkins | 254 | 0.5 | N/A | |
| Majority | 1,994 | 3.8 | |||
| Turnout | 52,667 | 72.8 | |||
| Conservative hold | Swing | ||||
This constituency underwent boundary changes between the 1992 and 1997 general elections and thus change in share of vote is based on a notional calculation.
| Party | Candidate | Votes | % | ± | |
|---|---|---|---|---|---|
| Conservative | Nigel Waterson | 31,792 | 51.6 | −8.3 | |
| Liberal Democrat | David Bellotti | 26,311 | 42.7 | +13.0 | |
| Labour | Ivan A. Gibbons | 2,834 | 4.6 | −4.2 | |
| Green | David Aherne | 391 | 0.6 | −0.9 | |
| Liberal | MT Williamson | 296 | 0.5 | −29.3 | |
| Majority | 5,481 | 8.9 | −21.3 | ||
| Turnout | 61,624 | 80.9 | +5.3 | ||
| Conservative hold | Swing | −10.7 | |||
| Party | Candidate | Votes | % | ± | |
|---|---|---|---|---|---|
| Liberal Democrat | David Bellotti | 23,415 | 50.8 | +21.1 | |
| Conservative | Richard Hickmet | 18,865 | 41.0 | -18.9 | |
| Labour | Charlotte Atkins | 2,308 | 5.0 | -3.8 | |
| Green | David Aherne | 553 | 1.2 | -0.4 | |
| Liberal | Theresia Williamson | 526 | 1.1 | N/A | |
| Corrective Party | Lady Whiplash | 216 | 0.5 | N/A | |
| National Front | John McAuley | 154 | 0.3 | ||
| Ironside Party | Eric Page | 35 | 0.1 | ||
| Majority | 4,550 | 9.8 | |||
| Turnout | 46,072 | 60.7 | -14.9 | ||
| Liberal Democrat gain from Conservative | Swing | ||||
Elections in the 1980s
| Party | Candidate | Votes | % | ± | |
|---|---|---|---|---|---|
| Conservative | Ian Gow | 33,587 | 59.9 | ||
| Liberal | Peter Driver | 16,664 | 29.7 | ||
| Labour | Ash Patel | 4,928 | 8.8 | ||
| Green | Ruth Addison | 867 | 1.6 | ||
| Majority | 16,923 | 30.2 | |||
| Turnout | 56,046 | 75.6 | |||
| Conservative hold | Swing | ||||
| Party | Candidate | Votes | % | ± | |
|---|---|---|---|---|---|
| Conservative | Ian Gow | 31,501 | 59.1 | ||
| Liberal | Peter Driver | 18,015 | 33.8 | ||
| Labour | Charles Clark | 3,790 | 7.1 | ||
| Majority | 13,486 | 25.3 | |||
| Turnout | 53,306 | 73.0 | |||
| Conservative hold | Swing | ||||
Elections in the 1970s
| Party | Candidate | Votes | % | ± | |
|---|---|---|---|---|---|
| Conservative | Ian Gow | 37,168 | 63.05 | ||
| Liberal | David Bellotti | 11,084 | 18.80 | ||
| Labour | Len Caine | 10,166 | 17.24 | ||
| National Front | C Mitchell | 533 | 0.90 | ||
| Majority | 26,084 | 44.25 | |||
| Turnout | 58,951 | 76.68 | |||
| Conservative hold | Swing | ||||
| Party | Candidate | Votes | % | ± | |
|---|---|---|---|---|---|
| Conservative | Ian Gow | 30,442 | 54.66 | ||
| Liberal | Gurth Hoyer-Millar | 14,417 | 25.89 | ||
| Labour | Len Caine | 10,830 | 19.45 | ||
| Majority | 16,025 | 28.78 | |||
| Turnout | 55,689 | 74.55 | |||
| Conservative hold | Swing | ||||
| Party | Candidate | Votes | % | ± | |
|---|---|---|---|---|---|
| Conservative | Ian Gow | 31,462 | 51.31 | ||
| Liberal | Stephen Terrell | 23,987 | 39.12 | ||
| Labour | David Dawson | 5,874 | 9.58 | ||
| Majority | 7,475 | 12.19 | |||
| Turnout | 61,323 | 82.60 | |||
| Conservative hold | Swing | ||||
| Party | Candidate | Votes | % | ± | |
|---|---|---|---|---|---|
| Conservative | Charles Taylor | 30,296 | 48.80 | ||
| Liberal | Stephen Terrell | 23,308 | 37.55 | +7.8 | |
| Labour | Cyril George Abley | 8,475 | 13.65 | ||
| Majority | 6,988 | 11.26 | |||
| Turnout | 62,079 | 73.67 | |||
| Conservative hold | Swing | - | |||
Elections in the 1960s
| Party | Candidate | Votes | % | ± | |
|---|---|---|---|---|---|
| Conservative | Charles Taylor | 26,039 | 46.26 | ||
| Liberal | Stephen Terrell | 16,746 | 29.75 | ||
| Labour | John Harold High | 12,620 | 22.42 | ||
| Independent | Vernon Hubert Petty | 883 | 1.57 | ||
| Majority | 9,293 | 16.51 | |||
| Turnout | 56,288 | 77.24 | |||
| Conservative hold | Swing | ||||
| Party | Candidate | Votes | % | ± | |
|---|---|---|---|---|---|
| Conservative | Charles Taylor | 26,410 | 49.01 | ||
| Liberal | Stephen Terrell | 15,441 | 28.66 | ||
| Labour Co-op | Joan E. M. Baker | 12,034 | 22.33 | ||
| Majority | 10,969 | 20.36 | |||
| Turnout | 53,885 | 76.70 | |||
| Conservative hold | Swing | ||||
Elections in the 1950s
| Party | Candidate | Votes | % | ± | |
|---|---|---|---|---|---|
| Conservative | Charles Taylor | 27,874 | 57.28 | ||
| Labour | Anthony Albert Dumont | 11,837 | 24.32 | ||
| Liberal | Ronald Gardner-Thorpe | 8,955 | 18.40 | ||
| Majority | 16,037 | 32.95 | |||
| Turnout | 48,666 | 77.28 | |||
| Conservative hold | Swing | ||||
| Party | Candidate | Votes | % | ± | |
|---|---|---|---|---|---|
| Conservative | Charles Taylor | 29,779 | 65.68 | ||
| Labour | John A. Lewis | 15,561 | 34.32 | ||
| Majority | 14,218 | 31.36 | |||
| Turnout | 75.81 | ||||
| Conservative hold | Swing | ||||
| Party | Candidate | Votes | % | ± | |
|---|---|---|---|---|---|
| Conservative | Charles Taylor | 39,278 | 67.15 | ||
| Labour | Christopher Attlee | 19,217 | 32.85 | ||
| Majority | 20,061 | 34.30 | |||
| Turnout | 81.93 | ||||
| Conservative hold | Swing | ||||
| Party | Candidate | Votes | % | ± | |
|---|---|---|---|---|---|
| Conservative | Charles Taylor | 35,425 | 59.54 | ||
| Labour | Reginald Groves | 18,304 | 30.77 | ||
| Liberal | Cecil Herbert Louis Douglas Bate | 5,766 | 9.69 | ||
| Majority | 17,121 | 28.78 | |||
| Turnout | 85.08 | ||||
| Conservative hold | Swing | ||||
Election in the 1940s
| Party | Candidate | Votes | % | ± | |
|---|---|---|---|---|---|
| Conservative | Charles Taylor | 18,173 | 53.24 | ||
| Labour | Duncan Newman Smith | 12,637 | 37.02 | ||
| Liberal | John Stafford Gowland | 2,797 | 8.19 | ||
| Independent National | Reg Hipwell | 524 | 1.54 | ||
| Majority | 5,536 | 16.22 | |||
| Turnout | 77.35 | ||||
| Conservative hold | Swing | ||||
Elections in the 1930s
| Party | Candidate | Votes | % | ± | |
|---|---|---|---|---|---|
| Conservative | Charles Taylor | Unopposed | n/a | n/a | |
| Conservative hold | Swing | n/a | |||
| Party | Candidate | Votes | % | ± | |
|---|---|---|---|---|---|
| Conservative | Charles Taylor | Unopposed | n/a | n/a | |
| Conservative hold | Swing | n/a | |||
| Party | Candidate | Votes | % | ± | |
|---|---|---|---|---|---|
| Conservative | John Slater | Unopposed | n/a | n/a | |
| Conservative hold | Swing | n/a | |||
| Party | Candidate | Votes | % | ± | |
|---|---|---|---|---|---|
| Conservative | Edward Marjoribanks | 31,240 | 85.31 | ||
| Labour | A.J. Marshall | 5,379 | 14.69 | ||
| Majority | 25,861 | 70.62 | |||
| Turnout | 71.86 | ||||
| Conservative hold | Swing | ||||
Elections in the 1920s
| Party | Candidate | Votes | % | ± | |
|---|---|---|---|---|---|
| Unionist | Edward Marjoribanks | 18,157 | 49.9 | -8.5 | |
| Labour | R S Chatfield | 8,204 | 22.5 | +5.6 | |
| Liberal | Clive Stuart Saxon Burt | 7,812 | 21.4 | -3.3 | |
| Independent Unionist | P E Hurst | 2,277 | 6.2 | n/a | |
| Majority | 9,953 | 27.4 | -6.3 | ||
| Turnout | 36,450 | 74.5 | |||
| Unionist hold | Swing | -7.0 | |||
| Party | Candidate | Votes | % | ± | |
|---|---|---|---|---|---|
| Unionist | William Reginald Hall | 12,741 | 58.4 | -9.5 | |
| Liberal | Harcourt Johnstone | 5,386 | 24.7 | +8.6 | |
| Labour | Thomas Williams | 3,696 | 16.9 | +0.9 | |
| Majority | 7,355 | 33.7 | -18.1 | ||
| Turnout | 21,823 | 60.7 | -14.9 | ||
| Unionist hold | Swing | -9.0 | |||
| Party | Candidate | Votes | % | ± | |
|---|---|---|---|---|---|
| Unionist | George Lloyd | 17,533 | 67.9 | +14.1 | |
| Liberal | J J Davies | 4,168 | 16.1 | -30.1 | |
| Labour | D J Davis | 4,138 | 16.0 | n/a | |
| Majority | 13,365 | 51.8 | +44.2 | ||
| Turnout | 25,839 | 77.6 | |||
| Unionist hold | Swing | +22.1 | |||
| Party | Candidate | Votes | % | ± | |
|---|---|---|---|---|---|
| Unionist | Rupert Gwynne | 13,276 | 53.8 | -6.7 | |
| Liberal | Thomas Wiles | 11,396 | 46.2 | +6.7 | |
| Majority | 1,880 | 7.6 | -13.4 | ||
| Turnout | 77.0 | ||||
| Unionist hold | Swing | -6.7 | |||
| Party | Candidate | Votes | % | ± | |
|---|---|---|---|---|---|
| Unionist | Rupert Gwynne | 14,601 | 60.5 | -3.1 | |
| Liberal | Edward Duke | 9,550 | 39.5 | +29.1 | |
| Majority | 5,051 | 21.0 | -16.6 | ||
| Turnout | 77.2 | ||||
| Unionist hold | Swing | -16.1 | |||
Elections in the 1910s
| Party | Candidate | Votes | % | ± | |
|---|---|---|---|---|---|
| C | Unionist | Rupert Gwynne | 11,357 | 63.6 | +5.3 |
| Labour | Thomas Burleigh Hasdell | 4,641 | 26.0 | N/A | |
| Liberal | Alfred John Callaghan | 1,852 | 10.4 | −31.3 | |
| Majority | 6,716 | 37.6 | +21.0 | ||
| Turnout | 17,850 | 59.8 | −23.4 | ||
| Unionist hold | Swing | +18.3 | |||
| C indicates candidate endorsed by the coalition government. | |||||
General Election 1914/15:
Another General Election was required to take place before the end of 1915. The political parties had been making preparations for an election to take place and by July 1914, the following candidates had been selected;
- Unionist: Rupert Gwynne
- Liberal:
| Party | Candidate | Votes | % | ± | |
|---|---|---|---|---|---|
| Conservative | Rupert Gwynne | 6,873 | 58.3 | −0.7 | |
| Liberal | Hector Morison | 4,920 | 41.7 | +0.7 | |
| Majority | 1,953 | 16.6 | −1.4 | ||
| Turnout | 11,793 | 83.2 | −7.1 | ||
| Registered electors | 14,172 | ||||
| Conservative hold | Swing | −0.7 | |||
| Party | Candidate | Votes | % | ± | |
|---|---|---|---|---|---|
| Conservative | Rupert Gwynne | 7,553 | 59.0 | +11.8 | |
| Liberal | Hector Morison | 5,249 | 41.0 | −11.8 | |
| Majority | 2,304 | 18.0 | N/A | ||
| Turnout | 12,802 | 90.3 | +3.3 | ||
| Registered electors | 14,172 | ||||
| Conservative gain from Liberal | Swing | +11.8 | |||
Elections in the 1900s
| Party | Candidate | Votes | % | ± | |
|---|---|---|---|---|---|
| Conservative | Lindsay Hogg | 4,948 | 53.8 | +3.4 | |
| Liberal | Thomas Seymour Brand | 4,254 | 46.2 | −3.4 | |
| Majority | 694 | 7.6 | +6.8 | ||
| Turnout | 9,202 | 81.8 | +4.0 | ||
| Registered electors | 11,248 | ||||
| Conservative hold | Swing | +3.4 | |||
| Party | Candidate | Votes | % | ± | |
|---|---|---|---|---|---|
| Liberal | Hubert Beaumont | 5,933 | 52.8 | +6.6 | |
| Conservative | Lindsay Hogg | 5,303 | 47.2 | -6.6 | |
| Majority | 630 | 5.6 | N/A | ||
| Turnout | 11,236 | 87.0 | +5.2 | ||
| Registered electors | 12,913 | ||||
| Liberal gain from Conservative | Swing | +6.6 | |||
Elections in the 1890s
| Party | Candidate | Votes | % | ± | |
|---|---|---|---|---|---|
| Conservative | Edward Field | 4,037 | 52.4 | −7.7 | |
| Liberal | Thomas Seymour Brand | 3,674 | 47.6 | +7.7 | |
| Majority | 363 | 4.8 | −15.4 | ||
| Turnout | 7,711 | 76.9 | +3.3 | ||
| Registered electors | 10,029 | ||||
| Conservative hold | Swing | −7.7 | |||
| Party | Candidate | Votes | % | ± | |
|---|---|---|---|---|---|
| Conservative | Edward Field | 4,139 | 50.4 | −2.0 | |
| Liberal | Thomas Seymour Brand | 4,079 | 49.6 | +2.0 | |
| Majority | 60 | 0.8 | −4.0 | ||
| Turnout | 8,218 | 77.8 | +0.9 | ||
| Registered electors | 10,563 | ||||
| Conservative hold | Swing | −2.0 | |||
Elections in the 1880s
| Party | Candidate | Votes | % | ± | |
|---|---|---|---|---|---|
| Conservative | Edward Field | 3,760 | 60.1 | +9.6 | |
| Liberal | James Clifton Brown[27] | 2,501 | 39.9 | −9.6 | |
| Majority | 1,259 | 20.2 | +19.2 | ||
| Turnout | 6,261 | 73.6 | −9.4 | ||
| Registered electors | 8,504 | ||||
| Conservative hold | Swing | +9.6 | |||
| Party | Candidate | Votes | % | ± | |
|---|---|---|---|---|---|
| Conservative | Edward Field | 3,561 | 50.5 | N/A | |
| Liberal | George Ambrose Wallis | 3,497 | 49.5 | N/A | |
| Majority | 64 | 1.0 | N/A | ||
| Turnout | 7,058 | 83.0 | N/A | ||
| Registered electors | 8,504 | ||||
| Conservative win (new seat) | |||||
See also
Notes and references
- Notes
- ↑ A borough constituency having first been the alternative form, a county constituency, for the sole modern purposes of election expenses and type of returning officer.
- ↑ As with all constituencies, the constituency elects one Member of Parliament (MP) by the first past the post system of election at least every five years.
- References
- ↑ "Eastbourne – Election Results". House of Commons Library. May 2015. Retrieved 16 June 2015.
- ↑ Leigh Rayment's Historical List of MPs – Constituencies beginning with "E" (part 1)
- ↑ "Electoral Commission – Previous UK general elections". www.electoralcommission.org.uk.
- ↑ List of Conservative MPs elected in 2015 by % majority UK Political.info. Retrieved 2017-01-29
- ↑ Williams, Sharon. "What's In A Name? Should Eastbourne Officially Add Willingdon?". www.eastbournebuzz.co.uk.
- ↑ "The Conservative candidates running to be MPs". 27 April 2017.
- ↑ http://www.libdems.org.uk/ (30 June 2014). "Stephen Lloyd".
- ↑ "BBC Election Results". 9 June 2017. Retrieved 9 June 2017.
- ↑ "Election Data 2015". Electoral Calculus. Archived from the original on 17 October 2015. Retrieved 17 October 2015.
- ↑ "Eastbourne parliamentary constituency – Election 2017" – via www.bbc.co.uk.
- ↑ "Election Data 2010". Electoral Calculus. Archived from the original on 17 October 2015. Retrieved 17 October 2015.
- ↑ "Eastborne election results". BBC. 20 April 2010. Retrieved 20 April 2010.
- ↑ "Election Data 2005". Electoral Calculus. Archived from the original on 15 October 2011. Retrieved 18 October 2015.
- ↑ "Election Data 2001". Electoral Calculus. Archived from the original on 15 October 2011. Retrieved 18 October 2015.
- ↑ "Election Data 1997". Electoral Calculus. Archived from the original on 15 October 2011. Retrieved 18 October 2015.
- ↑ "Election Data 1992". Electoral Calculus. Archived from the original on 15 October 2011. Retrieved 18 October 2015.
- ↑ "Politics Resources". Election 1992. Politics Resources. 9 April 1992. Retrieved 2010-12-06.
- ↑ "Election Data 1987". Electoral Calculus. Archived from the original on 15 October 2011. Retrieved 18 October 2015.
- ↑ "Election Data 1983". Electoral Calculus. Archived from the original on 15 October 2011. Retrieved 18 October 2015.
- ↑
- 1 2 3 F W S Craig, British Parliamentary Election Results 1918–1949; Political Reference Publications, Glasgow 1949
- 1 2 3 Craig, F. W. S. (1983). British parliamentary election results 1918–1949 (3 ed.). Chichester: Parliamentary Research Services. ISBN 0-900178-06-X.
- 1 2 Debrett's House of Commons & Judicial Bench, 1916
- 1 2 3 4 5 6 7 Craig, FWS, ed. (1974). British Parliamentary Election Results: 1885-1918. London: Macmillan Press. ISBN 9781349022984.
- 1 2 3 4 5 6 The Liberal Year Book, 1907
- 1 2 Debrett's House of Commons & Judicial Bench, 1901
- ↑ "Meeting of the Council". Eastbourne Gazette. 23 Jun 1886. p. 8. Retrieved 25 November 2017 – via British Newspaper Archive. (Subscription required (help)).
- ↑ Debrett's House of Commons & Judicial Bench, 1886
Sources
- Election result, 2005 (BBC)
- Election results, 1997–2001 (BBC)
- Election results, 1997–2001 (Election Demon)
- Election results, 1983–1992
- Election results, 1992–2005 (Guardian)
- Election results, 1950–2001 (Keele University)
- The Times House of Commons 1945. The Times. 1945.
- Iain Dale, ed. (2003). The Times House of Commons 1929, 1931, 1935. Politico's (reprint). ISBN 1-84275-033-X.
- Craig, F. W. S. (1983) [1969]. British parliamentary election results 1918–1949 (3rd ed.). Chichester: Parliamentary Research Services. ISBN 0-900178-06-X.