United Kingdom general election, 1859
|
| 28 April – 18 May 1859 (1859-04-28 – 1859-05-18) |
|
|
|
All 654 seats in the House of Commons
328 seats needed for a majority |
|---|
|
|
.svg.png) Largest party in each constituent country |
|
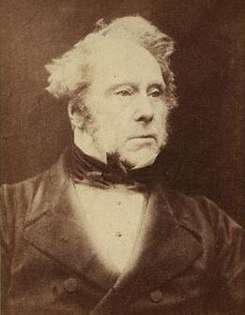
In the 1859 United Kingdom general election, the Whigs, led by Lord Palmerston, held their majority in the House of Commons over the Earl of Derby's Conservatives. This election is also considered to be the first to be contested by the Liberal Party—a name unofficially adopted to cover the alliance of Whigs, Peelites, Radicals and Irish Brigade who had previously voted against the Derby administration in the House of Commons that had led to the election. It was also the last general election entered by the Chartists, before their organisation was dissolved. As of 2018 this is the last election in which the Conservatives won the most seats in Wales,[1] as well as being the last election to date in which the Conservative Party took less than a third of the vote in England.
The election was the quietest and least competitive between 1832 and 1885, with most county elections being uncontested. The election also saw the lowest number of candidates between 1832 and 1885, with Tory gains potentially being the result of a lack of opposition as much as a change in public opinion.[2]
Results
| UK General Election 1859 |
| Party |
Candidates |
Votes |
| Stood |
Elected |
Gained |
Unseated |
Net |
% of total |
% |
№ |
Net % |
| |
Liberal |
|
356 |
|
|
−21 |
54.43 |
65.80 |
372,117 |
−0.2 |
| |
Conservative |
|
298 |
|
|
+34 |
45.57 |
34.17 |
193,232 |
+0.3 |
| |
Chartist |
|
0 |
0 |
0 |
0 |
0 |
0.03 |
151 |
−0.1 |
Regional results
Great Britain
| Party |
Candidates |
Unopposed |
Seats |
Seats change |
Votes |
% |
% change |
|---|
|
Liberal |
392 |
157 |
306 |
|
314,708 |
66.6 |
|
|
Conservative & Peelites |
327 |
160 |
245 |
|
157,974 |
33.4 |
|
|
Chartist |
1 |
0 |
0 |
|
151 |
0.0 |
|
| Total |
720 |
317 |
551 |
 |
472,833 |
100 |
|
England
| Party |
Candidates |
Unopposed |
Seats |
Seats change |
Votes |
% |
% change |
|---|
|
Liberal |
330 |
109 |
251 |
|
307,949 |
67.1 |
|
|
Conservative & Peelite |
286 |
129 |
209 |
|
152,591 |
32.9 |
|
|
Chartist |
1 |
0 |
0 |
|
151 |
0.0 |
|
| Total |
617 |
238 |
460 |
|
460,691 |
100 |
|
Scotland
| Party |
Candidates |
Unopposed |
Seats |
Seats change |
Votes |
% |
% change |
|---|
|
Liberal |
44 |
34 |
40 |
|
5,174 |
66.4 |
|
|
Conservative & Peelite |
17 |
11 |
13 |
|
2,616 |
33.6 |
|
| Total |
61 |
45 |
53 |
|
7,790 |
100 |
|
Wales
| Party |
Candidates |
Unopposed |
Seats |
Seats change |
Votes |
% |
% change |
|---|
|
Conservative & Peelite |
18 |
14 |
17 |
|
2,767 |
63.6 |
|
|
Liberal |
18 |
14 |
15 |
|
1,585 |
36.4 |
|
| Total |
36 |
28 |
32 |
|
4,352 |
100 |
|
Ireland
| Party |
Candidates |
Unopposed |
Seats |
Seats change |
Votes |
% |
% change |
|---|
|
Irish Conservative & Peelite |
67 |
36 |
53 |
|
35,258 |
38.9 |
|
|
Liberal |
73 |
26 |
50 |
|
57,409 |
61.1 |
|
| Total |
140 |
62 |
103 |
|
92,667 |
100 |
|
Universities
| Party |
Candidates |
Unopposed |
Seats |
Seats change |
Votes |
% |
% change |
|---|
|
Conservative & Peelite |
6 |
6 |
6 |
|
|
|
|
| Total |
6 |
6 |
6 |
|
|
100 |
|
.jpg)