North Norfolk (UK Parliament constituency)
| North Norfolk | |
|---|---|
|
County constituency for the House of Commons | |
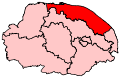 Boundary of North Norfolk in Norfolk. | |
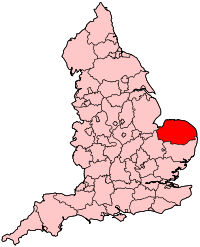 Location of Norfolk within England. | |
| County | Norfolk |
| Electorate | 68,277 (December 2010)[1] |
| Current constituency | |
| Created | 1868 |
| Member of parliament | Norman Lamb (Liberal Democrat) |
| Number of members | one (two 1868-1885) |
| Created from |
West Norfolk East Norfolk |
| Overlaps | |
| European Parliament constituency | East of England |
North Norfolk is a parliamentary constituency represented in the House of Commons of the Parliament of the United Kingdom. It elects one Member of Parliament (MP) by the first past the post system of election.
Formerly a seat held by the Conservatives from 1970 to 2001, it has been represented by the Liberal Democrat Norman Lamb since 2001. This marked the first time that a Liberal aligned candidate had won a seat in Norfolk since 1929. This was to be followed by the election of Simon Wright in Norwich South in 2010. While Wright's success was short-lived (he was defeated in 2015), Lamb has retained his seat, which is after the 2015 election was one of only two Liberal Democrat seats in southern England, and one of only eight in the whole UK. In the 2017 election, in which the Liberal Democrats lost five of their nine seats, North Norfolk was one of the four held. Although the seat had been held by Labour for the 25 years following World War II, Labour have slumped to a distant third in recent years, and came fourth in 2015, and last in a narrower field of three candidates in 2017.
North Norfolk was described by the Earl of Leicester as "the one constituency in England where, in 1964, it was so feudal that it had to be explained to the electors that the ballot was secret."[2]
Boundaries
1868-1885: The Hundreds of East Flegg, West Flegg, Happing, Tunstead, Erpingham (North), Erpingham (South), Eynsford, Holt and North Greenhoe.[3]
1885-1918: The Sessional Divisions of Eynsford, Holt, North Erpingham, and North Greenhoe, and part of the Sessional Division of South Erpingham.
1918-1950: The Urban Districts of Cromer, Sheringham, and Wells-next-the-Sea, and the Rural Districts of Aylsham, Erpingham, and Walsingham.
1950-1974: The Urban Districts of Cromer, North Walsham, Sheringham, and Wells-next-the-Sea, and the Rural Districts of Erpingham, Smallburgh, and Walsingham.
1974-1983: The Urban Districts of Cromer, North Walsham, and Sheringham, and the Rural Districts of Erpingham, St Faith's and Aylsham, and Smallburgh.
1983-2010: The District of North Norfolk.
2010-present: The District of North Norfolk wards of Briston, Chaucer, Corpusty, Cromer Town, Erpingham, Gaunt, Glaven Valley, Happisburgh, High Heath, Holt, Hoveton, Mundesley, North Walsham East, North Walsham North, North Walsham West, Poppyland, Priory, Roughton, St Benet, Scottow, Sheringham North, Sheringham South, Stalham and Sutton, Suffield Park, The Runtons, Waterside, Waxham, and Worstead.
Members of Parliament
MPs 1868–1885
| Election | 1st Member[4] | 1st Party | 2nd Member[4] | 2nd Party | ||
|---|---|---|---|---|---|---|
| 1868 | constituency created | |||||
| 1868 | Frederick Walpole | Conservative | Sir Edmund Lacon | Conservative | ||
| 1876 by-election | James Duff | Conservative | ||||
| 1879 by-election | Edward Birkbeck | Conservative | ||||
| 1885 | reduced to one member | |||||
MPs since 1885
Elections
Elections in the 2010s
| Party | Candidate | Votes | % | ± | |
|---|---|---|---|---|---|
| Liberal Democrat | Norman Lamb | 25,260 | 48.4 | +9.3 | |
| Conservative | James Wild | 21,748 | 41.7 | +10.8 | |
| Labour | Stephen Burke | 5,180 | 9.9 | -0.3 | |
| Majority | 3,512 | 6.7 | -1.5 | ||
| Turnout | 52,188 | 75.3 | +3.6 | ||
| Liberal Democrat hold | Swing | -0.8 | |||
| Party | Candidate | Votes | % | ± | |
|---|---|---|---|---|---|
| Liberal Democrat | Norman Lamb | 19,299 | 39.1 | -16.4 | |
| Conservative | Ann Steward | 15,256 | 30.9 | -1.2 | |
| UKIP | Michael Baker | 8,328 | 16.9 | +11.5 | |
| Labour | Denise Burke | 5,043 | 10.2 | +4.4 | |
| Green | Mike Macartney-Filgate | 1,488 | 3.0 | +2.0 | |
| Majority | 4,043 | 8.2 | |||
| Turnout | 49,414 | 71.7 | -1.5 | ||
| Liberal Democrat hold | Swing | -7.6 | |||
| Party | Candidate | Votes | % | ± | |
|---|---|---|---|---|---|
| Liberal Democrat | Norman Lamb | 27,554 | 55.5 | +2.3 | |
| Conservative | Trevor Ivory | 15,928 | 32.1 | -3.9 | |
| Labour | Phil Harris | 2,896 | 5.8 | -3.1 | |
| UKIP | Michael Baker | 2,680 | 5.4 | +3.7 | |
| Green | Andrew Boswell | 508 | 1.0 | +1.0 | |
| Independent | Simon Mann | 95 | 0.2 | +0.2 | |
| Majority | 11,626 | 23.4 | |||
| Turnout | 49,661 | 73.2 | +0.5 | ||
| Liberal Democrat hold | Swing | +3.1 | |||
Elections in the 2000s
| Party | Candidate | Votes | % | ± | |
|---|---|---|---|---|---|
| Liberal Democrat | Norman Lamb | 31,515 | 53.4 | +10.7 | |
| Conservative | Iain Dale | 20,909 | 35.5 | −6.3 | |
| Labour | Phil Harris | 5,447 | 9.2 | −4.1 | |
| UKIP | Stuart Agnew | 978 | 1.7 | +0.6 | |
| Independent | Justin Appleyard | 116 | 0.2 | ||
| Majority | 10,606 | 18.0 | |||
| Turnout | 58,965 | 73.0 | +2.8 | ||
| Liberal Democrat hold | Swing | +8.5 | |||
| Party | Candidate | Votes | % | ± | |
|---|---|---|---|---|---|
| Liberal Democrat | Norman Lamb | 23,978 | 42.7 | +8.4 | |
| Conservative | David Prior | 23,495 | 41.8 | +5.3 | |
| Labour | Mike Gates | 7,490 | 13.3 | -11.7 | |
| Green | Mike Sheridan | 649 | 1.2 | ||
| UKIP | Paul Simison | 608 | 1.1 | ||
| Majority | 483 | 0.9 | |||
| Turnout | 56,220 | 70.2 | -5.8 | ||
| Liberal Democrat gain from Conservative | Swing | +1.5 | |||
Elections in the 1990s
| Party | Candidate | Votes | % | ± | |
|---|---|---|---|---|---|
| Conservative | David Prior | 21,456 | 36.5 | -11.8 | |
| Liberal Democrat | Norman Lamb | 20,163 | 34.3 | +7.0 | |
| Labour | Michael Cullingham | 14,736 | 25.1 | +1.9 | |
| Referendum | John Allen | 2,458 | 4.2 | N/A | |
| Majority | 1,293 | 2.2 | -18.8 | ||
| Turnout | 58,813 | 76.0 | -4.8 | ||
| Conservative hold | Swing | -9.5 | |||
| Party | Candidate | Votes | % | ± | |
|---|---|---|---|---|---|
| Conservative | Ralph Howell | 28,810 | 48.3 | -5.0 | |
| Liberal Democrat | Norman Lamb | 16,265 | 27.3 | +2.3 | |
| Labour | Michael Cullingham | 13,850 | 23.2 | +3.3 | |
| Green | Angie Zelter | 559 | 0.9 | -0.8 | |
| Natural Law | S Jackson | 167 | 0.3 | N/A | |
| Majority | 12,545 | 21.0 | -7.3 | ||
| Turnout | 59,651 | 80.8 | +3.3 | ||
| Conservative hold | Swing | -3.6 | |||
Elections in the 1980s
| Party | Candidate | Votes | % | ± | |
|---|---|---|---|---|---|
| Conservative | Ralph Howell | 28,822 | 53.3 | -0.7 | |
| SDP–Liberal Alliance | Neil Anthony | 13,512 | 25.0 | -1.8 | |
| Labour | Anthony Earle | 10,765 | 19.9 | +0.7 | |
| Green | Michael Filgate | 960 | 1.8 | ||
| Majority | 15,310 | 28.3 | +1.1 | ||
| Turnout | 54,059 | 77.5 | +2.9 | ||
| Conservative hold | Swing | +0.5 | |||
| Party | Candidate | Votes | % | ± | |
|---|---|---|---|---|---|
| Conservative | Ralph Howell | 26,230 | 54.0 | -2.9 | |
| SDP–Liberal Alliance | John Elworthy | 13,007 | 26.8 | +13.0 | |
| Labour | Edward Barber | 9,317 | 19.2 | -9.4 | |
| Majority | 13,223 | 27.2 | -1.1 | ||
| Turnout | 48,554 | 74.6 | -4.1 | ||
| Conservative hold | Swing | ||||
Elections in the 1970s
| Party | Candidate | Votes | % | ± | |
|---|---|---|---|---|---|
| Conservative | Ralph Howell | 43,952 | 56.9 | +8.8 | |
| Labour | R S Dimmick | 22,126 | 28.6 | -3.4 | |
| Liberal | G R Collings | 10,643 | 13.8 | -6.1 | |
| National Front | A C R Sizeland | 548 | 0.7 | ||
| Majority | 21,826 | 28.3 | +12.2 | ||
| Turnout | 72,269 | 78.7 | +2.2 | ||
| Conservative hold | Swing | ||||
| Party | Candidate | Votes | % | ± | |
|---|---|---|---|---|---|
| Conservative | Ralph Howell | 33,312 | 48.1 | +0.5 | |
| Labour | D M Mason | 22,191 | 32.0 | +3.4 | |
| Liberal | R G Moore | 13,776 | 19.9 | -3.9 | |
| Majority | 11,121 | 16.1 | -2.9 | ||
| Turnout | 69,279 | 76.5 | -6.9 | ||
| Conservative hold | Swing | ||||
| Party | Candidate | Votes | % | ± | |
|---|---|---|---|---|---|
| Conservative | Ralph Howell | 35,684 | 47.6 | -7.7 | |
| Labour | D M Mason | 21,394 | 28.6 | -16.1 | |
| Liberal | R G Moore | 17,853 | 23.8 | ||
| Majority | 14,290 | 19.0 | +8.5 | ||
| Turnout | 74,931 | 83.4 | +3.1 | ||
| Conservative hold | Swing | ||||
| Party | Candidate | Votes | % | ± | |
|---|---|---|---|---|---|
| Conservative | Ralph Howell | 24,587 | 55.3 | ||
| Labour | Bert Hazell | 19,903 | 44.7 | ||
| Majority | 4,684 | 10.5 | |||
| Turnout | 44,490 | 80.3 | |||
| Conservative gain from Labour | Swing | ||||
Elections in the 1960s
| Party | Candidate | Votes | % | ± | |
|---|---|---|---|---|---|
| Labour | Bert Hazell | 20,796 | 50.90 | ||
| Conservative | Ralph Howell | 20,059 | 49.10 | ||
| Majority | 737 | 1.80 | |||
| Turnout | 83.19 | ||||
| Labour hold | Swing | ||||
| Party | Candidate | Votes | % | ± | |
|---|---|---|---|---|---|
| Labour | Bert Hazell | 19,370 | 50.1 | ||
| Conservative | Frank Henry Easton | 19,303 | 49.9 | ||
| Majority | 53 | 0.14 | 0.7 | ||
| Turnout | 79.75 | ||||
| Labour hold | Swing | ||||
Elections in the 1950s
| Party | Candidate | Votes | % | ± | |
|---|---|---|---|---|---|
| Labour | Edwin Gooch | 19,784 | 50.85 | ||
| Conservative and National Liberal | Frank Henry Easton | 19,126 | 49.15 | ||
| Majority | 658 | 1.69 | |||
| Turnout | 79.81 | ||||
| Labour hold | Swing | ||||
| Party | Candidate | Votes | % | ± | |
|---|---|---|---|---|---|
| Labour | Edwin Gooch | 20,899 | 51.53 | ||
| National Liberal and Conservative | William Scarlett Jameson | 19,657 | 48.47 | ||
| Majority | 1,242 | 3.06 | |||
| Turnout | 81.64 | ||||
| Labour hold | Swing | ||||
| Party | Candidate | Votes | % | ± | |
|---|---|---|---|---|---|
| Labour | Edwin Gooch | 21,067 | 50.33 | ||
| Conservative and National Liberal | Douglas M Reid | 20,788 | 49.67 | ||
| Majority | 279 | 0.67 | |||
| Turnout | 83.66 | ||||
| Labour hold | Swing | ||||
| Party | Candidate | Votes | % | ± | |
|---|---|---|---|---|---|
| Labour | Edwin Gooch | 19,790 | 47.99 | ||
| Conservative and National Liberal | Douglas M Reid | 17,741 | 43.03 | ||
| Liberal | Arnold Jones | 3,703 | 8.98 | ||
| Majority | 2,049 | 4.97 | |||
| Turnout | 84.31 | ||||
| Labour hold | Swing | ||||
Election in the 1940s
| Party | Candidate | Votes | % | ± | |
|---|---|---|---|---|---|
| Labour | Edwin Gooch | 17,753 | 58.67 | ||
| Conservative | Thomas Cook | 12,507 | 41.33 | ||
| Majority | 5,246 | 17.34 | |||
| Turnout | 70.94 | ||||
| Labour gain from Conservative | Swing | ||||
Elections in the 1930s
| Party | Candidate | Votes | % | ± | |
|---|---|---|---|---|---|
| Conservative | Thomas Cook | 17,863 | 55.26 | ||
| Labour | Lucy Noel-Buxton | 14,465 | 44.74 | ||
| Majority | 3,398 | 10.51 | |||
| Turnout | 78.14 | ||||
| Conservative hold | Swing | ||||
| Party | Candidate | Votes | % | ± | |
|---|---|---|---|---|---|
| Conservative | Thomas Cook | 19,988 | 60.53 | ||
| Labour | Lucy Noel-Buxton | 13,035 | 39.47 | ||
| Majority | 6,953 | 21.06 | |||
| Turnout | 82.27 | ||||
| Conservative gain from Labour | Swing | ||||
| Party | Candidate | Votes | % | ± | |
|---|---|---|---|---|---|
| Labour | Lucy Noel-Buxton | 14,821 | 50.3 | ||
| Conservative | Thomas Cook | 14,642 | 49.7 | ||
| Majority | 179 | 0.6 | |||
| Turnout | 75.0 | ||||
| Labour hold | Swing | ||||
Elections in the 1920s
| Party | Candidate | Votes | % | ± | |
|---|---|---|---|---|---|
| Labour | Noel Buxton | 14,544 | 47.5 | −1.2 | |
| Unionist | Thomas Cook | 12,661 | 41.3 | +0.8 | |
| Liberal | Zelia Hoffman | 3,407 | 11.1 | +0.4 | |
| Majority | 1,883 | 6.2 | −2.0 | ||
| Turnout | 30,612 | 77.9 | +0.8 | ||
| Registered electors | 39,272 | ||||
| Labour hold | Swing | −1.0 | |||
| Party | Candidate | Votes | % | ± | |
|---|---|---|---|---|---|
| Labour | Noel Buxton | 11,978 | 48.7 | −8.9 | |
| Unionist | Thomas Cook | 9,974 | 40.6 | −1.8 | |
| Liberal | Maurice Alexander | 2,637 | 10.7 | N/A | |
| Majority | 2,004 | 8.1 | −7.1 | ||
| Turnout | 24,589 | 77.1 | +8.8 | ||
| Registered electors | 31,913 | ||||
| Labour hold | Swing | −3.6 | |||
| Party | Candidate | Votes | % | ± | |
|---|---|---|---|---|---|
| Labour | Noel Buxton | 12,278 | 57.6 | +5.4 | |
| Unionist | Brian Smith | 9,022 | 42.4 | −5.4 | |
| Majority | 3,256 | 15.2 | +10.8 | ||
| Turnout | 21,300 | 68.3 | −6.9 | ||
| Registered electors | 31,205 | ||||
| Labour hold | Swing | +5.4 | |||
| Party | Candidate | Votes | % | ± | |
|---|---|---|---|---|---|
| Labour | Noel Buxton | 12,004 | 52.2 | N/A | |
| Unionist | Roger Bowan Crewdson | 10,975 | 47.8 | N/A | |
| Majority | 1,029 | 4.4 | N/A | ||
| Turnout | 22,979 | 75.2 | +14.4 | ||
| Registered electors | 30,556 | ||||
| Labour gain from Independent | Swing | N/A | |||
Elections in the 1910s
| Party | Candidate | Votes | % | ± | |
|---|---|---|---|---|---|
| C | Independent Unionist | Douglas King* | 9,274 | 50.6 | +3.8 |
| Liberal | Noel Buxton | 9,061 | 49.4 | −3.8 | |
| Majority | 213 | 1.2 | N/A | ||
| Turnout | 18,335 | 60.8 | −25.9 | ||
| Registered electors | 30,179 | ||||
| Independent Unionist gain from Liberal | Swing | +3.8 | |||
| C indicates candidate endorsed by the coalition government. | |||||
* King was named a Unionist candidate in the official list of Coalition Government endorsements, but he wrote to The Times stating he had left the party before the election and should be classed as an independent. He later rejoined the party.
General Election 1914/15: Another General Election was required to take place before the end of 1915. The political parties had been making preparations for an election to take place and by the July 1914, the following candidates had been selected;
- Liberal: Noel Noel-Buxton
- Unionist: Douglas King
| Party | Candidate | Votes | % | ± | |
|---|---|---|---|---|---|
| Liberal | Noel Noel-Buxton | 5,187 | 53.6 | +0.6 | |
| Conservative | Douglas King | 4,491 | 46.4 | −0.6 | |
| Majority | 696 | 7.2 | +1.2 | ||
| Turnout | 9,678 | 86.7 | −1.0 | ||
| Registered electors | 11,169 | ||||
| Liberal hold | Swing | +0.6 | |||
| Party | Candidate | Votes | % | ± | |
|---|---|---|---|---|---|
| Liberal | Noel Noel-Buxton | 5,189 | 53.0 | −5.7 | |
| Conservative | Douglas King | 4,604 | 47.0 | +5.7 | |
| Majority | 585 | 6.0 | −11.4 | ||
| Turnout | 9,793 | 87.7 | +6.3 | ||
| Registered electors | 11,169 | ||||
| Liberal hold | Swing | −5.7 | |||
Elections in the 1900s
| Party | Candidate | Votes | % | ± | |
|---|---|---|---|---|---|
| Liberal | William Brampton Gurdon | 5,155 | 58.7 | +2.5 | |
| Conservative | F T S Rippingall | 3,628 | 41.3 | −2.5 | |
| Majority | 1,527 | 17.4 | +5.0 | ||
| Turnout | 8,783 | 81.4 | +3.6 | ||
| Registered electors | 10,795 | ||||
| Liberal hold | Swing | +2.5 | |||
| Party | Candidate | Votes | % | ± | |
|---|---|---|---|---|---|
| Liberal | William Brampton Gurdon | 4,490 | 56.2 | +3.0 | |
| Conservative | Henry Spencer Follett | 3,493 | 43.8 | −3.0 | |
| Majority | 997 | 12.4 | +6.0 | ||
| Turnout | 7,983 | 77.8 | −2.7 | ||
| Registered electors | 10,261 | ||||
| Liberal hold | Swing | +3.0 | |||
Elections in the 1890s
| Party | Candidate | Votes | % | ± | |
|---|---|---|---|---|---|
| Liberal | William Brampton Gurdon | 4,775 | 57.0 | +3.8 | |
| Conservative | Kenneth Kemp | 3,610 | 43.0 | −3.8 | |
| Majority | 1,165 | 14.0 | +7.6 | ||
| Turnout | 8,385 | 83.7 | +3.2 | ||
| Registered electors | 10,017 | ||||
| Liberal hold | Swing | +3.8 | |||
- Caused by Cozens-Hardy's appointment as a judge in the Chancery Division of the High Court of Justice.
| Party | Candidate | Votes | % | ± | |
|---|---|---|---|---|---|
| Liberal | Herbert Cozens-Hardy | 4,246 | 53.2 | −5.0 | |
| Conservative | Kenneth Kemp | 3,738 | 46.8 | +5.0 | |
| Majority | 508 | 6.4 | −10.0 | ||
| Turnout | 7,984 | 80.5 | −9.5 | ||
| Registered electors | 9,924 | ||||
| Liberal hold | Swing | −5.0 | |||
| Party | Candidate | Votes | % | ± | |
|---|---|---|---|---|---|
| Liberal | Herbert Cozens-Hardy | 4,561 | 58.2 | +3.1 | |
| Conservative | John Cator[22] | 3,278 | 41.8 | −3.1 | |
| Majority | 1,283 | 16.4 | +6.2 | ||
| Turnout | 7,839 | 90.0 | +14.0 | ||
| Registered electors | 8,713 | ||||
| Liberal hold | Swing | +3.1 | |||
Elections in the 1880s
| Party | Candidate | Votes | % | ± | |
|---|---|---|---|---|---|
| Liberal | Herbert Cozens-Hardy | 4,084 | 55.1 | -5.0 | |
| Conservative | Ailwyn Fellowes | 3,324 | 44.9 | +5.0 | |
| Majority | 760 | 10.2 | -10.0 | ||
| Turnout | 7,408 | 76.0 | -9.9 | ||
| Registered electors | 9,742 | ||||
| Liberal hold | Swing | −5.0 | |||
| Party | Candidate | Votes | % | ± | |
|---|---|---|---|---|---|
| Liberal | Herbert Cozens-Hardy | 5,028 | 60.1 | N/A | |
| Conservative | Samuel Hoare | 3,342 | 39.9 | N/A | |
| Majority | 1,686 | 20.2 | N/A | ||
| Turnout | 8,370 | 85.9 | N/A | ||
| Registered electors | 9,742 | ||||
| Liberal gain from Conservative | Swing | N/A | |||
| Party | Candidate | Votes | % | ± | |
|---|---|---|---|---|---|
| Conservative | Edward Birkbeck | Unopposed | |||
| Conservative | Edmund Lacon | Unopposed | |||
| Registered electors | 6,519 | ||||
| Conservative hold | |||||
| Conservative hold | |||||
Elections in the 1870s
| Party | Candidate | Votes | % | ± | |
|---|---|---|---|---|---|
| Conservative | Edward Birkbeck | 2,742 | 54.9 | N/A | |
| Liberal | Thomas Buxton | 2,252 | 45.1 | N/A | |
| Majority | 490 | 9.8 | N/A | ||
| Turnout | 4,994 | 77.1 | N/A | ||
| Registered electors | 6,474 | ||||
| Conservative hold | |||||
- Caused by Duff's death.
| Party | Candidate | Votes | % | ± | |
|---|---|---|---|---|---|
| Conservative | James Duff | 2,302 | 51.2 | N/A | |
| Liberal | Thomas Buxton | 2,192 | 48.8 | N/A | |
| Majority | 110 | 2.4 | N/A | ||
| Turnout | 4,494 | 72.1 | N/A | ||
| Registered electors | 6,231 | ||||
| Conservative hold | |||||
- Caused by Walpole's death.
| Party | Candidate | Votes | % | ± | |
|---|---|---|---|---|---|
| Conservative | Frederick Walpole | Unopposed | |||
| Conservative | Edmund Lacon | Unopposed | |||
| Registered electors | 6,325 | ||||
| Conservative hold | |||||
| Conservative hold | |||||
Elections in the 1860s
| Party | Candidate | Votes | % | ± | |
|---|---|---|---|---|---|
| Conservative | Frederick Walpole | 2,630 | 27.7 | N/A | |
| Conservative | Edmund Lacon | 2,563 | 27.0 | N/A | |
| Liberal | Edmond Wodehouse | 2,235 | 23.5 | N/A | |
| Liberal | Robert Gurdon[24] | 2,078 | 21.9 | N/A | |
| Majority | 328 | 3.5 | N/A | ||
| Turnout | 4,753 (est) | 73.9 (est) | N/A | ||
| Registered electors | 6,432 | ||||
| Conservative win (new seat) | |||||
| Conservative win (new seat) | |||||
See also
Notes and references
- ↑ "Electorate Figures - Boundary Commission for England". 2011 Electorate Figures. Boundary Commission for England. 4 March 2011. Archived from the original on 6 November 2010. Retrieved 13 March 2011.
- ↑ Obituary of Bert Hazell in The Independent by Tam Dalyell; 22 January 2009. "Archived copy". Archived from the original on 25 February 2009. Retrieved 22 January 2009.
- ↑ "Representation of the People Act 1867" (PDF). Retrieved 2017-07-27.
- 1 2 3 Leigh Rayment's Historical List of MPs – Constituencies beginning with "N" (part 2)
- ↑ "Norfolk North parliamentary constituency – Election 2017 – BBC News". BBC.com. Retrieved 9 June 2017.
- ↑ "Election Data 2015". Electoral Calculus. Archived from the original on 17 October 2015. Retrieved 17 October 2015.
- ↑ "Election Data 2010". Electoral Calculus. Archived from the original on 26 July 2013. Retrieved 17 October 2015.
- ↑ "Election 2010: Norfolk North". BBC News. Retrieved 8 May 2010.
- ↑ "Election Data 2005". Electoral Calculus. Archived from the original on 15 October 2011. Retrieved 18 October 2015.
- ↑ "Election Data 2001". Electoral Calculus. Archived from the original on 15 October 2011. Retrieved 18 October 2015.
- ↑ "Election Data 1997". Electoral Calculus. Archived from the original on 15 October 2011. Retrieved 18 October 2015.
- ↑ "Election Data 1992". Electoral Calculus. Archived from the original on 15 October 2011. Retrieved 18 October 2015.
- ↑ "Politics Resources". Election 1992. Politics Resources. 9 April 1992. Retrieved 2010-12-06.
- ↑ "Election Data 1987". Electoral Calculus. Archived from the original on 15 October 2011. Retrieved 18 October 2015.
- ↑ "Election Data 1983". Electoral Calculus. Archived from the original on 15 October 2011. Retrieved 18 October 2015.
- ↑ http://tools.assembla.com/svn/grodt/uk/thc/files/marked_up/1959_marked_up.txt
- ↑ http://tools.assembla.com/svn/grodt/uk/thc/files/marked_up/1955_marked_up.txt
- ↑ http://tools.assembla.com/svn/grodt/uk/thc/files/marked_up/1951_marked_up.txt
- ↑ http://tools.assembla.com/svn/grodt/uk/thc/files/marked_up/1950_marked_up.txt
- 1 2 3 4 5 British Parliamentary Election Results 1918-1949, FWS Craig
- 1 2 3 4 5 6 7 8 9 British parliamentary election results, 1885-1918 (Craig)
- ↑ "Chapter 5. Personal and Political Finances". Parliamentary History. Blackwell Publishing. 31 (s2): 77–94. 11 October 2012. doi:10.1111/j.1750-0206.2012.00336.x. Retrieved 12 November 2017.
- 1 2 3 4 5 Craig, F. W. S., ed. (1977). British Parliamentary Election Results 1832-1885 (e-book)
|format=requires|url=(help) (1st ed.). London: Macmillan Press. ISBN 978-1-349-02349-3. - ↑ "To the Electors of North Norfolk". Norfolk News. 14 November 1868. p. 8. Retrieved 11 March 2018 – via British Newspaper Archive. (Subscription required (help)).