Newbury (UK Parliament constituency)
| Newbury | |
|---|---|
|
County constituency for the House of Commons | |
|
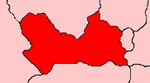
Boundary of Newbury in Berkshire. | |
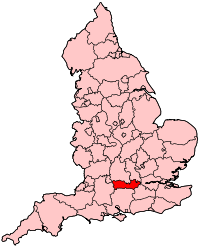 Location of Berkshire within England. | |
| County | Berkshire |
| Electorate | 77,898 (December 2010)[1] |
| Major settlements | Newbury, Thatcham, Hungerford |
| Current constituency | |
| Created | 1885 |
| Member of parliament | Richard Benyon (Conservative) |
| Number of members | One |
| Created from | Berkshire |
| Overlaps | |
| European Parliament constituency | South East England |
Newbury is a constituency[n 1] represented in the House of Commons of the UK Parliament since 2005 by Richard Benyon, a Conservative.[n 2]
Profile
The constituency consists of most of West Berkshire and includes Newbury, Thatcham and Hungerford. To the east, the rest of West Berkshire is incorporated into the Wokingham and Reading West constituencies.[n 3]
Since its creation it has been a Conservative or Liberal/Liberal Democrat seat, sometimes seemingly marginal and sometimes seen as a safe seat, with a tendency towards being Conservative.[n 4] West Berkshire which is similar to its neighbours has a rather thriving economy with the headquarters of the communications company Vodafone that has created a cluster of around 80 mobile phone related businesses in Newbury,[2] while the Lambourn area is the second most important centre for the racehorse industry in Great Britain, employing over 800 people directly, and producing an annual income of £20 million.[3]
West Berkshire is also home to Atomic Weapons Establishment, near Aldermaston, Wolseley plc, Bayer and Pepsico. There are high proportions of detached and semi-detached housing, and lower than average dependency on social housing.[4][5] The seat includes the former family home of Catherine, Duchess of Cambridge, wife of Prince William, Duke of Cambridge in Bucklebury.
- Neighbouring constituencies
The constituencies bordering Newbury (clockwise from north) are: Wantage, Henley, Reading West, Wokingham, Basingstoke, North West Hampshire and Devizes.
Boundaries
.png)
(larger version and key)
1885-1918: The Boroughs of Newbury and Reading, the Sessional Divisions of Ilsley, Lambourn, Newbury (including Hungerford), and Reading (except the parishes of East Swallowfield and West Swallowfield), and part of the Sessional Division of Wokingham.
1918-1950: The Boroughs of Newbury and Wokingham, the Rural Districts of Hungerford and Newbury, and parts of the Rural Districts of Bradfield and Wokingham.
1950-1955: The Borough of Newbury, and the Rural Districts of Bradfield, Hungerford, and Newbury.
1955-1974: The Borough of Newbury, the Rural Districts of Bradfield, Hungerford, and Newbury, and the County Borough of Reading wards of Norcot and Tilehurst.
1974-1983: As 1950 but with redrawn boundaries.
1983-1997: The District of Newbury wards of Aldermaston, Basildon, Beenham, Bradfield, Bucklebury, Burghfield, Chieveley, Cold Ash, Compton, Craven, Downlands, Falkland, Greenham, Hungerford, Kintbury, Lambourn Valley, Mortimer, Northcroft, St John's, Shaw-cum-Donnington, Speen, Thatcham North, Thatcham South, Thatcham West, Turnpike, and Winchcombe.
1997-2010: The District of Newbury wards of Aldermaston, Basildon, Beenham, Bradfield, Bucklebury, Chieveley, Cold Ash, Compton, Craven, Downlands, Falkland, Greenham, Hungerford, Kintbury, Lambourn Valley, Northcroft, St John's, Shaw-cum-Donnington, Speen, Thatcham North, Thatcham South, Thatcham West, Turnpike, and Winchcombe.
2010–present: The District of West Berkshire wards of Aldermaston, Basildon, Bucklebury, Chieveley, Clay Hill, Cold Ash, Compton, Downlands, Falkland, Greenham, Hungerford, Kintbury, Lambourn Valley, Northcroft, St John's, Speen, Thatcham Central, Thatcham North, Thatcham South and Crookham, Thatcham West, and Victoria.
History
Originally, Newbury was part of a larger constituency of Berkshire, which returned two Members of Parliament (MPs), increased to three in the Reform Act of 1832. In the Redistribution of Seats Act of 1885 Berkshire was divided into three county constituencies, Northern (Abingdon), Southern (Newbury), and Eastern (Wokingham), returning one member each and one borough constituency, Reading and two members per constituency ceased, as with most of the country.
The Conservatives have held the constituency for all but seventeen years since the creation of the seat - only three spells of Liberal Party, or Liberal Democrat, majorities have intersected their control. In 2015, the party held the largest majority in the seat since 1935 at 46%, before being reduced to 40.1% in 2017.
Since the February 1974 election, the Liberal Democrats have been one of the two largest parties in the constituency. They most recently gained the seat at the 1993 by-election, holding it until 2005 where it was regained by the Conservatives.
The constituency in 2010 produced the third lowest share of the vote for Labour (4.3%), one of five lost deposits for Labour nationally, below the 5% of the vote deposit threshold.[6][n 5] In 2017, Labour earned its highest share of the vote in Newbury since the October 1974 election with 14.1% of the vote.
It was estimated that the constituency voted 51% in favour of remaining in the European Union during the 2016 referendum on EU membership, with 49% voting to leave.[7]
Members of Parliament
An incumbent MP has been defeated just four times, in the elections of 1906, 1923, 1924, and 2005.
| Election | Member[8] | Party | |
|---|---|---|---|
| 1885 | William George Mount | Conservative | |
| 1900 | William Mount | Conservative | |
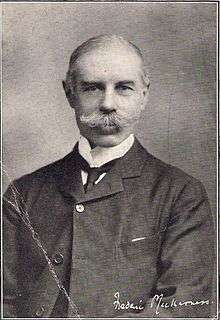
| 1906 | Frederick Coleridge Mackarness | Liberal | |
| 1910 | William Mount | Conservative | |
| 1922 | Howard Clifton Brown | Conservative | |
| 1923 | Innes Harold Stranger | Liberal | |
| 1924 | Howard Clifton Brown | Conservative | |
| 1945 | Anthony Hurd | Conservative | |
| 1964 | John Astor | Conservative | |
| Feb 1974 | Sir Michael McNair-Wilson | Conservative | |
| 1992 | Judith Chaplin | Conservative | |
| 1993 by-election | David Rendel | Liberal Democrat | |
| 2005 | Richard Benyon | Conservative | |
Elections
Elections in the 2010s
| Party | Candidate | Votes | % | ± | |
|---|---|---|---|---|---|
| Conservative | Richard Benyon | 37,399 | 61.5 | +0.4 | |
| Liberal Democrat | Judith Bunting | 13,019 | 21.4 | +6.4 | |
| Labour | Alex Skirvin | 8,596 | 14.1 | +5.7 | |
| Green | Paul Field | 1,531 | 2.5 | -1.5 | |
| Apolitical Democrats | Dave Yates | 304 | 0.5 | +0.1 | |
| Majority | 24,380 | 40.1 | -6.0 | ||
| Turnout | 60,849 | 73.4 | +1.3 | ||
| Conservative hold | Swing | -3.0 | |||
| Party | Candidate | Votes | % | ± | |
|---|---|---|---|---|---|
| Conservative | Richard Benyon | 34,973 | 61.0 | +4.6 | |
| Liberal Democrat | Judith Bunting | 8,605 | 15.0 | -20.5 | |
| UKIP | Catherine Anderson | 6,195 | 10.8 | +8.3 | |
| Labour | Jonny Roberts | 4,837 | 8.4 | +4.2 | |
| Green | Paul Field | 2,324 | 4.1 | +3.2 | |
| Apolitical Democrats | Peter Norman | 228 | 0.4 | +0.2 | |
| Independent | Barrie Singleton | 85 | 0.1 | N/A | |
| Patriotic Socialist Party | Andrew Stott | 53 | 0.1 | N/A | |
| Majority | 26,368 | 46.0 | +25.1 | ||
| Turnout | 57,300 | 72.1 | +1.9 | ||
| Conservative hold | Swing | +12.6 | |||
| Party | Candidate | Votes | % | ± | |
|---|---|---|---|---|---|
| Conservative | Richard Benyon | 33,057 | 56.4 | +7.4 | |
| Liberal Democrat | David Rendel | 20,809 | 35.5 | −7.1 | |
| Labour | Hannah Cooper | 2,505 | 4.3 | −1.7 | |
| UKIP | David Black | 1,475 | 2.5 | +0.9 | |
| Green | Adrian Hollister | 490 | 0.8 | +0.8 | |
| Independent | Brian Burgess | 158 | 0.3 | +0.3 | |
| Apolitical Democrat | David Yates | 95 | 0.2 | +0.2 | |
| Majority | 12,248 | 20.9 | +14.6 | ||
| Turnout | 58,589 | 70.2 | −2.4 | ||
| Conservative hold | Swing | 7.3 | |||
Elections in the 2000s
| Party | Candidate | Votes | % | ± | |
|---|---|---|---|---|---|
| Conservative | Richard Benyon | 26,771 | 49.0 | +5.5 | |
| Liberal Democrat | David Rendel | 23,311 | 42.6 | −5.6 | |
| Labour | Oscar Van Nooijen | 3,239 | 5.9 | −1.0 | |
| UKIP | David McMahon | 857 | 1.6 | +0.3 | |
| Independent | Nick Cornish | 409 | 0.7 | N/A | |
| Independent | Barrie Singleton | 86 | 0.2 | N/A | |
| Majority | 3,460 | 6.3 | N/A | ||
| Turnout | 54,673 | 72.0 | +4.7 | ||
| Conservative gain from Liberal Democrat | Swing | ||||
| Party | Candidate | Votes | % | ± | |
|---|---|---|---|---|---|
| Liberal Democrat | David Rendel | 24,507 | 48.2 | −4.7 | |
| Conservative | Richard Benyon | 22,092 | 43.5 | +5.7 | |
| Labour | Steve Billcliffe | 3,523 | 6.9 | +1.4 | |
| UKIP | Delphine Gray-Fisk | 685 | 1.4 | +0.9 | |
| Majority | 2,415 | 4.8 | −10.3 | ||
| Turnout | 50,807 | 67.3 | −9.0 | ||
| Liberal Democrat hold | Swing | ||||
Elections in the 1990s
| Party | Candidate | Votes | % | ± | |
|---|---|---|---|---|---|
| Liberal Democrat | David Rendel | 29,887 | 52.9 | +15.8 | |
| Conservative | Richard Benyon | 21,370 | 37.8 | −18.1 | |
| Labour | Paul Hannon | 3,107 | 5.5 | −0.6 | |
| Referendum | Ted Snook | 992 | 1.8 | N/A | |
| Green | Rachel Stark | 644 | 1.1 | N/A | |
| UKIP | R Tubb | 302 | 0.5 | N/A | |
| Socialist Labour | Katrina Howse | 174 | 0.3 | N/A | |
| Majority | 8,517 | 15.1 | N/A | ||
| Turnout | 56,476 | 76.3 | +5.0 | ||
| Liberal Democrat gain from Conservative | Swing | ||||
| Party | Candidate | Votes | % | ± | |
|---|---|---|---|---|---|
| Liberal Democrat | David Rendel | 37,590 | 65.1 | +27.8 | |
| Conservative | Julian Davidson | 15,535 | 26.9 | −29.0 | |
| Labour | Steve Billcliffe | 1,151 | 2.0 | −4.0 | |
| Anti-Federalist League | Alan Sked | 601 | 1.0 | N/A | |
| Conservative Candidate | Andrew Bannon | 561 | 1.0 | N/A | |
| Commoners' Party | Stephen Martin | 435 | 0.8 | N/A | |
| Monster Raving Loony | Screaming Lord Sutch | 432 | 0.7 | N/A | |
| Green | Jim Wallis | 341 | 0.6 | −0.2 | |
| Referendum Party | Robin Marlar | 338 | 0.6 | N/A | |
| Conservative Rebel | John Browne | 267 | 0.5 | N/A | |
| Corrective Party | Lindi St Clair | 170 | 0.3 | N/A | |
| Maastricht Referendum for Britain | Bill Board | 84 | 0.1 | N/A | |
| Natural Law | Michael Grenville | 60 | 0.1 | N/A | |
| People & Pensioners Party | Johnathon Day | 49 | 0.1 | N/A | |
| 21st Century Independent Foresters | Colin Palmer | 40 | 0.1 | N/A | |
| Defence of Children's Humanity Bosnia | Mladen Grbin | 33 | 0.1 | N/A | |
| SDP | Alan Page | 33 | 0.1 | N/A | |
| Communist (PCC) | Anne Murphy | 32 | 0.1 | N/A | |
| Give The Royal Billions To Schools | Michael Stone | 21 | 0.1 | N/A | |
| Majority | 22,055 | 38.2 | N/A | ||
| Turnout | 57,399 | 71.3 | −11.46 | ||
| Liberal Democrat gain from Conservative | Swing | 28.4 | |||
| Party | Candidate | Votes | % | ± | |
|---|---|---|---|---|---|
| Conservative | Judith Chaplin | 37,135 | 55.9 | −4.2 | |
| Liberal Democrat | David Rendel | 24 778 | 37.3 | +5.6 | |
| Labour | Richard J E Hall | 3,962 | 6.0 | −2.1 | |
| Green | Jim Wallis | 539 | 0.8 | N/A | |
| Majority | 12,357 | 18.6 | −9.8 | ||
| Turnout | 66,414 | 82.8 | +4.8 | ||
| Conservative hold | Swing | −4.9 | |||
Elections in the 1980s
| Party | Candidate | Votes | % | ± | |
|---|---|---|---|---|---|
| Conservative | Michael McNair-Wilson | 35,266 | 60.1 | +0.8 | |
| SDP–Liberal Alliance (Liberal) | David Rendel | 18,608 | 31.7 | −3.3 | |
| Labour | Robert Stapley | 4,765 | 8.1 | +2.5 | |
| Majority | 16,658 | 28.4 | +4.1 | ||
| Turnout | 58,639 | 78.0 | +2.8 | ||
| Conservative hold | Swing | ||||
| Party | Candidate | Votes | % | ± | |
|---|---|---|---|---|---|
| Conservative | Michael McNair-Wilson | 31,836 | 59.3 | +6.2 | |
| SDP–Liberal Alliance (Liberal) | Anthony Richards | 18,798 | 35.0 | −1.0 | |
| Labour | Richard Knight | 3,027 | 5.6 | −5.2 | |
| Majority | 13,038 | 24.3 | +7.2 | ||
| Turnout | 53,661 | 75.2 | -4.1 | ||
| Conservative hold | Swing | ||||
Elections in the 1970s
| Party | Candidate | Votes | % | ± | |
|---|---|---|---|---|---|
| Conservative | Michael McNair-Wilson | 33,677 | 52.8 | +10.4 | |
| Liberal | Anthony Richards | 23,388 | 36.7 | −3.9 | |
| Labour | Joan Ruddock | 6,676 | 10.5 | −6.2 | |
| Majority | 10,289 | 16.1 | +14.3 | ||
| Turnout | 63,741 | 79.3 | +3.0 | ||
| Conservative hold | Swing | ||||
| Party | Candidate | Votes | % | ± | |
|---|---|---|---|---|---|
| Conservative | Michael McNair-Wilson | 23,499 | 42.4 | +0.1 | |
| Liberal | Dane Clouston | 22,477 | 40.6 | +0.3 | |
| Labour | Celia Fletcher | 9,390 | 16.7 | −0.6 | |
| Majority | 1,022 | 1.8 | −0.2 | ||
| Turnout | 55,366 | 76.3 | −4.6 | ||
| Conservative hold | Swing | ||||
| Party | Candidate | Votes | % | ± | |
|---|---|---|---|---|---|
| Conservative | Michael McNair-Wilson | 24,620 | 42.4 | -6.4 | |
| Liberal | Dane Clouston | 23,419 | 40.3 | +19.0 | |
| Labour | Celia Fletcher | 10,935 | 17.3 | -4.0 | |
| Majority | 1,201 | 2.1 | -16.7 | ||
| Turnout | 58,974 | 80.8 | +8.2 | ||
| Conservative hold | Swing | ||||
After the 1970 general election, Newbury's boundaries were altered to reduce the size of the electorate which had grown to over 85,000. After the boundary changes, the electorate numbered around 72,000 people. This came into effect for the first general election in February 1974.
| Party | Candidate | Votes | % | ± | |
|---|---|---|---|---|---|
| Conservative | John Astor | 30,380 | 48.8 | +3.5 | |
| Labour | Timothy Sims | 18,647 | 29.9 | −8.1 | |
| Liberal | Dane Clouston | 13,279 | 21.3 | +4.6 | |
| Majority | 11,733 | 18.8 | +11.6 | ||
| Turnout | 55,392 | 72.6 | −6.5 | ||
| Conservative hold | Swing | ||||
Elections in the 1960s
| Party | Candidate | Votes | % | ± | |
|---|---|---|---|---|---|
| Conservative | John Astor | 25,908 | 45.3 | −0.1 | |
| Labour | Ronald Spiller | 21,762 | 38.0 | +3.6 | |
| Liberal | Stanley Clement Davies | 9,571 | 16.7 | −3.5 | |
| Majority | 4,146 | 7.2 | −3.7 | ||
| Turnout | 57,241 | 79.1 | −0.2 | ||
| Conservative hold | Swing | ||||
| Party | Candidate | Votes | % | ± | |
|---|---|---|---|---|---|
| Conservative | John Astor | 24,936 | 45.3 | −14.6 | |
| Labour | David Stoddart | 18,943 | 34.4 | +5.5 | |
| Liberal | Denis Egginton | 11,124 | 20.2 | N/A | |
| Majority | 5,993 | 10.9 | −9.1 | ||
| Turnout | 55,003 | 79.3 | +0.6 | ||
| Conservative hold | Swing | ||||
Elections in the 1950s
| Party | Candidate | Votes | % | ± | |
|---|---|---|---|---|---|
| Conservative | Anthony Hurd | 29,703 | 60.0 | +2.0 | |
| Labour | David Stoddart | 19,787 | 40.0 | −2.0 | |
| Majority | 9,916 | 20.0 | +4.0 | ||
| Turnout | 49,490 | 78.7 | +0.4 | ||
| Conservative hold | Swing | ||||
| Party | Candidate | Votes | % | ± | |
|---|---|---|---|---|---|
| Conservative | Anthony Hurd | 29,703 | 58.1 | −1.7 | |
| Labour | Jon Evans | 18,843 | 41.9 | +1.7 | |
| Majority | 7,237 | 16.0 | −3.6 | ||
| Turnout | 48,546 | 78.3 | −0.4 | ||
| Conservative hold | Swing | ||||
| Party | Candidate | Votes | % | ± | |
|---|---|---|---|---|---|
| Conservative | Anthony Hurd | 20,102 | 59.8 | +7.0 | |
| Labour | Colin Jackson | 13,507 | 40.2 | +5.5 | |
| Majority | 6,595 | 19.6 | +1.5 | ||
| Turnout | 33,609 | 78.7 | −2.4 | ||
| Conservative hold | Swing | ||||
| Party | Candidate | Votes | % | ± | |
|---|---|---|---|---|---|
| Conservative | Anthony Hurd | 18,150 | 52.8 | +0.4 | |
| Labour | Colin Jackson | 11,914 | 34.7 | +1.0 | |
| Liberal | Edwin Burrows | 4,284 | 12.5 | -0.5 | |
| Majority | 6,236 | 18.1 | -0.6 | ||
| Turnout | 34,348 | 81.1 | +15.7 | ||
| Conservative hold | Swing | ||||
Elections in the 1940s
| Party | Candidate | Votes | % | ± | |
|---|---|---|---|---|---|
| Conservative | Anthony Hurd | 24,463 | 52.4 | −20.6 | |
| Labour | Iris Brook | 15,754 | 33.7 | +6.7 | |
| Liberal | Eric Digby Tempest Vane | 6,052 | 13.0 | N/A | |
| Common Wealth | George Booth Suggett | 424 | 0.9 | N/A | |
| Majority | 8,709 | 18.7 | −27.3 | ||
| Turnout | 46,693 | 65.4 | −0.4 | ||
| Conservative hold | Swing | ||||
Elections in the 1930s
| Party | Candidate | Votes | % | ± | |
|---|---|---|---|---|---|
| Conservative | Howard Clifton Brown | 24,642 | 73.0 | N/A | |
| Labour | Richard Russell | 9,125 | 27.0 | N/A | |
| Majority | 15,517 | 46.0 | N/A | ||
| Turnout | 33,767 | 65.5 | N/A | ||
| Conservative hold | Swing | N/A | |||
In the 1931 general election, Howard Clifton Brown of the Conservative Party was re-elected unopposed.
Elections in the 1920s
| Party | Candidate | Votes | % | ± | |
|---|---|---|---|---|---|
| Unionist | Howard Clifton Brown | 17,800 | 51.0 | −4.9 | |
| Liberal | Edward Harold Brooks | 13,604 | 39.0 | −0.5 | |
| Labour | Frank Mortimer Jacques | 3,471 | 10.0 | +5.4 | |
| Majority | 4,196 | 12.0 | −4.4 | ||
| Turnout | 34,875 | 78.3 | −2.6 | ||
| Unionist hold | Swing | -2.2 | |||
| Party | Candidate | Votes | % | ± | |
|---|---|---|---|---|---|
| Unionist | Howard Clifton Brown | 14,759 | 55.9 | +6.0 | |
| Liberal | Innes Harold Stranger | 10,444 | 39.5 | −10.6 | |
| Labour | Frank Mortimer Jacques | 1,219 | 4.6 | N/A | |
| Majority | 4,315 | 16.4 | N/A | ||
| Turnout | 26,422 | 80.9 | +9.6 | ||
| Unionist gain from Liberal | Swing | ||||
| Party | Candidate | Votes | % | ± | |
|---|---|---|---|---|---|
| Liberal | Innes Harold Stranger | 11,226 | 50.1 | +7.5 | |
| Unionist | Howard Clifton Brown | 11,185 | 49.9 | −7.5 | |
| Majority | 41 | 0.2 | N/A | ||
| Turnout | 22,411 | 71.3 | +1.6 | ||
| Liberal gain from Unionist | Swing | +7.5 | |||
| Party | Candidate | Votes | % | ± | |
|---|---|---|---|---|---|
| Unionist | Howard Clifton Brown | 12,322 | 57.4 | N/A | |
| Liberal | Innes Harold Stranger | 9,144 | 42.6 | N/A | |
| Majority | 3,178 | 14.8 | N/A | ||
| Turnout | 21,466 | 69.7 | N/A | ||
| Unionist hold | Swing | N/A | |||
| Party | Candidate | Votes | % | ± | |
|---|---|---|---|---|---|
| C | Unionist | Howard Clifton Brown | Unopposed | ||
| Unionist hold | |||||
| C indicates candidate endorsed by the coalition government. | |||||
Elections in the 1910s
| Party | Candidate | Votes | % | ± | |
|---|---|---|---|---|---|
| C | Unionist | William Mount | Unopposed | ||
| Unionist hold | |||||
| C indicates candidate endorsed by the coalition government. | |||||
| Party | Candidate | Votes | % | ± | |
|---|---|---|---|---|---|
| Conservative | William Mount | 6,485 | 60.3 | +0.3 | |
| Liberal | Lisle March-Phillipps | 4,278 | 39.7 | −0.3 | |
| Majority | 2,207 | 20.5 | +0.5 | ||
| Turnout | 10,763 | 82.4 | -8.0 | ||
| Conservative hold | Swing | ||||
| Party | Candidate | Votes | % | ± | |
|---|---|---|---|---|---|
| Conservative | William Mount | 7,081 | 60.0 | +14.9 | |
| Liberal | Thomas Hedderwick | 4,723 | 40.0 | −14.9 | |
| Majority | 2,358 | 20.0 | N/A | ||
| Turnout | 11,804 | 90.4 | +2.9 | ||
| Conservative gain from Liberal | Swing | ||||
Elections in the 1900s
| Party | Candidate | Votes | % | ± | |
|---|---|---|---|---|---|
| Liberal | Frederick Mackarness | 5,338 | 52.0 | N/A | |
| Conservative | William Mount | 4,936 | 48.0 | N/A | |
| Majority | 402 | 3.9 | N/A | ||
| Turnout | 10,274 | 87.5 | N/A | ||
| Registered electors | 11,746 | ||||
| Liberal gain from Conservative | Swing | N/A | |||
| Party | Candidate | Votes | % | ± | |
|---|---|---|---|---|---|
| Conservative | William Mount | Unopposed | |||
| Conservative hold | |||||
Elections in the 1890s
| Party | Candidate | Votes | % | ± | |
|---|---|---|---|---|---|
| Conservative | William Mount | 4,895 | 56.5 | +2.7 | |
| Liberal | John Swinburne | 3,766 | 43.5 | −2.7 | |
| Majority | 1,129 | 13.0 | +5.4 | ||
| Turnout | 8,661 | 81.5 | −1.0 | ||
| Registered electors | 10,621 | ||||
| Conservative hold | Swing | +2.7 | |||
| Party | Candidate | Votes | % | ± | |
|---|---|---|---|---|---|
| Conservative | William Mount | 4,588 | 53.8 | N/A | |
| Liberal | Thomas Stevens[23] | 3,938 | 46.2 | N/A | |
| Majority | 650 | 7.6 | N/A | ||
| Turnout | 8,526 | 82.5 | N/A | ||
| Registered electors | 10,338 | ||||
| Conservative hold | Swing | N/A | |||
Elections in the 1880s
| Party | Candidate | Votes | % | ± | |
|---|---|---|---|---|---|
| Conservative | William Mount | Unopposed | |||
| Conservative hold | |||||
| Party | Candidate | Votes | % | ± | |
|---|---|---|---|---|---|
| Conservative | William Mount | 4,631 | 51.1 | N/A | |
| Liberal | George Palmer | 4,429 | 48.9 | N/A | |
| Majority | 202 | 2.2 | N/A | ||
| Turnout | 9,060 | 86.7 | N/A | ||
| Registered electors | 10,453 | ||||
| Conservative win (new seat) | |||||
Neighbouring constituencies
Constituencies bordering Newbury | |
|---|---|
See also
Notes and references
- Notes
- ↑ A county constituency (for the purposes of election expenses and type of returning officer)
- ↑ As with all constituencies, the constituency elects one Member of Parliament (MP) by the first past the post system of election at least every five years.
- ↑ Burghfield, Mortimer and Sulhamstead; and, respectively Burch Copse, Calcot, Pangbourne, Purley on Thames, Theale and Westwood
- ↑ The total period served by either a Liberal or Liberal Democrat MP is 17 years, Conservative MPs have served for the remaining 110 years (to the end of 2012)
- ↑ Other lost Labour deposits took place in Eastbourne, Somerton & Frome, Cornwall North and Westmorland & Lonsdale
- References
- ↑ "Electorate Figures – Boundary Commission for England". 2011 Electorate Figures. Boundary Commission for England. 4 March 2011. Archived from the original on 6 November 2010. Retrieved 13 March 2011.
- ↑ http://www.westberks.gov.uk/CHttpHandler.ashx?id=26989&p=0
- ↑ Archived 17 July 2012 at the Wayback Machine.
- ↑ 2001 Census
- ↑ 2011 census interactive maps Archived 29 January 2016 at the Wayback Machine.
- ↑ General Election Results from the Electoral Commission
- ↑ "Newbury". Electoral Calculus. Retrieved 5 June 2018.
- ↑ Leigh Rayment's Historical List of MPs – Constituencies beginning with "N" (part 1)
- ↑ "West Berkshire Council". West Berkshire. Retrieved 12 May 2017.
- ↑ "Election Data 2015". Electoral Calculus. Archived from the original on 17 October 2015. Retrieved 17 October 2015.
- ↑ http://geo.digiminster.com/election/2015-05-07/results/Location/Constituency/Newbury 8July2015
- ↑ https://www.bbc.co.uk/news/politics/constituencies/E14000830
- ↑ "Election Data 2010". Electoral Calculus. Archived from the original on 26 July 2013. Retrieved 17 October 2015.
- ↑ "Election Data 2005". Electoral Calculus. Archived from the original on 15 October 2011. Retrieved 18 October 2015.
- ↑ "Election Data 2001". Electoral Calculus. Archived from the original on 15 October 2011. Retrieved 18 October 2015.
- ↑ "Election Data 1997". Electoral Calculus. Archived from the original on 15 October 2011. Retrieved 18 October 2015.
- ↑ "Election Data 1992". Electoral Calculus. Archived from the original on 15 October 2011. Retrieved 18 October 2015.
- ↑ "Politics Resources". Election 1992. Politics Resources. 9 April 1992. Retrieved 2010-12-06.
- ↑ "Election Data 1987". Electoral Calculus. Archived from the original on 15 October 2011. Retrieved 18 October 2015.
- ↑ "Election Data 1983". Electoral Calculus. Archived from the original on 15 October 2011. Retrieved 18 October 2015.
- ↑ British Parliamentary Election Results 1918-1949, FWS Craig
- 1 2 3 4 5 6 Craig, FWS, ed. (1974). British Parliamentary Election Results: 1885-1918. London: Macmillan Press. ISBN 9781349022984.
- ↑ "Mr Stevens at Newbury". Reading Mercury. 9 Jul 1892. p. 4. Retrieved 22 November 2017.
Sources
- "Newbury election history". Newbury. Retrieved 12 April 2005.
- "Parliament.uk: 1992 elections" (PDF). Highest and lowest shares of the vote by party. Archived from the original (PDF) on 8 December 2005. Retrieved 12 April 2005.
- "Newbury 1993". Candidate names. Archived from the original on 27 October 2009. Retrieved 17 April 2005.
- "Election data from 1832". Newbury constituency 1959 onwards. Retrieved 23 April 2005.
- "Boundary Commission for England". Boundary changes. Archived from the original on 12 March 2005. Retrieved 23 April 2005.
- David Boothroyd. "Smallest majorities at elections since 1918". 1923 Majority. Retrieved 3 June 2005.
- BBC: Newbury constituency (2001)
- McCalmont, Frederick Haynes, Stenton Michael, Vincent, John Russell. McCalmont's parliamentary poll book: British election results. ( ISBN 0-85527-000-4)
- F. W. S. Craig. British Parliamentary Election Results 1950–1973. ( ISBN 0-900178-07-8)
- F. W. S. Craig. British Parliamentary Election Results 1918–1949. ( ISBN 0-900178-01-9)
External links
| Wikimedia Commons has media related to Newbury (UK Parliament constituency). |