Monmouth (UK Parliament constituency)
Coordinates: 51°46′05″N 2°48′40″W / 51.768°N 2.811°W
| Monmouth | |
|---|---|
|
County constituency for the House of Commons | |
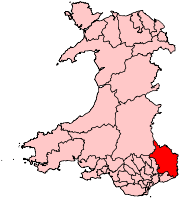 Boundary of Monmouth in Wales. | |
| Preserved county | Gwent |
| Electorate | 65,432 (December 2010)[1] |
| Major settlements | Abergavenny, Chepstow, Monmouth |
| Current constituency | |
| Created | 1918 |
| Member of parliament | David Davies (Conservative) |
| Number of members | One |
| Created from | Monmouth Boroughs, North Monmouthshire and South Monmouthshire |
| Overlaps | |
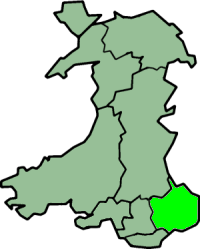
| Welsh Assembly | South East Wales |
| European Parliament constituency | Wales |
Monmouth (Welsh: Sir Fynwy) is a county constituency of the House of Commons of the Parliament of the United Kingdom (at Westminster). It elects one Member of Parliament (MP) by the first past the post of election. The constituency was created for the 1918 general election. Since 2005 the MP has been David Davies of the Conservative Party.
The Monmouth Welsh Assembly constituency, created in 1999, has normally the same boundaries as the Westminster constituency.
History
The constituency has traditionally favoured the Conservative Party though has fallen to Labour in three general elections in addition to the 1991 by-election.
The current MP is the Conservative David Davies, elected in 2005 and a former member for the Welsh Assembly seat of the same name. To avoid confusion with the Yorkshire Conservative David Davis, he is named in Hansard as "David T.C. Davies".
Boundaries
1983 onwards
The constituency is one of eight covering the preserved county of Gwent. The other seven are Blaenau Gwent, Caerphilly, Islwyn, Merthyr Tydfil and Rhymney, Newport East, Newport West and Torfaen. Merthyr Tydfil and Rhymney, however, straddles the boundary with the preserved county of Mid Glamorgan. It covers most of current local authority of Monmouthshire, with the main towns being Chepstow and Monmouth.
For the 2010 general election, there were no changes to the boundaries of the Monmouth constituency stemming from the Fifth Review of the Boundary Commission for Wales.[2] Likewise there were no boundary changes in 1997.
1918 to 1983
As first used in the 1918 general election, the constituency was a creation of the Representation of the People Act 1918 as one of six constituencies covering the county of Monmouth. Prior to the 1918 election the county had been covered, nominally, by the county constituencies of Northern Monmouthshire, Southern Monmouthshire, and Western Monmouthshire, and the Monmouth Boroughs borough constituency. By 1918, however, administrative county boundaries were out of alignment with constituency boundaries. The new constituency boundaries took account of the new local government boundaries.
The other Monmouthshire constituencies defined by the 1918 legislation were the county constituencies of Abertillery, Bedwellty, Ebbw Vale and Pontypool, and the borough constituency of Newport. This general pattern was maintained until 1983, nine years after the administrative county they were based on had been abolished, but there were some boundary changes during the 1918 to 1983 period.

In 1918 the Monmouth constituency was defined as consisting of the municipal boroughs of Abergavenny, and Monmouth, the urban districts of Caerleon, Chepstow, and Usk, the rural districts of Abergavenny, Chepstow, Magor, Monmouth, Cwmbran and Pontypool, and part of the rural district of St Mellons.[3] The same boundaries were used for the general elections of 1922, 1923, 1924, 1929, 1931, 1935 and 1945.
New boundaries, created by the House of Commons (Redistribution of Seats) Act 1949, were used for the 1950 general election, and the Monmouth constituency was defined as consisting of the municipal boroughs of Abergavenny and Monmouth, the urban districts of Caerleon, Chepstow, Cwmbran and Usk, and the rural districts of Abergavenny, Chepstow, Magor and St Mellons, Monmouth, and Pontypool.[3]
For the 1951 general election, there was some alteration to the boundaries of rural district of Magor and St Mellons.[3]
The constituency was redefined again for the 1955 general election, taking account of new local government boundaries. The result was the same list of boroughs and districts as for the 1951 election.[3] 1951 boundaries were used also in the general elections of 1959, 1964, 1966, 1970, February 1974, October 1974 and 1979.
In 1974, under the Local Government Act 1972, the local government county of Monmouth was abolished. For the 1983 general election, new constituency boundaries were drawn, taking account of new local government boundaries.
Members of Parliament
The following list does not include MPs who actually represented Monmouth Boroughs:
Elections
Elections in the 2010s
| Party | Candidate | Votes | % | ± | |
|---|---|---|---|---|---|
| Conservative | David Davies | 26,411 | 53.1 | +3.2 | |
| Labour | Ruth Jones | 18,205 | 36.6 | +9.8 | |
| Liberal Democrat | Veronica German | 2,064 | 4.2 | −1.1 | |
| Plaid Cymru | Carole Damon | 1,338 | 2.7 | -1.3 | |
| Green | Ian Chandler | 954 | 1.9 | -1.5 | |
| UKIP | Roy Neale | 762 | 1.5 | -8.9 | |
| Majority | 8,206 | 16.5 | -6.5 | ||
| Turnout | 49,734 | 76.6 | +0.4 | ||
| Registered electors | 64,909 | ||||
| Conservative hold | Swing | -3.3 | |||
| Party | Candidate | Votes | % | ± | |
|---|---|---|---|---|---|
| Conservative | David Davies | 23,701 | 49.9 | +1.6 | |
| Labour | Ruth Jones | 12,719 | 26.8 | +0.9 | |
| UKIP | Gareth Dunn | 4,942 | 10.4 | +8.0 | |
| Liberal Democrat | Veronica German | 2,496 | 5.3 | −14.1 | |
| Plaid Cymru | Jonathan Clark | 1,875 | 3.9 | +1.2 | |
| Green | Christopher Were | 1,629 | 3.4 | +2.2 | |
| English Democrat | Stephen Morris | 100 | 0.2 | N/A | |
| Majority | 10,982 | 23.1 | +0.7 | ||
| Turnout | 47,462 | 76.2 | +4.0 | ||
| Registered electors | 62,248 | ||||
| Conservative hold | Swing | +0.3 | |||
| Party | Candidate | Votes | % | ± | |
|---|---|---|---|---|---|
| Conservative | David Davies | 22,466 | 48.3 | +1.4 | |
| Labour | Hamish Sandison | 12,041 | 25.9 | −11.1 | |
| Liberal Democrat | Martin Blakebrough | 9,026 | 19.4 | +6.6 | |
| Plaid Cymru | Jonathan Clark | 1,273 | 2.7 | +0.6 | |
| UKIP | Derek Rowe | 1,126 | 2.4 | +1.2 | |
| Green | Steve Millson | 587 | 1.3 | N/A | |
| Majority | 10,425 | 22.4 | +12.5 | ||
| Turnout | 46,519 | 72.2 | −0.2 | ||
| Registered electors | 64,538 | ||||
| Conservative hold | Swing | +6.2 | |||
Elections in the 2000s
| Party | Candidate | Votes | % | ± | |
|---|---|---|---|---|---|
| Conservative | David Davies | 21,396 | 46.9 | +5.0 | |
| Labour | Huw Edwards | 16,869 | 37.0 | −5.8 | |
| Liberal Democrat | Phylip A. D. Hobson | 5,852 | 12.8 | +1.4 | |
| Plaid Cymru | Jonathan Clark | 993 | 2.2 | −0.2 | |
| UKIP | John Bufton | 543 | 1.2 | −0.3 | |
| Majority | 4,527 | 9.9 | N/A | ||
| Turnout | 45,653 | 72.4 | +0.9 | ||
| Registered electors | 62,233 | ||||
| Conservative gain from Labour | Swing | +5.4 | |||
| Party | Candidate | Votes | % | ± | |
|---|---|---|---|---|---|
| Labour | Huw Edwards | 19,021 | 42.8 | −5.0 | |
| Conservative | Roger Evans | 18,637 | 41.9 | +2.7 | |
| Liberal Democrat | Neil Parker | 5,080 | 11.4 | +1.9 | |
| Plaid Cymru | Marc Hubbard | 1,068 | 2.4 | +1.3 | |
| UKIP | David Rowlands | 656 | 1.5 | N/A | |
| Majority | 384 | 0.9 | −7.6 | ||
| Turnout | 44,462 | 71.5 | −9.1 | ||
| Registered electors | 62,200 | ||||
| Labour hold | Swing | −3.8 | |||
Elections in the 1990s
| Party | Candidate | Votes | % | ± | |
|---|---|---|---|---|---|
| Labour | Huw Edwards | 23,404 | 47.7 | +6.8 | |
| Conservative | Roger Evans | 19,226 | 39.2 | -8.0 | |
| Liberal Democrat | Mark Williams | 4,689 | 9.6 | -1.4 | |
| Referendum | Timothy Warry | 1,190 | 2.4 | N/A | |
| Plaid Cymru | Alan Cotton | 516 | 1.1 | +0.3 | |
| Majority | 4,178 | 8.5 | N/A | ||
| Turnout | 49,025 | 80.5 | −5.6 | ||
| Registered electors | 60,873 | ||||
| Labour gain from Conservative | Swing | +7.4 | |||
| Party | Candidate | Votes | % | ± | |
|---|---|---|---|---|---|
| Conservative | Roger Evans | 24,059 | 47.3 | −0.3 | |
| Labour | Huw Edwards | 20,855 | 41.0 | +13.3 | |
| Liberal Democrat | Frances David | 5,562 | 10.9 | −13.1 | |
| Plaid Cymru (Green) | Melvin Witherden | 431 | 0.8 | +0.0 | |
| Majority | 3,204 | 6.3 | -13.6 | ||
| Turnout | 50,907 | 86.1 | +5.3 | ||
| Registered electors | 59,147 | ||||
| Conservative hold | Swing | −6.8 | |||
| Party | Candidate | Votes | % | ± | |
|---|---|---|---|---|---|
| Labour | Huw Edwards | 17,733 | 39.3 | +11.6 | |
| Conservative | Roger Evans | 15,327 | 34.0 | −13.5 | |
| Liberal Democrat | Frances David | 11,164 | 24.8 | N/A | |
| Monster Raving Loony | Screaming Lord Sutch | 314 | 0.7 | N/A | |
| Plaid Cymru (Green) | Melvin Witherden | 277 | 0.6 | -0.2 | |
| Unitax Independent | Peter Carpenter | 164 | 0.4 | N/A | |
| Corrective Party | Lindi St Clair | 121 | 0.3 | N/A | |
| Majority | 2,406 | 5.3 | N/A | ||
| Turnout | 45,100 | 75.8 | -5.0 | ||
| Registered electors | 59,460 | ||||
| Labour gain from Conservative | Swing | -12.6 | |||
Elections in the 1980s
| Party | Candidate | Votes | % | ± | |
|---|---|---|---|---|---|
| Conservative | John Thomas | 22,387 | 47.5 | −1.6 | |
| Labour | Katrina Gass | 13,037 | 27.7 | +6.0 | |
| Social Democratic | Clive Lindley | 11,313 | 24.0 | −4.0 | |
| Plaid Cymru | Sian Meredudd | 363 | 0.8 | −0.3 | |
| Majority | 9,530 | 19.9 | −1.2 | ||
| Turnout | 47,100 | 80.8 | +1.93 | ||
| Registered electors | 58,468 | ||||
| Conservative hold | Swing | −2.2 | |||
| Party | Candidate | Votes | % | ± | |
|---|---|---|---|---|---|
| Conservative | John Thomas | 21,746 | 49.2 | -1.3 | |
| Social Democratic | Clive Lindley | 12,403 | 28.0 | N/A | |
| Labour | Christopher Short | 9,593 | 21.7 | -14.1 | |
| Plaid Cymru | Gwynddri Williams | 493 | 1.1 | +0.1 | |
| Majority | 9,343 | 21.2 | +6.51 | ||
| Turnout | 44,235 | 78.8 | -4.2 | ||
| Registered electors | 56,112 | ||||
| Conservative hold | Swing | ||||
Elections in the 1970s
| Party | Candidate | Votes | % | ± | |
|---|---|---|---|---|---|
| Conservative | John Thomas | 33,547 | 50.5 | +7.71 | |
| Labour | T.M. Steel | 23,785 | 35.8 | -1.06 | |
| Liberal | David H. Hando | 8,494 | 12.8 | -4.14 | |
| Plaid Cymru | G. Williams | 641 | 1.0 | -0.41 | |
| Majority | 9,762 | 14.69 | +10.75 | ||
| Turnout | 66,467 | 83.00 | +3.50 | ||
| Registered electors | 80,085 | ||||
| Conservative hold | Swing | ||||
| Party | Candidate | Votes | % | ± | |
|---|---|---|---|---|---|
| Conservative | John Thomas | 25,460 | 42.79 | -0.90 | |
| Labour | Richard Faulkner | 23,118 | 36.86 | +0.48 | |
| Liberal | David H. Hando | 10,076 | 16.94 | -1.50 | |
| Plaid Cymru | T. Brimmacombe | 839 | 1.41 | -0.08 | |
| Majority | 2,342 | 3.94 | -4.37 | ||
| Turnout | 59,493 | 79.5 | -4.64 | ||
| Registered electors | 74,838 | ||||
| Conservative hold | Swing | ||||
| Party | Candidate | Votes | % | ± | |
|---|---|---|---|---|---|
| Conservative | John Thomas | 27,269 | 43.69 | -2.85 | |
| Labour | F.R. Thompson | 22,707 | 36.38 | -7.93 | |
| Liberal | David H. Hando | 11,506 | 18.44 | +11.76 | |
| Plaid Cymru | E.H. Spanwick | 930 | 1.49 | -0.98 | |
| Majority | 4,562 | 7.31 | +5.08 | ||
| Turnout | 62,412 | 84.14 | +3.68 | ||
| Registered electors | 74,173 | ||||
| Conservative hold | Swing | ||||
| Party | Candidate | Votes | % | ± | |
|---|---|---|---|---|---|
| Conservative | John Thomas | 28,312 | 46.54 | -0.76 | |
| Labour | Donald Anderson | 26,957 | 44.31 | -8.39 | |
| Liberal | David H. Hando | 4,601 | 6.68 | N/A | |
| Plaid Cymru | Stuart K. Neale | 1,501 | 2.47 | N/A | |
| Majority | 1,355 | 2.23 | N/A | ||
| Turnout | 61,371 | 80.46 | -3.84 | ||
| Registered electors | 75,602 | ||||
| Conservative gain from Labour | Swing | ||||
Elections in the 1960s
| Party | Candidate | Votes | % | ± | |
|---|---|---|---|---|---|
| Labour | Donald Anderson | 28,619 | 52.7 | +9.99 | |
| Conservative | Peter Thorneycroft | 25,654 | 47.3 | +3.19 | |
| Majority | 2,965 | 5.5 | N/A | ||
| Turnout | 54,273 | 84.3 | -0.10 | ||
| Registered electors | 64,356 | ||||
| Labour gain from Conservative | Swing | ||||
| Party | Candidate | Votes | % | ± | |
|---|---|---|---|---|---|
| Conservative | Peter Thorneycroft | 22,365 | 44.11 | -12.91 | |
| Labour | A. Calvin Kerr | 21,921 | 42.71 | -0.27 | |
| Liberal | D. Hywell Davies | 6,764 | 13.14 | N/A | |
| Majority | 714 | 1.39 | -12.64 | ||
| Turnout | 51,050 | 84.4 | +1.26 | ||
| Registered electors | 60,803 | ||||
| Conservative hold | Swing | ||||
Elections in the 1950s
| Party | Candidate | Votes | % | ± | |
|---|---|---|---|---|---|
| Conservative | Peter Thorneycroft | 25,422 | 57.02 | -0.20 | |
| Labour | Gordon Parry | 19,165 | 42.98 | +0.20 | |
| Majority | 6,257 | 14.03 | -0.41 | ||
| Turnout | 44,587 | 83.14 | +1.63 | ||
| Registered electors | 53,628 | ||||
| Conservative hold | Swing | ||||
| Party | Candidate | Votes | % | ± | |
|---|---|---|---|---|---|
| Conservative | Peter Thorneycroft | 22,970 | 57.22 | +1.63 | |
| Labour | Josephine Richardson | 17,173 | 42.78 | -1.63 | |
| Majority | 5,797 | 14.44 | +3.25 | ||
| Turnout | 40,143 | 81.51 | -2.17 | ||
| Registered electors | 49,252 | ||||
| Conservative hold | Swing | ||||
| Party | Candidate | Votes | % | ± | |
|---|---|---|---|---|---|
| Conservative | Peter Thorneycroft | 22,475 | 55.59 | +0.26 | |
| Labour | Josephine Richardson | 17,952 | 44.41 | -0.26 | |
| Majority | 4,523 | 11.19 | +0.53 | ||
| Turnout | 40,247 | 83.68 | +0.53 | ||
| Registered electors | 48,314 | ||||
| Conservative hold | Swing | ||||
| Party | Candidate | Votes | % | ± | |
|---|---|---|---|---|---|
| Conservative | Peter Thorneycroft | 21,956 | 55.33 | +3.43 | |
| Labour | GP Thomas | 17,725 | 44.67 | -3.43 | |
| Majority | 4,231 | 10.66 | -6.86 | ||
| Turnout | 39,681 | 83.15 | +11.15 | ||
| Registered electors | 47,725 | ||||
| Conservative hold | Swing | ||||
Elections in the 1940s
| Party | Candidate | Votes | % | ± | |
|---|---|---|---|---|---|
| Conservative | Peter Thorneycroft | 21,092 | 52.7 | +0.8 | |
| Labour | A. B. L. Oakley | 18,953 | 47.3 | -0.8 | |
| Majority | 2,139 | 5.4 | +1.6 | ||
| Turnout | 40,045 | 39.8 | -32.2 | ||
| Registered electors | 60,013 | ||||
| Conservative hold | Swing | +0.8 | |||
| Party | Candidate | Votes | % | ± | |
|---|---|---|---|---|---|
| Conservative | Leslie Pym | 22,195 | 51.9 | -8.2 | |
| Labour | A. B. L. Oakley | 20,543 | 48.1 | +8.2 | |
| Majority | 1,652 | 3.8 | -16.4 | ||
| Turnout | 42,738 | 72.0 | +13.8 | ||
| Registered electors | 39,359 | ||||
| Conservative hold | Swing | -8.2 | |||
Elections in the 1930s
| Party | Candidate | Votes | % | ± | |
|---|---|---|---|---|---|
| Conservative | Leslie Pym | 17,358 | 60.1 | -3.3 | |
| Labour | F. R. Hancock | 11,543 | 39.9 | +3.3 | |
| Majority | 5,815 | 20.2 | -6.6 | ||
| Turnout | 28,901 | 58.2 | -18.6 | ||
| Registered electors | 49,690 | ||||
| Conservative hold | Swing | -3.3 | |||
| Party | Candidate | Votes | % | ± | |
|---|---|---|---|---|---|
| Conservative | John Herbert | 23,262 | 63.4 | 1.6 | |
| Labour | Mackintosh Foot | 13,454 | 36.6 | +1.6 | |
| Majority | 9,808 | 26.8 | -3.2 | ||
| Turnout | 36,716 | 76.8 | +7.4 | ||
| Registered electors | 47,792 | ||||
| Conservative hold | Swing | -1.6 | |||
| Party | Candidate | Votes | % | ± | |
|---|---|---|---|---|---|
| Conservative | John Herbert | 20,640 | 65.0 | -5.8 | |
| Labour | D. Hughes | 11,094 | 35.0 | +5.8 | |
| Majority | 9,546 | 30.0 | -11.6 | ||
| Turnout | 31,734 | 69.2 | -8.8 | ||
| Registered electors | 45,885 | ||||
| Conservative hold | Swing | -5.8 | |||
| Party | Candidate | Votes | % | ± | |
|---|---|---|---|---|---|
| Conservative | Leolin Forestier-Walker | 24,829 | 70.8 | +21.5 | |
| Labour | D. Hughes | 10,217 | 29.2 | +4.3 | |
| Majority | 14,612 | 41.6 | +18.1 | ||
| Turnout | 45,046 | 78.0 | -0.9 | ||
| Registered electors | 44,929 | ||||
| Conservative hold | Swing | ||||
Elections in the 1920s
| Party | Candidate | Votes | % | ± | |
|---|---|---|---|---|---|
| Unionist | Leolin Forestier-Walker | 16,353 | 49.3 | -22.5 | |
| Liberal | Richard Charles Williams | 8,582 | 25.8 | N/A | |
| Labour | Luke Bateman | 8,268 | 24.9 | -3.3 | |
| Majority | 7,771 | 23.5 | -20.1 | ||
| Turnout | 33,203 | 78.9 | +4.8 | ||
| Registered electors | 42,070 | ||||
| Unionist hold | Swing | ||||
| Party | Candidate | Votes | % | ± | |
|---|---|---|---|---|---|
| Unionist | Leolin Forestier-Walker | 16,510 | 71.8 | +11.9 | |
| Labour | Luke Bateman | 6,469 | 28.2 | N/A | |
| Majority | 10,041 | 43.6 | -20.1 | ||
| Turnout | 22,979 | 74.1 | +3.2 | ||
| Registered electors | 31,031 | ||||
| Unionist hold | Swing | ||||
| Party | Candidate | Votes | % | ± | |
|---|---|---|---|---|---|
| Unionist | Leolin Forestier-Walker | 12,697 | 59.9 | N/A | |
| Liberal | Morgan Griffith | 8,487 | 40.1 | N/A | |
| Majority | 4,210 | 19.8 | N/A | ||
| Turnout | 21,184 | 80.9 | N/A | ||
| Registered electors | 29,889 | ||||
| Unionist hold | Swing | N/A | |||
| Party | Candidate | Votes | % | ± | |
|---|---|---|---|---|---|
| Unionist | Leolin Forestier-Walker | Unopposed | |||
| Registered electors | 29,779 | ||||
| Unionist hold | |||||
Elections in the 1910s
| Party | Candidate | Votes | % | ± | |
|---|---|---|---|---|---|
| Unionist | Leolin Forestier-Walker | 9,164 | 59.7 | N/A | |
| Liberal | Hubert Martineau | 6,189 | 40.3 | N/A | |
| Majority | 2,975 | 19.4 | N/A | ||
| Turnout | 15,353 | 55.7 | N/A | ||
| Registered electors | 27,575 | ||||
| Unionist win (new seat) | |||||
See also
Notes and references
- ↑ "Beyond 20/20 WDS - Table view". 2011 Electorate Figures. StatsWales. 1 December 2010. Retrieved 13 March 2011.
- ↑ Boundary Commission for Wales website
The Parliamentary Constituencies and Assembly Electoral Regions (Wales) Order 2006, OPSI website - 1 2 3 4 Boundaries of Parliamentary Constituencies 1885-1972 (
ISBN 0-900178-09-4), F. W. S. Craig 1972
Craig attributes the 1951 alteration to SI 1851/1390 under section 2(3) of the House of Commons (Redistribution of Seats) Act 1949 - ↑ Leigh Rayment's Historical List of MPs – Constituencies beginning with "M" (part 3)
- ↑ "Election Data 2015". Electoral Calculus. Archived from the original on 17 October 2015. Retrieved 17 October 2015.
- ↑ Declaration of result of poll
- ↑ "Election Data 2010". Electoral Calculus. Archived from the original on 26 July 2013. Retrieved 17 October 2015.
- ↑ "Election Data 2005". Electoral Calculus. Archived from the original on 15 October 2011. Retrieved 18 October 2015.
- ↑ "Election Data 2001". Electoral Calculus. Archived from the original on 15 October 2011. Retrieved 18 October 2015.
- ↑ "Election Data 1997". Electoral Calculus. Archived from the original on 15 October 2011. Retrieved 18 October 2015.
- ↑ "Election Data 1992". Electoral Calculus. Archived from the original on 15 October 2011. Retrieved 18 October 2015.
- ↑ "Politics Resources". Election 1992. Politics Resources. 9 April 1992. Retrieved 6 Dec 2010.
- ↑ Boothroyd, David. "Results of Byelections in the 1987-92 Parliament". United Kingdom Election Results. Retrieved 2015-10-01.
- ↑ "Election Data 1987". Electoral Calculus. Archived from the original on 15 October 2011. Retrieved 18 October 2015.
- ↑ "Election Data 1983". Electoral Calculus. Archived from the original on 15 October 2011. Retrieved 18 October 2015.
- 1 2 3 British Parliamentary Election Results 1918-1949, FWS Craig
- ↑ Etholiadau'r ganrif 1885-1997, Beti Jones
Further reading
- Iain Dale, ed. (2003). The Times House of Commons 1929, 1931, 1935. Politico's (reprint). ISBN 1-84275-033-X.
- The Times House of Commons 1945. The Times. 1945.
- Craig, F. W. S. (1983) [1969]. British parliamentary election results 1918-1949 (3rd ed.). Chichester: Parliamentary Research Services. ISBN 0-900178-06-X.
External links
- Politics Resources (Election results from 1922 onwards)
- Electoral Calculus (Election results from 1955 onwards)
- 2017 Election House Of Commons Library 2017 Election report
- A Vision Of Britain Through Time (Constituency elector numbers)
| Parliament of the United Kingdom | ||
|---|---|---|
| Preceded by Bromley |
Constituency represented by the Chancellor of the Exchequer 1957–1958 |
Succeeded by Tiverton |