South Norfolk (UK Parliament constituency)
| South Norfolk | |
|---|---|
|
County constituency for the House of Commons | |
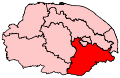 Boundary of South Norfolk in Norfolk. | |
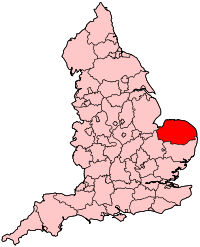 Location of Norfolk within England. | |
| County | Norfolk |
| Electorate | 77,316 (December 2010)[1] |
| Current constituency | |
| Created | 1868 |
| Member of parliament | Richard Bacon (Conservative) |
| Number of members | One (Two 1868-1885) |
| Created from |
East Norfolk West Norfolk |
| Overlaps | |
| European Parliament constituency | East of England |
South Norfolk is a constituency[n 1] represented in the House of Commons of the UK Parliament since 2001 by Richard Bacon, a Conservative.[n 2]
Boundaries
Following the Reform Act 1832 the historic county constituency Norfolk was for the first time split into two, two member, county divisions - East Norfolk and West Norfolk.
The Reform Act 1867 led, the following year, to the county's redistribution into three, two member, county divisions. The three divisions, from the United Kingdom general election, 1868 became this one, the North and modified Western division.
The Southern division had its place of election[n 3] at Norwich. This was the same place of election as the abolished Eastern division. In 1868 the same two MPs who had sat for East Norfolk before its end were re-elected from this constituency.
Under the provisions of the Redistribution of Seats Act 1885, single member constituencies became the norm and greater equalisation in electorate occurred. In Norfolk the three, two member, county divisions were changed to six single member seats. These were this constituency, a revived East Norfolk, Mid Norfolk, North Norfolk, North West Norfolk and South West Norfolk.
In the 1885 redistribution this constituency consisted of the Sessional Divisions of Depwade, Diss, Earsham, Loddon and Clavering, and Swainsthorpe. It bordered Mid Norfolk to the west, the borough constituency of Norwich and East Norfolk to the north, the borough of Great Yarmouth and the Suffolk constituency of Lowestoft to the east and another Suffolk division, Eye, to the south.
The Southern division was very agricultural in character. The largest town was Diss, which had a population of fewer than 4,000 people in 1900.
From the Representation of the People Act 1918, the constituency comprised the local government divisions:
1918-1950: The Urban District of Diss, the Rural Districts of Depwade, Forehoe, Henstead, and Wayland, and part of the Rural District of Thetford.
1950-1974: The Municipal Borough of Thetford, the Urban Districts of Diss and Wymondham, and the Rural Districts of Depwade, Loddon, and Wayland. These areas combined to produce a somewhat more urban constituency than before.
1974-1983: The Municipal Borough of Thetford, the Urban Districts of Diss and Wymondham, and the Rural Districts of Depwade, Forehoe and Henstead, Loddon, and Wayland. This was the last redistribution before a major reorganisation of local government, which amalgamated many of the smaller local authorities and which was reflected in the 1983 redistribution.
1983-1997: A further reduction of area meant that the seat now consisted of the entire District of South Norfolk. The other part of the 1974 seat (the Thetford and Wayland areas) was transferred to the redrawn South West Norfolk constituency.
1997-2010: Continuing population growth led to another reduction in the constituency's territory. It comprised the District of South Norfolk except the wards of Cringleford and Colney, and New Costessey (which were now in Norwich South).
2010-present: The Boundary Commission for England reduced the wide part of the District of South Norfolk comprising the constituency: eight wards became part of other seats. The seat now has electoral wards:
Beck Vale, Bressingham and Burston, Brooke, Bunwell, Chedgrave and Thurton, Cringleford, Dickleburgh, Diss, Ditchingham and Broome, Earsham, Easton, Forncett, Gillingham, Harleston, Hempnall, Hethersett, Loddon, Mulbarton, Newton Flotman, Old Costessey, Poringland with the Framinghams, Rockland, Roydon, Scole, Stoke Holy Cross, Stratton, Tasburgh, and Thurlton.[2]
Members of Parliament
MPs 1868 – 1885 (two seats)
| Election | 1st Member[3] | 1st Party | 2nd Member[3] | 2nd Party | ||
|---|---|---|---|---|---|---|
| 1868 | Clare Sewell Read | Conservative | Edward Howes | Conservative | ||
| 1871 | Sir Robert Buxton, Bt | Conservative | ||||
| 1880 | Robert Gurdon | Liberal | ||||
| 1885 | representation reduced to one member | |||||
MPs since 1885 (one seat)

| Election | Member[3] | Party | Notes | |
|---|---|---|---|---|
| 1885 | Francis Taylor | Liberal | ||
| 1886 | Liberal Unionist | |||
| 1898 by-election | Arthur Soames | Liberal | ||
| 1918 | William Cozens-Hardy a | Liberal | ||
| 1919 | Coalition Liberal | |||
| 1920 by-election | George Edwards | Labour | ||
| 1922 | Thomas Hay | Conservative | ||
| 1923 | George Edwards | Labour | ||
| 1924 | James Christie | Conservative | ||
| 1945 | Christopher Mayhew | Labour | ||
| 1950 | Peter Baker b | Conservative | Expelled from Parliament 1954 | |
| 1955 by-election | John Hill | Conservative | ||
| Feb 1974 | John MacGregor | Conservative | Later Baron MacGregor of Pulham Market; Cabinet Minister 1985-1994 | |
| 2001 | Richard Bacon | Conservative | ||
Notes:-
- a Cozens-Hardy stood at the United Kingdom general election, 1918 as a Liberal without the Coalition "coupon", but he took the Coalition Liberal whip when Parliament assembled in 1919.
- b Baker was expelled from the House of Commons in 1954 after being convicted of fraud, forgery and uttering and sentenced to seven years imprisonment.
Elections
Elections in the 2010s
| Party | Candidate | Votes | % | ± | |
|---|---|---|---|---|---|
| Conservative | Richard Bacon | 35,580 | 58.2 | +4.0 | |
| Labour | Danielle Glavin | 18,902 | 30.9 | +12.5 | |
| Liberal Democrat | Christopher Brown | 5,074 | 8.3 | +0.1 | |
| Green | Catherine Rowett | 1,555 | 2.5 | -2.9 | |
| Majority | 16,678 | 27.3 | |||
| Turnout | 61,111 | 73.6 | |||
| Conservative hold | Swing | -4.3 | |||
| Party | Candidate | Votes | % | ± | |
|---|---|---|---|---|---|
| Conservative | Richard Bacon | 30,995 | 54.3 | +4.9 | |
| Labour | Deborah Sacks[7] | 10,502 | 18.4 | +5.2 | |
| UKIP | Barry Cameron[8] | 7,847 | 13.7 | +9.5 | |
| Liberal Democrat | Jacky Howe[9] | 4,689 | 8.2 | -21.2 | |
| Green | Catherine Rowett[10] | 3,090 | 5.4 | +3.6 | |
| Majority | 20,493 | 35.9 | |||
| Turnout | 57,123 | 72.4 | |||
| Conservative hold | Swing | ||||
| Party | Candidate | Votes | % | ± | |
|---|---|---|---|---|---|
| Conservative | Richard Bacon | 27,133 | 49.3 | +4.6 | |
| Liberal Democrat | Jacky Howe | 16,193 | 29.4 | -0.4 | |
| Labour | Mick Castle | 7,252 | 13.2 | -9.3 | |
| UKIP | Evan Heasley | 2,329 | 4.2 | +1.4 | |
| BNP | Helen Mitchell | 1,086 | 2.0 | +2.0 | |
| Green | Jo Willcott | 1,000 | 1.8 | +1.8 | |
| Majority | 10,940 | 19.9 | |||
| Turnout | 54,993 | 72.2 | +3.1 | ||
| Conservative hold | Swing | +3.3 | |||
Elections in the 2000s
| Party | Candidate | Votes | % | ± | |
|---|---|---|---|---|---|
| Conservative | Richard Bacon | 26,399 | 44.8 | +2.6 | |
| Liberal Democrat | Ian Mack | 17,617 | 29.9 | +0.0 | |
| Labour | John Morgan | 13,262 | 22.5 | -2.0 | |
| UKIP | Philip Tye | 1,696 | 2.9 | +1.4 | |
| Majority | 8,782 | 14.9 | |||
| Turnout | 58,974 | 68.7 | +1.1 | ||
| Conservative hold | Swing | 1.3 | |||
| Party | Candidate | Votes | % | ± | |
|---|---|---|---|---|---|
| Conservative | Richard Bacon | 23,589 | 42.2 | +2.0 | |
| Liberal Democrat | Anne Lee | 16,696 | 29.9 | +1.6 | |
| Labour | Mark Wells | 13,719 | 24.5 | -1.5 | |
| Green | Stephanie Ross-Wagenknect | 1,069 | 1.9 | +1.1 | |
| UKIP | Joe Neal | 856 | 1.5 | +0.9 | |
| Majority | 6,893 | 12.3 | |||
| Turnout | 55,929 | 67.6 | -10.7 | ||
| Conservative hold | Swing | 0.2 | |||
Elections in the 1990s
| Party | Candidate | Votes | % | ± | |
|---|---|---|---|---|---|
| Conservative | John MacGregor | 24,935 | 40.2 | -12.4 | |
| Liberal Democrat | Barbara Hacker | 17,557 | 28.3 | +1.3 | |
| Labour | Jane Ross | 16,188 | 26.1 | +8.0 | |
| Referendum | Patricia Bateson | 2,533 | 4.1 | +4.1 | |
| Green | Stephanie Ross-Wagenknecht | 484 | 0.8 | -0.2 | |
| UKIP | Anthony Boddy | 400 | 0.6 | +0.6 | |
| Majority | 7,378 | 11.9 | -13.7 | ||
| Turnout | 79,239 | 78.37 | -5.62 | ||
| Conservative hold | Swing | -6.8 | |||
| Party | Candidate | Votes | % | ± | |
|---|---|---|---|---|---|
| Conservative | John MacGregor | 36,081 | 52.6 | -0.8 | |
| Liberal Democrat | Christopher Brocklebank-Fowler | 18,516 | 27.0 | -6.9 | |
| Labour | CJ Needle | 12,422 | 18.1 | +5.4 | |
| Green | S Ross-Wagenknecht | 702 | 1.0 | +1.0 | |
| Natural Law | N Clark | 320 | 0.5 | +0.5 | |
| Independent | R Peacock | 304 | 0.4 | +0.4 | |
| Independent Conservative | R Watkins | 232 | 0.3 | +0.3 | |
| Majority | 17,565 | 25.6 | +6.0 | ||
| Turnout | 68,577 | 83.99 | -3.03 | ||
| Conservative hold | Swing | +3.0 | |||
Elections in the 1980s
| Party | Candidate | Votes | % | ± | |
|---|---|---|---|---|---|
| Conservative | John MacGregor | 33,912 | 53.4 | -0.8 | |
| Liberal | RAP Carden | 21,494 | 33.9 | +1.1 | |
| Labour | L Addison | 8,047 | 12.7 | -0.3 | |
| Majority | 12,418 | 19.6 | -1.8 | ||
| Turnout | 63,453 | 80.96 | +3.75 | ||
| Conservative hold | Swing | -0.9 | |||
| Party | Candidate | Votes | % | ± | |
|---|---|---|---|---|---|
| Conservative | John MacGregor | 30,747 | 54.2 | -0.3 | |
| Liberal | RA Carden | 18,612 | 32.8 | +17.5 | |
| Labour | HA Holzer | 7,408 | 13.0 | -17.2 | |
| Majority | 12,135 | 21.4 | +9.4 | ||
| Turnout | 56,767 | 77.21 | -1.94 | ||
| Conservative hold | Swing | +4.7 | |||
Elections in the 1970s
| Party | Candidate | Votes | % | ± | |
|---|---|---|---|---|---|
| Conservative | John MacGregor | 42,792 | 54.5 | +9.0 | |
| Labour | PJ Davies | 23,755 | 30.2 | -2.6 | |
| Liberal | J Bristol | 11,990 | 15.3 | -5.9 | |
| Majority | 19,037 | 24.2 | +11.5 | ||
| Turnout | 78,537 | 78.35 | +2.15 | ||
| Conservative hold | Swing | +5.8 | |||
| Party | Candidate | Votes | % | ± | |
|---|---|---|---|---|---|
| Conservative | John MacGregor | 31,478 | 45.5 | +1.2 | |
| Labour | H Gray | 22,713 | 32.8 | +3.2 | |
| Liberal | M Scott | 14,687 | 21.2 | -4.4 | |
| United Democratic Party | CC Fairhead | 317 | 0.5 | +0.0 | |
| Majority | 8,765 | 12.7 | -2.1 | ||
| Turnout | 69195 | 76.20 | -6.59 | ||
| Conservative hold | Swing | -1.0 | |||
| Party | Candidate | Votes | % | ± | |
|---|---|---|---|---|---|
| Conservative | John MacGregor | 33,059 | 44.3 | ||
| Labour | RJ Truman | 22,040 | 29.6 | ||
| Liberal | M Scott | 19,115 | 25.6 | ||
| Independent Progressive | CC Fairhead | 337 | 0.5 | ||
| Majority | 11,019 | 14.8 | |||
| Turnout | 74,551 | 82.79 | |||
| Conservative hold | Swing | ||||
| Party | Candidate | Votes | % | ± | |
|---|---|---|---|---|---|
| Conservative | John Hill | 22,614 | 51.9 | ||
| Labour | Cyril Shaw | 17,172 | 39.4 | ||
| Liberal | Basil Goldstone | 3,811 | 8.7 | ||
| Majority | 5,442 | 12.5 | |||
| Turnout | 43,597 | 78.50 | |||
| Conservative hold | Swing | ||||
Elections in the 1960s
| Party | Candidate | Votes | % | ± | |
|---|---|---|---|---|---|
| Conservative | John Hill | 16,968 | 44.78 | ||
| Labour | Geoffrey B L Bennett | 16,849 | 44.46 | ||
| Liberal | Robert L Crouch | 4,079 | 10.76 | ||
| Majority | 119 | 0.31 | |||
| Turnout | 81.40 | ||||
| Conservative hold | Swing | ||||
| Party | Candidate | Votes | % | ± | |
|---|---|---|---|---|---|
| Conservative | John Hill | 17,178 | 46.42 | ||
| Labour | Frank R Thompson | 15,012 | 40.56 | ||
| Liberal | Barry HP Turner | 4,819 | 13.02 | ||
| Majority | 2,166 | 5.85 | |||
| Turnout | 82.66 | ||||
| Conservative hold | Swing | ||||
Elections in the 1950s
| Party | Candidate | Votes | % | ± | |
|---|---|---|---|---|---|
| Conservative | John Hill | 19,275 | 53.8 | +1.7 | |
| Labour | John MacLennan Stewart | 16,542 | 46.2 | −1.7 | |
| Majority | 2,733 | 7.6 | +3.5 | ||
| Turnout | 35,817 | 82.4 | +0.6 | ||
| Conservative hold | Swing | +1.7 | |||
| Party | Candidate | Votes | % | ± | |
|---|---|---|---|---|---|
| Conservative | John Hill | 18,690 | 52.1 | +0.6 | |
| Labour | John MacLennan Stewart | 17,215 | 47.9 | −0.6 | |
| Majority | 1,475 | 4.11 | +1.2 | ||
| Turnout | 35,905 | 81.8 | |||
| Conservative hold | Swing | +0.6 | |||
| Party | Candidate | Votes | % | ± | |
|---|---|---|---|---|---|
| Conservative | John Hill | 15,119 | 51.5 | −3.0 | |
| Labour | John MacLennan Stewart | 14,254 | 48.5 | +3.0 | |
| Majority | 865 | 2.9 | −6.1 | ||
| Turnout | 29,373 | ||||
| Conservative hold | Swing | −3.0 | |||
| Party | Candidate | Votes | % | ± | |
|---|---|---|---|---|---|
| Conservative | Peter Baker | 19,610 | 54.5 | +4.0 | |
| Labour | Lynton Scutts | 16,371 | 45.5 | +1.8 | |
| Majority | 3,239 | 9.0 | +3.2 | ||
| Turnout | 35,981 | 82.4 | −1.2 | ||
| Conservative hold | Swing | +1.1 | |||
| Party | Candidate | Votes | % | ± | |
|---|---|---|---|---|---|
| Conservative | Peter Baker | 18,143 | 50.5 | +18.0 | |
| Labour | Christopher Mayhew | 15,714 | 43.7 | −6.6 | |
| Liberal | George Q Bryant | 2,097 | 5.8 | N/A | |
| Majority | 2,439 | 6.8 | N/A | ||
| Turnout | 35,954 | 83.6 | +24.6 | ||
| Conservative gain from Labour | Swing | +12.3 | |||
Election in the 1940s
| Party | Candidate | Votes | % | ± | |
|---|---|---|---|---|---|
| Labour | Christopher Mayhew | 16,825 | 50.3 | +8.2 | |
| Conservative | John Sandeman Allen | 10,862 | 32.5 | −25.4 | |
| Ind. Conservative | J Holt Wilson | 5,761 | 17.2 | N/A | |
| Majority | 5,963 | 17.8 | N/A | ||
| Turnout | 33,448 | 69.0 | −4.5 | ||
| Registered electors | 48,451 | ||||
| Labour gain from Conservative | Swing | +16.8 | |||
Elections in the 1930s
| Party | Candidate | Votes | % | ± | |
|---|---|---|---|---|---|
| Conservative | James Christie | 18,420 | 57.9 | −7.6 | |
| Labour | Colin Clark | 13,409 | 42.1 | +7.6 | |
| Majority | 5,011 | 15.8 | −15.2 | ||
| Turnout | 31,829 | 73.5 | −4.3 | ||
| Registered electors | 43,294 | ||||
| Conservative hold | Swing | −7.6 | |||
| Party | Candidate | Votes | % | ± | |
|---|---|---|---|---|---|
| Conservative | James Christie | 21,195 | 65.5 | +23.5 | |
| Labour | Edwin Gooch | 11,148 | 34.5 | - | |
| Majority | 10,047 | 31.0 | +23.5 | ||
| Turnout | 32,343 | 77.8 | +1.8 | ||
| Registered electors | 41,551 | ||||
| Conservative hold | Swing | +11.8 | |||
Elections in the 1920s
| Party | Candidate | Votes | % | ± | |
|---|---|---|---|---|---|
| Unionist | James Christie | 12,978 | 42.0 | −13.5 | |
| Labour | George Young | 10,686 | 34.5 | −10.0 | |
| Liberal | Ieuan Watkins-Evans | 7,268 | 23.5 | N/A | |
| Majority | 2,292 | 7.5 | −3.5 | ||
| Turnout | 30,932 | 76.0 | −0.5 | ||
| Registered electors | 40,701 | ||||
| Unionist hold | Swing | −1.7 | |||
| Party | Candidate | Votes | % | ± | |
|---|---|---|---|---|---|
| Unionist | James Christie | 14,189 | 55.5 | +7.4 | |
| Labour | George Edwards | 11,376 | 44.5 | −7.4 | |
| Majority | 2,813 | 11.0 | N/A | ||
| Turnout | 25,565 | 76.5 | +8.2 | ||
| Registered electors | 33,409 | ||||
| Unionist gain from Labour | Swing | +7.4 | |||
| Party | Candidate | Votes | % | ± | |
|---|---|---|---|---|---|
| Labour | George Edwards | 11,682 | 51.9 | +7.5 | |
| Unionist | Thomas William Hay | 10,821 | 48.1 | −7.5 | |
| Majority | 861 | 3.8 | N/A | ||
| Turnout | 22,503 | 68.3 | −2.5 | ||
| Registered electors | 32,937 | ||||
| Labour gain from Unionist | Swing | +7.5 | |||
| Party | Candidate | Votes | % | ± | |
|---|---|---|---|---|---|
| Unionist | Thomas William Hay | 12,734 | 45.7 | N/A | |
| Labour | George Edwards | 10,159 | 44.4 | +8.7 | |
| Majority | 861 | 3.8 | N/A | ||
| Turnout | 22,893 | 70.8 | +15.0 | ||
| Registered electors | 32,326 | ||||
| Unionist gain from Liberal | Swing | N/A | |||
| Party | Candidate | Votes | % | ± | |
|---|---|---|---|---|---|
| Labour | George Edwards | 8,594 | 45.7 | +10.0 | |
| Coalition Liberal | James Henley Batty | 6,476 | 34.5 | N/A | |
| Liberal | Charles Roberts | 3,718 | 19.8 | −44.5 | |
| Majority | 2,118 | 11.2 | −17.4 | ||
| Turnout | 18,788 | 58.5 | +2.7 | ||
| Registered electors | 32,131 | ||||
| Labour gain from Liberal | Swing | ||||
Elections in the 1910s
| Party | Candidate | Votes | % | ± | |
|---|---|---|---|---|---|
| Liberal | William Cozens-Hardy | 11,755 | 64.3 | +4.7 | |
| Labour | George Edwards | 6,536 | 35.7 | N/A | |
| Majority | 5,219 | 28.6 | +9.4 | ||
| Turnout | 18,291 | 55.8 | −25.5 | ||
| Registered electors | 32,796 | ||||
| Liberal hold | Swing | N/A | |||
| Party | Candidate | Votes | % | ± | |
|---|---|---|---|---|---|
| Liberal | Arthur Wellesley Soames | 4,740 | 59.6 | +3.2 | |
| Conservative | T.S. Timmis | 3,212 | 40.4 | −3.2 | |
| Majority | 1,528 | 19.2 | +6.4 | ||
| Turnout | 7,952 | 81.3 | −5.4 | ||
| Registered electors | 9,779 | ||||
| Liberal hold | Swing | +3.2 | |||
| Party | Candidate | Votes | % | ± | |
|---|---|---|---|---|---|
| Liberal | Arthur Wellesley Soames | 4,781 | 56.4 | −0.7 | |
| Conservative | E.R.A. Kerrison | 3,694 | 43.6 | +0.7 | |
| Majority | 1,087 | 12.8 | −1.4 | ||
| Turnout | 8,475 | 86.7 | +1.7 | ||
| Registered electors | 9,779 | ||||
| Liberal hold | Swing | −0.7 | |||
Elections in the 1900s
| Party | Candidate | Votes | % | ± | |
|---|---|---|---|---|---|
| Liberal | Arthur Wellesley Soames | 4,677 | 57.1 | +4.3 | |
| Conservative | Edward Mann | 3,519 | 42.9 | −4.3 | |
| Majority | 1,158 | 14.2 | +8.6 | ||
| Turnout | 8,196 | 85.0 | +6.8 | ||
| Registered electors | 9,643 | ||||
| Liberal hold | Swing | +4.3 | |||
| Party | Candidate | Votes | % | ± | |
|---|---|---|---|---|---|
| Liberal | Arthur Wellesley Soames | 3,986 | 52.8 | +8.2 | |
| Conservative | Edward Mann | 3,566 | 47.2 | −8.2 | |
| Majority | 420 | 5.6 | N/A | ||
| Turnout | 7,552 | 78.2 | −0.3 | ||
| Registered electors | 9,654 | ||||
| Liberal gain from Liberal Unionist | Swing | +8.2 | |||
Elections in the 1890s
| Party | Candidate | Votes | % | ± | |
|---|---|---|---|---|---|
| Liberal | Arthur Wellesley Soames | 4,626 | 58.4 | N/A | |
| Conservative | John Sancroft Holmes[17] | 3,296 | 41.6 | −3.0 | |
| Majority | 1,330 | 16.8 | N/A | ||
| Turnout | 7,922 | 82.3 | +3.8 | ||
| Registered electors | 9,625 | ||||
| Liberal gain from Liberal Unionist | Swing | N/A | |||
| Party | Candidate | Votes | % | ± | |
|---|---|---|---|---|---|
| Liberal Unionist | Francis Taylor | 4,281 | 55.4 | +0.6 | |
| Liberal | Thomas Hamer Dolbey[18] | 3,445 | 44.6 | −0.6 | |
| Majority | 836 | 10.8 | +1.2 | ||
| Turnout | 7,726 | 78.5 | −5.9 | ||
| Registered electors | 9,847 | ||||
| Liberal Unionist hold | Swing | +0.6 | |||
| Party | Candidate | Votes | % | ± | |
|---|---|---|---|---|---|
| Liberal Unionist | Francis Taylor | 4,288 | 54.8 | N/A | |
| Liberal | Arthur Kitching | 3,535 | 45.2 | N/A | |
| Majority | 753 | 9.6 | N/A | ||
| Turnout | 7,823 | 88.4 | N/A | ||
| Registered electors | 8,848 | ||||
| Liberal Unionist hold | Swing | N/A | |||
Elections in the 1880s
| Party | Candidate | Votes | % | ± | |
|---|---|---|---|---|---|
| Liberal Unionist | Francis Taylor | Unopposed | |||
| Liberal Unionist gain from Liberal | |||||
| Party | Candidate | Votes | % | ± | |
|---|---|---|---|---|---|
| Liberal | Francis Taylor | 4,530 | 55.8 | +22.5 | |
| Conservative | Robert Buxton | 3,588 | 44.2 | −22.5 | |
| Majority | 942 | 11.6 | +11.6 | ||
| Turnout | 8,118 | 80.1 | +1.5 (est) | ||
| Registered electors | 10,141 | ||||
| Liberal hold | Swing | +22.5 | |||
| Party | Candidate | Votes | % | ± | |
|---|---|---|---|---|---|
| Conservative | Robert Buxton | 2,917 | 33.4 | −0.6 | |
| Liberal | Robert Gurdon | 2,906 | 33.3 | −2.2 | |
| Conservative | Clare Sewell Read | 2,905 | 33.3 | +2.8 | |
| Turnout | 5,823 (est) | 78.6 (est) | +3.3 | ||
| Registered electors | 7,412 | ||||
| Majority | 11 | 0.1 | −3.4 | ||
| Conservative hold | Swing | −1.0 | |||
| Majority | 1 | 0.0 | N/A | ||
| Liberal gain from Conservative | Swing | −1.8 | |||
Elections in the 1870s
| Party | Candidate | Votes | % | ± | |
|---|---|---|---|---|---|
| Conservative | Clare Sewell Read | 3,146 | 35.5 | −4.1 | |
| Conservative | Robert Buxton | 3,010 | 34.0 | −5.0 | |
| Liberal | Robert Gurdon | 2,699 | 30.5 | +9.1 | |
| Majority | 311 | 3.5 | −14.1 | ||
| Turnout | 5,777 (est) | 75.3 (est) | +13.6 | ||
| Registered electors | 7,667 | ||||
| Conservative hold | Swing | −4.3 | |||
| Conservative hold | Swing | −4.8 | |||
| Party | Candidate | Votes | % | ± | |
|---|---|---|---|---|---|
| Conservative | Robert Buxton | 2,868 | 53.0 | −25.6 | |
| Liberal | Robert Gurdon | 2,547 | 47.0 | +25.6 | |
| Majority | 321 | 5.9 | −11.7 | ||
| Turnout | 5,415 | 70.2 | +8.5 | ||
| Registered electors | 7,719 | ||||
| Conservative hold | Swing | −25.6 | |||
- Caused by Howes' death.
Elections in the 1860s
| Party | Candidate | Votes | % | ± | |
|---|---|---|---|---|---|
| Conservative | Clare Sewell Read | 3,097 | 39.6 | N/A | |
| Conservative | Edward Howes | 3,053 | 39.0 | N/A | |
| Liberal | Henry Lombard Hudson[20] | 1,679 | 21.4 | N/A | |
| Majority | 1,374 | 17.6 | N/A | ||
| Turnout | 4,754 (est) | 61.7 (est) | N/A | ||
| Registered electors | 7,709 | ||||
| Conservative win (new seat) | |||||
| Conservative win (new seat) | |||||
See also
Notes and references
- Notes
- ↑ A county constituency (for the purposes of election expenses and type of returning officer)
- ↑ As with all constituencies, the constituency elects one Member of Parliament (MP) by the first past the post system of election at least every five years. However from 1868-85 the constituency elected two members (see history)
- ↑ Where the hustings stood, at which nominations were made, votes cast before the introduction of multiple polling districts in county constituencies and the result was declared)
- References
- ↑ "Electorate Figures - Boundary Commission for England". 2011 Electorate Figures. Boundary Commission for England. 4 March 2011. Archived from the original on 6 November 2010. Retrieved 13 March 2011.
- ↑ 2010 post-revision map non-metropolitan areas and unitary authorities of England
- 1 2 3 Leigh Rayment's Historical List of MPs – Constituencies beginning with "N" (part 2)
- ↑ "Statement of Persons Nominated - South Norfolk Constituency" (PDF). South Norfolk Council. Retrieved 12 May 2017.
- ↑ "Election Data 2015". Electoral Calculus. Archived from the original on 17 October 2015. Retrieved May 15, 2017.
- ↑ https://www.bbc.co.uk/news/politics/constituencies/E14000941
- ↑ http://electionresults.blogspot.co.uk/2013/05/norfolk-south-2015.html
- ↑ http://ukpollingreport.co.uk/2015guide/norfolksouth/
- ↑ http://electionresults.blogspot.co.uk/2013/05/norfolk-south-2015.html
- ↑ https://twitter.com/catherinerowett
- ↑ "Election Data 2010". Electoral Calculus. Archived from the original on 17 November 2015. Retrieved 14 May 2017.
- ↑ "Politics Resources". Election 1992. Politics Resources. 9 April 1992. Retrieved 2010-12-06.
- ↑
- ↑
- 1 2 3 4 5 6 7 8 Craig, F.W.S., ed. (1969). British parliamentary election results 1918-1949. Glasgow: Springer International Publishing AG. p. 419. Retrieved 14 May 2017.
- 1 2 3 4 5 6 7 8 9 Craig, FWS, ed. (1974). British Parliamentary Election Results: 1885-1918. London: Macmillan Press. p. 355.
- ↑ "The nominations". Diss Express. 13 May 1898. p. 5. Retrieved 22 November 2017.
- ↑ "Another vacated seat". Western Times. 25 Apr 1898. p. 4. Retrieved 22 November 2017.
- 1 2 3 4 Craig, F. W. S., ed. (1977). British Parliamentary Election Results 1832-1885 (e-book)
|format=requires|url=(help) (1st ed.). London: Macmillan Press. ISBN 978-1-349-02349-3. - ↑ "South Norfolk Election". Norfolk Chronicle. 28 November 1868. pp. 9–10. Retrieved 11 March 2018 – via British Newspaper Archive. (Subscription required (help)).
Sources
- Boundaries of Parliamentary Constituencies 1885-1972, compiled and edited by F.W.S. Craig (Parliamentary Reference Publications 1972)
- British Parliamentary Constituencies: A Statistical Compendium, by Ivor Crewe and Anthony Fox (Faber and Faber 1984)
- British Parliamentary Election Results 1832-1885, compiled and edited by F.W.S. Craig (The Macmillan Press 1977)
- British Parliamentary Election Results 1885-1918, compiled and edited by F.W.S. Craig (Macmillan Press 1974)
- British Parliamentary Election Results 1918-1949, compiled and edited by F.W.S. Craig (Macmillan Press, revised edition 1977)
- British Parliamentary Election Results 1950-1973, compiled and edited by F.W.S. Craig (Parliamentary Research Services 1983)
- Social Geography of British Elections 1885-1910. by Henry Pelling (Macmillan 1967)
- Who's Who of British Members of Parliament: Volume I 1832-1885, edited by M. Stenton (The Harvester Press 1976)
- Who's Who of British Members of Parliament, Volume II 1886-1918, edited by M. Stenton and S. Lees (Harvester Press 1978)
- Who's Who of British Members of Parliament, Volume III 1919-1945, edited by M. Stenton and S. Lees (Harvester Press 1979)
- Who's Who of British Members of Parliament, Volume IV 1945-1979, edited by M. Stenton and S. Lees (Harvester Press 1981)