Aberdeen South (UK Parliament constituency)
Coordinates: 57°05′42″N 2°07′59″W / 57.095°N 2.133°W
| Aberdeen South | |
|---|---|
|
Burgh constituency for the House of Commons | |
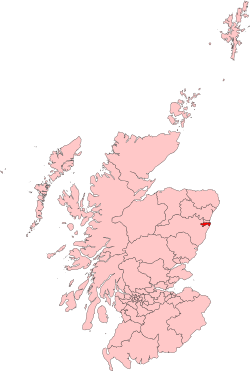 Boundary of Aberdeen South in Scotland for the 2005 general election. | |
| Subdivisions of Scotland | City of Aberdeen |
| Electorate | 69,332 |
| Current constituency | |
| Created | 1885 |
| Member of parliament | Ross Thomson (Conservative) |
| Number of members | One |
| Created from | Aberdeen |
| Overlaps | |
| Scottish Parliament | North East Scotland |
| European Parliament constituency | Scotland |
Aberdeen South is a burgh constituency of the House of Commons of the Parliament of the United Kingdom and it elects one Member of Parliament (MP) by the first past the post system of election. The current MP is Ross Thomson of the Conservative Party.
The constituency was first used in the 1885 general election, but has undergone boundary changes since then. There was also an Aberdeen South Holyrood constituency, a constituency of the Scottish Parliament,[1] created in 1999 with the boundaries of the Westminster constituency at that time. In 2011 the Scottish Parliament constituency of Aberdeen South was abolished and replaced with the Aberdeen South and North Kincardine constituency.
Boundaries
| Council areas grouped by the Fifth Review |
 |
| Aberdeen City and Aberdeenshire |
Current
As redefined by the Fifth Review of the Boundary Commission for Scotland, and subsequently first used in the 2005 general election,[2] Aberdeen South is entirely within the Aberdeen City council area and one of five constituencies covering that council area and the Aberdeenshire council area.
To the south and west of Aberdeen South there is West Aberdeenshire and Kincardine, which is entirely within the Aberdeenshire area. To the north there is Aberdeen North which, like Aberdeen South is entirely within the Aberdeen City area. Further north there is Gordon, which covers part of the Aberdeen City area and part of the Aberdeenshire area. To the north of Gordon there is Banff and Buchan which, like West Aberdeenshire and Kincardine, is entirely within the Aberdeenshire area.
Historic
1885 to 1918
From 1832 to 1885 there was a single Aberdeen constituency. Prior to 1832, the burgh of Aberdeen had been represented as a component of the Aberdeen Burghs constituency.
When Aberdeen South was created by the Redistribution of Seats Act 1885 and first used in the 1885 general election, so was Aberdeen North. Aberdeen South then consisted of the municipal wards of St Nicholas, Rosemount, Rubislaw and Ferryhill, and the 9th Parliamentary Polling District.[3] The rest of the county of Aberdeen was covered by the county constituencies of Eastern Aberdeenshire and Western Aberdeenshire.[4]
The same boundaries were used in the 1886 general election, the 1892 general election, the 1895 general election, the 1900 general election, the 1906 general election, the January 1910 general election and the December 1910 general election.
1918 to 1950
In 1918 constituency boundaries were redefined by the Representation of the People Act 1918. By then the City of Aberdeen had been created; Aberdeen North and Aberdeen South became the two constituencies covering the city (which was one of four counties of cities in Scotland) and entirely within the city. The new boundaries were first used in the 1918 general election, and Aberdeen South then consisted of the wards of Ferryhill, Rosemount, Rubislaw, Ruthrieston and St Nicholas.[4] The county of Aberdeen was covered by Aberdeen and Kincardine East, Central Aberdeenshire and Kincardine and West Aberdeenshire. East Aberdeenshire and West Aberdeenshire were entirely within the county of Aberdeen. Kincardine and West Aberdeenshire covered the county of Kincardine (minus the burgh of Inverbervie, which was included in Montrose Burghs) and part of the county of Aberdeen.
The same boundaries were used in the 1922, 1923, 1924, 1929, 1931, 1935 and 1945 general elections.
1950 to 1955
For the 1950 general election boundaries were redefined again, by the House of Commons (Redistribution of Seats) Act 1949. A new list of wards defined Aberdeen South - Ferryhill, Holburn, Rosemount, Rubislaw, Ruthrieston and Torry[4] - but the City of Aberdeen remained a two-constituency city, divided between Aberdeen South and Aberdeen North, with both constituencies entirely within the city.
The county of Aberdeen was now again divided between East Aberdeenshire and West Aberdeenshire, with both of these constituencies entirely within the county.
The same boundaries were used for the 1951 general election.
1955 to 1983
By the time of the 1955 general election, a boundary review had taken account of a small enlargement of the city area. However, the same list of wards - Ferryhill, Holburn, Rosemount, Rubislaw, Ruthrieston and Torry[4] - continued to define Aberdeen South, and the same boundaries were used for the 1959 general election, the 1964 general election, the 1966 general election, the 1970 general election, the February 1974 general election and the October 1974 general election.
In 1975, throughout Scotland, under the Local Government (Scotland) Act 1973, counties were abolished, and the City of Aberdeen was enlarged to include areas formerly within the county of Aberdeen and the county of Kincardine. Also, the city became a district within the Grampian region. The enlarged city included areas covered by the constituencies of West Aberdeenshire and North Angus and Mearns. North Angus and Mearns had been created in 1950 to cover the county of Kincardine and part of the county of Angus.
The 1979 general election was held before a review of constituency boundaries took account of new local government boundaries.
1983 to 1997
For the 1983 election, the electoral wards used to create this seat were Rosemount, Rubislaw, St Clements, St Nicholas, Hazlehead, Holburn, Ferryhill, Torry, Nigg.[5]
The 1983 general election, the 1987 general election and the 1992 general election took place during this period. At the 1992 General Election the constituency was the only seat which Labour had won at the 1987 election to be gained by the Conservatives.
In 1996, under the Local Government etc (Scotland) Act 1994, local government regions and districts were abolished and the city became one of 32 unitary council areas of Scotland. Also, the name of the city became, officially, Aberdeen City.
1997 to 2005
As redefined for the 1997 general election Aberdeen South was one of three constituencies covering and entirely within the Aberdeen City area, the other two being Aberdeen North and Aberdeen Central. Aberdeen South shared boundaries with both of the other two constituencies.
The same boundaries were used for the 2001 general election.
Constituency profile and voting patterns

Constituency profile
The Aberdeen South constituency is an affluent suburban constituency located along the south of the Aberdeen City Council area. The seat covers most of Aberdeen's affluent West End and the outer suburbs of Bieldside, Cults, Milltimber and Peterculter. Situated within the constituency are some of Scotland's most affluent neighbourhoods, including Broomhill, Rubislaw and Queen's Cross, which was named the wealthiest part of Scotland in 2003.[6][7] The seat also extends south-east across the River Dee to cover the suburb of Cove Bay and the more deprived neighbourhoods of Torry and Kincorth.
Voting patterns
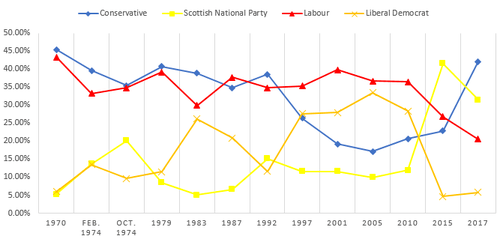
Aberdeen South was traditionally a strong Liberal Party constituency until it was won by the Unionist Party at the 1918 general election. The constituency subsequently went on to return Unionist MPs to Parliament until the party amalgamated with the Conservatives in 1965. The constituency developed into a Unionist-Labour marginal in 1964 and was gained by Labour's Donald Dewar in 1966, who went on to become the leader of the Scottish Labour Party and later the first-ever First Minister of Scotland in 1999. From the 1970 general election onwards, Aberdeen South returned Conservative MPs to Parliament. The seat was gained by Labour in 1987 and regained by the Conservatives in 1992. At Labour's 1997 landslide election victory Aberdeen South fell to Labour's Anne Begg, who represented the constituency until the 2015 general election when the constituency was gained by Callum McCaig of the Scottish National Party. Throughout the 2000s, the Liberal Democrats emerged as the main challenger to Labour in Aberdeen South, taking second place in 2005 behind Labour by just 3.2% of the vote. In the Scottish Parliament the equivalent Aberdeen South constituency was represented by the Liberal Democrats from 1999 until 2011, when the constituency of Aberdeen South and North Kincardine was gained by the SNP. Recently the Conservatives have made a set of substantial advances in Aberdeen South, making gains in the constituency at the 2015 UK general election despite seeing a drop in their national vote share across Scotland. At the 2016 Scottish Parliament election the Conservatives finished in second place in the Aberdeen South and North Kincardine constituency, more than doubling their vote share in the constituency and coming behind the SNP by 8.5% of the vote.
Ross Thomson of the Conservatives went on to gain the seat at the 2017 snap general election with a majority of 4,752 votes (10.6%) ahead of the sitting SNP MP Callum McCaig.
Members of Parliament
Election results
Elections in the 2010s
2017 general election
| Party | Candidate | Votes | % | ± | |
|---|---|---|---|---|---|
| Conservative | Ross Thomson | 18,746 | 42.1 | +19.3 | |
| SNP | Callum McCaig | 13,994 | 31.5 | -10.2 | |
| Labour | Callum O'Dwyer | 9,143 | 20.6 | -6.2 | |
| Liberal Democrat | Jenny Wilson | 2,600 | 5.8 | +1.2 | |
| Majority | 4,752 | 10.6 | n/a | ||
| Turnout | 44,556 | 68.6 | -2.7 | ||
| Conservative gain from SNP | Swing | +14.8 | |||
2015 general election
| Party | Candidate | Votes | % | ± | |
|---|---|---|---|---|---|
| SNP | Callum McCaig | 20,221 | 41.6 | +29.8 | |
| Labour | Anne Begg | 12,991 | 26.8 | −9.8 | |
| Conservative | Ross Thomson | 11,087 | 22.8 | +2.1 | |
| Liberal Democrat | Denis Rixon | 2,252 | 4.6 | −23.7 | |
| Scottish Green | Dan Yeats | 964 | 2.0 | +1.0 | |
| UKIP | Sandra Skinner | 897 | 1.8 | N/A | |
| Independent | Christopher Gray | 139 | 0.3 | N/A | |
| Majority | 7,230 | 14.9 | +23.0 | ||
| Turnout | 48,551 | 71.3 | +4.1 | ||
| SNP gain from Labour | Swing | +19.8 | |||
2010 general election
| Party | Candidate | Votes | % | ± | |
|---|---|---|---|---|---|
| Labour | Anne Begg | 15,722 | 36.5 | −0.2 | |
| Liberal Democrats | John Sleigh | 12,216 | 28.4 | −5.1 | |
| Conservative | Amanda Harvie | 8,914 | 20.7 | +3.6 | |
| SNP | Mark McDonald | 5,102 | 11.9 | +2.0 | |
| BNP | Susan Ross | 529 | 1.2 | N/A | |
| Scottish Green | Rhonda Reekie | 413 | 1.0 | −0.9 | |
| SACL | Robert Green | 138 | 0.3 | N/A | |
| Majority | 3,506 | 8.1 | +4.9 | ||
| Turnout | 43,034 | 67.2 | +5.1 | ||
| Labour hold | Swing | 2.5 | |||
Elections in the 2000s
2005 general election
| Party | Candidate | Votes | % | ± | |
|---|---|---|---|---|---|
| Labour | Anne Begg | 15,272 | 36.7 | −1.3 | |
| Liberal Democrat | Vicki Harris | 13,924 | 33.5 | +4.9 | |
| Conservative | Stewart Whyte | 7,134 | 17.1 | −2.7 | |
| SNP | Maureen Watt | 4,120 | 9.9 | −2.3 | |
| Scottish Green | Rhonda Reekie | 768 | 1.8 | N/A | |
| Scottish Socialist | Donald Munro | 403 | 1.0 | −0.4 | |
| Majority | 1,348 | 3.2 | -8.7 | ||
| Turnout | 41,621 | 62.1 | +2.4 | ||
| Labour hold | Swing | −3.1 | |||
2001 general election
| Party | Candidate | Votes | % | ± | |
|---|---|---|---|---|---|
| Labour | Anne Begg | 14,696 | 39.8 | +4.6 | |
| Liberal Democrat | Ian Yuill | 10,308 | 27.9 | +0.3 | |
| Conservative | Moray Macdonald | 7,098 | 19.2 | −7.1 | |
| SNP | Ian Angus | 4,293 | 11.6 | +1.9 | |
| Scottish Socialist | David Watt | 495 | 1.3 | N/A | |
| Majority | 4,388 | 11.9 | +4.2 | ||
| Turnout | 36,890 | 62.5 | −10.3 | ||
| Labour hold | Swing | +2.5 | |||
Elections in the 1990s
1997 general election
| Party | Candidate | Votes | % | ± | |
|---|---|---|---|---|---|
| Labour | Anne Begg | 15,541 | 35.3 | +11.4 | |
| Liberal Democrat | Nicol Stephen | 12,176 | 27.6 | +1.0 | |
| Conservative | Raymond Robertson | 11,621 | 26.4 | −11.0 | |
| SNP | Jim Towers | 4,299 | 11.6 | −2.3 | |
| Referendum | Ric Wharton | 425 | 1.0 | N/A | |
| Majority | 3,365 | 7.7 | +4.0 | ||
| Turnout | 44,062 | 72.8 | +2.6 | ||
| Labour gain from Conservative | Swing | +11.2 | |||
1992 general election
| Party | Candidate | Votes | % | ± | |
|---|---|---|---|---|---|
| Conservative | 37.4 | N/A | |||
| Liberal Democrat | 26.6 | N/A | |||
| Labour | 23.9 | N/A | |||
| SNP | 12.0 | N/A | |||
| Majority | 10.8 | N/A | |||
| Party | Candidate | Votes | % | ± | |
|---|---|---|---|---|---|
| Conservative | Raymond Robertson | 15,808 | 38.5 | +3.6 | |
| Labour | Frank Doran | 14,291 | 34.8 | −2.9 | |
| SNP | James Davidson | 6,223 | 15.1 | +8.6 | |
| Liberal Democrat | Irene Keith | 4,767 | 11.6 | −9.3 | |
| Majority | 1,517 | 3.7 | +0.9 | ||
| Turnout | 41,089 | 70.2 | +3.1 | ||
| Conservative gain from Labour | Swing | +3.3 | |||
Elections in the 1980s
1987 general election
| Party | Candidate | Votes | % | ± | |
|---|---|---|---|---|---|
| Labour | Frank Doran | 15,917 | 37.7 | +7.8 | |
| Conservative | Gerry Malone | 14,719 | 34.8 | −4.1 | |
| Social Democratic | Ian Philip | 8,844 | 20.9 | −5.3 | |
| SNP | Michael Weir | 2,776 | 6.6 | +1.6 | |
| Majority | 1,198 | 2.9 | -6.2 | ||
| Turnout | 42,256 | 67.1 | -1.6 | ||
| Labour gain from Conservative | Swing | +6.0 | |||
1983 general election
| Party | Candidate | Votes | % | ± | |
|---|---|---|---|---|---|
| Conservative | Gerry Malone | 15,393 | 38.9 | -1.92 | |
| Labour | Robert Middleton | 11,812 | 29.9 | -9.31 | |
| Social Democratic | Ian Philip | 10,372 | 26.2 | N/A | |
| SNP | Sam Coull | 1,974 | 5.0 | -3.53 | |
| Majority | 3,581 | 9.1 | +7.59 | ||
| Turnout | 39,551 | 68.7 | -9.85 | ||
| Conservative hold | Swing | -6.65 | |||
Elections in the 1970s
1979 general election
| Party | Candidate | Votes | % | ± | |
|---|---|---|---|---|---|
| Conservative | Iain Sproat | 20,820 | 40.72 | +5.25 | |
| Labour | Norman Godman | 20,048 | 39.21 | +4.44 | |
| Liberal | Helen Maud Pitt-Watson | 5,901 | 11.54 | +1.91 | |
| SNP | Alexander Stronach | 4,361 | 8.53 | -11.59 | |
| Majority | 772 | 1.51 | +0.81 | ||
| Turnout | 54,430 | 78.55 | +0.21 | ||
| Conservative hold | Swing | +4.82 | |||
October 1974 general election
| Party | Candidate | Votes | % | ± | |
|---|---|---|---|---|---|
| Conservative | Iain Sproat | 18,475 | 35.47 | -4.16 | |
| Labour | Robert Middleton | 18,110 | 34.77 | +1.57 | |
| SNP | Alexander Stronach | 10,481 | 20.12 | +6.39 | |
| Liberal | Angus Abercrombie Robbie | 5,018 | 9.63 | -3.82 | |
| Majority | 365 | 0.70 | -5.73 | ||
| Turnout | 52,204 | 76.32 | -5.85 | ||
| Conservative hold | Swing | +2.88 | |||
February 1974 general election
| Party | Candidate | Votes | % | ± | |
|---|---|---|---|---|---|
| Conservative | Iain Sproat | 21,938 | 39.63 | -6.78 | |
| Labour | Robert Middleton | 18,380 | 33.20 | -10.13 | |
| SNP | Alexander Stronach | 7,599 | 13.73 | +8.44 | |
| Liberal | Angus Abercrombie Robbie | 7,447 | 13.45 | +7.48 | |
| Majority | 3,558 | 6.43 | +4.35 | ||
| Turnout | 55,366 | 82.17 | +5.12 | ||
| Conservative hold | Swing | -8.45 | |||
1970 general election
| Party | Candidate | Votes | % | ± | |
|---|---|---|---|---|---|
| Conservative | Iain Sproat | 23,843 | 45.41 | +2.91 | |
| Labour | Donald Dewar | 22,754 | 43.33 | -2.77 | |
| Liberal | Kenneth J.B.S. McLeod | 3,135 | 5.97 | -5.53 | |
| SNP | Bruce Mavor Cockie | 2,777 | 5.29 | N/A | |
| Majority | 1,089 | 2.08 | -1.52 | ||
| Turnout | 52,509 | 77.05 | -4.25 | ||
| Conservative gain from Labour | Swing | ||||
Elections in the 1960s
1966 general election
| Party | Candidate | Votes | % | ± | |
|---|---|---|---|---|---|
| Labour | Donald Dewar | 23,291 | 46.1 | +3.65 | |
| Conservative | Priscilla Buchan | 21,492 | 42.5 | -6.5 | |
| Liberal | Norman W. King | 5,797 | 11.5 | N/A | |
| Majority | 1,799 | 3.6 | -11.5 | ||
| Turnout | 50,580 | 81.3 | -2.60 | ||
| Labour gain from Conservative | Swing | +5.6 | |||
1964 general election
| Party | Candidate | Votes | % | ± | |
|---|---|---|---|---|---|
| Unionist | Priscilla Buchan | 25,824 | 50.00 | -3.8 | |
| Labour | Donald Dewar | 21,926 | 42.45 | +5.85 | |
| SNP | John Reid | 3,898 | 7.55 | N/A | |
| Majority | 3,898 | 7.55 | -9.65 | ||
| Turnout | 51,648 | 83.80 | +2.23 | ||
| Unionist hold | Swing | +4.82 | |||
Elections in the 1950s
1959 general election
| Party | Candidate | Votes | % | ± | |
|---|---|---|---|---|---|
| Unionist | Priscilla Buchan | 25,471 | 53.8 | -3.96 | |
| Labour | Peter Doig | 17,349 | 36.6 | -5.66 | |
| Liberal | Elma Tryphosa Dangerfield | 4,558 | 9.6 | N/A | |
| Majority | 8,122 | 17.2 | +1.72 | ||
| Turnout | 47,378 | 81.57 | +0.5 | ||
| Unionist hold | Swing | -1.7 | |||
1955 general election
| Party | Candidate | Votes | % | ± | |
|---|---|---|---|---|---|
| Unionist | Priscilla Buchan | 26,817 | 57.74 | -1.01 | |
| Labour | Judith Hart | 19,627 | 42.26 | +1.01 | |
| Majority | 7,190 | 15.48 | -2.02 | ||
| Turnout | 46,444 | 81.07 | -1.62 | ||
| Unionist hold | Swing | -1.01 | |||
1951 general election
| Party | Candidate | Votes | % | ± | |
|---|---|---|---|---|---|
| Unionist | Priscilla Buchan | 28,947 | 58.75 | +5.07 | |
| Labour | Sinclair Shaw | 20,325 | 41.25 | +5.71 | |
| Majority | 8,622 | 17.50 | -0.63 | ||
| Turnout | 49,272 | 82.69 | -1.80 | ||
| Unionist hold | Swing | +5.39 | |||
1950 general election
| Party | Candidate | Votes | % | ± | |
|---|---|---|---|---|---|
| Unionist | Priscilla Buchan | 26,128 | 53.68 | +6.95 | |
| Labour | Olive R. Crutchley | 17,302 | 35.54 | - 6.64 | |
| Liberal | Richard Thomas Pirie | 5,248 | 10.78 | -0.17 | |
| Majority | 8,826 | 18.13 | +13.71 | ||
| Turnout | 58,680 | 84.89 | +12.29 | ||
| Unionist hold | Swing | +6.80 | |||
Elections in the 1940s
1946 by-election
| Party | Candidate | Votes | % | ± | |
|---|---|---|---|---|---|
| Unionist | Priscilla Buchan | 21,750 | 54.84 | +8.11 | |
| Labour | Arthur Irvine | 17,911 | 45.16 | +2.84 | |
| Majority | 3,839 | 9.68 | +5.26 | ||
| Turnout | 39,661 | ||||
| Unionist hold | Swing | +5.42 | |||
1945 general election
| Party | Candidate | Votes | % | ± | |
|---|---|---|---|---|---|
| Unionist | Douglas Thomson | 19,214 | 46.73 | -26.59 | |
| Labour | W McLaine | 17,398 | 42.32 | +10.46 | |
| Liberal | James Logie Milne | 4,501 | 10.95 | +10.95 | |
| Majority | 1,816 | 4.42 | -31.85 | ||
| Turnout | 41,113 | 72.20 | + 6.35 | ||
| Unionist hold | Swing | +13.51 | |||
Elections in the 1930s
1935 general election
| Party | Candidate | Votes | % | ± | |
|---|---|---|---|---|---|
| Unionist | Douglas Thomson | 25,270 | 68.14 | -15.54 | |
| Labour | George Rettie McIntosh | 11,817 | 31.86 | + 15.56 | |
| Majority | 13,453 | 36.27 | +4.19 | ||
| Turnout | 37,087 | 65.85 | -9.98 | ||
| Unionist hold | Swing | -15.5 | |||
1935 by-election
| Party | Candidate | Votes | % | ± | |
|---|---|---|---|---|---|
| Unionist | Douglas Thomson | 20,925 | 66.04 | -17.64 | |
| Labour | Joseph Forbes Duncan | 10,760 | 33.96 | +17.64 | |
| Majority | 10,165 | 32.08 | -35.29 | ||
| Turnout | 31,685 | ||||
| Unionist hold | Swing | ||||
1931 general election
| Party | Candidate | Votes | % | ± | |
|---|---|---|---|---|---|
| Unionist | Frederick Thomson | 33,988 | 83.68 | +22.82 | |
| Labour | George Catto | 6,627 | 16.32 | -22.88 | |
| Majority | 27,361 | 67.37 | +45.77 | ||
| Turnout | 40,115 | 75.83 | +8.63 | ||
| Unionist hold | Swing | + 22.85 | |||
Elections in the 1920s
1929 general election
| Party | Candidate | Votes | % | ± | |
|---|---|---|---|---|---|
| Unionist | Frederick Thomson | 21,548 | 60.8 | +0.7 | |
| Labour | William Martin | 13,868 | 39.2 | -0.7 | |
| Majority | 7,680 | 21.6 | +1.4 | ||
| Turnout | 35,416 | 67.2 | -1.6 | ||
| Unionist hold | Swing | -0.7 | |||
1924 general election
| Party | Candidate | Votes | % | ± | |
|---|---|---|---|---|---|
| Unionist | Frederick Thomson | 16,092 | 60.1 | +12.8 | |
| Labour | George Archibald | 10,699 | 39.9 | +10.9 | |
| Majority | 5,393 | 20.2 | +1.9 | ||
| Turnout | 26,791 | 68.8 | +8.1 | ||
| Registered electors | 38,958 | ||||
| Unionist hold | Swing | +1.0 | |||
1923 general election
| Party | Candidate | Votes | % | ± | |
|---|---|---|---|---|---|
| Unionist | Frederick Thomson | 11,258 | 47.3 | -10.7 | |
| Labour | John Paton | 6,911 | 29.0 | n/a | |
| Liberal | Charles Mallet | 5,641 | 23.7 | -18.3 | |
| Majority | 18.3 | ||||
| Turnout | |||||
| Unionist hold | Swing | ||||
1922 general election
| Party | Candidate | Votes | % | ± | |
|---|---|---|---|---|---|
| Unionist | Frederick Thomson | 13,208 | 58.0 | -4.4 | |
| Liberal | Charles Mallet | 9,573 | 42.0 | +21.2 | |
| Majority | 3,635 | 16.0 | -25.6 | ||
| Turnout | 57.5 | ||||
| Unionist hold | Swing | -12.8 | |||
Elections in the 1910s
1918 general election
| Party | Candidate | Votes | % | ± | |
|---|---|---|---|---|---|
| C | Unionist | Frederick Thomson | 10,625 | 62.4 | +21.9 |
| Liberal | John Fleming | 3,535 | 20.8 | −38.7 | |
| Independent | James Robertson Watson | 2,868 | 16.8 | N/A | |
| Majority | 7,090 | 41.6 | N/A | ||
| Turnout | 17,028 | 43.9 | −28.3 | ||
| Registered electors | 38,800 | ||||
| Unionist gain from Liberal | Swing | +30.3 | |||
| C indicates candidate endorsed by the coalition government. | |||||
1917 by-election
| Party | Candidate | Votes | % | ± | |
|---|---|---|---|---|---|
| Liberal | John Fleming | 3,283 | 64.1 | +4.6 | |
| Independent | James Robertson Watson | 1,507 | 29.4 | N/A | |
| Independent | Frederick Pethick-Lawrence | 333 | 6.5 | N/A | |
| Majority | 1,776 | 34.7 | +15.7 | ||
| Turnout | 5,123 | 37.1 | −35.1 | ||
| Registered electors | 13,791 | ||||
| Liberal hold | Swing | N/A | |||
December 1910 general election
| Party | Candidate | Votes | % | ± | |
|---|---|---|---|---|---|
| Liberal | George Esslemont | 5,862 | 59.5 | −0.9 | |
| Liberal Unionist | William C Smith | 3,997 | 40.5 | +0.9 | |
| Majority | 1,865 | 19.0 | −1.8 | ||
| Turnout | 9,859 | 72.2 | −10.7 | ||
| Registered electors | 13,657 | ||||
| Liberal hold | Swing | −0.9 | |||
January 1910 general election
| Party | Candidate | Votes | % | ± | |
|---|---|---|---|---|---|
| Liberal | George Esslemont | 6,749 | 60.4 | −14.0 | |
| Unionist | Ronald McNeill | 4,433 | 39.6 | +14.0 | |
| Majority | 2,316 | 20.8 | −28.0 | ||
| Turnout | 11,182 | 82.9 | +12.7 | ||
| Registered electors | 13,496 | ||||
| Liberal hold | Swing | −14.0 | |||
Elections in the 1900s
1907 by-election
| Party | Candidate | Votes | % | ± | |
|---|---|---|---|---|---|
| Liberal | George Esslemont | 3,779 | 42.3 | −32.1 | |
| Conservative | Ronald McNeill | 3,412 | 38.2 | +12.6 | |
| Independent Labour | Fred Bramley | 1,740 | 19.5 | N/A | |
| Majority | 367 | 4.1 | −44.7 | ||
| Turnout | 8,931 | 68.4 | −1.8 | ||
| Registered electors | 13,053 | ||||
| Liberal hold | Swing | −22.4 | |||
1906 general election
| Party | Candidate | Votes | % | ± | |
|---|---|---|---|---|---|
| Liberal | James Bryce | 6,780 | 74.4 | +21.9 | |
| Liberal Unionist | William George Black | 2,332 | 25.6 | −21.9 | |
| Majority | 4,448 | 48.8 | +43.8 | ||
| Turnout | 9,112 | 70.2 | −0.7 | ||
| Registered electors | 12,980 | ||||
| Liberal hold | Swing | +21.9 | |||
1900 general election
| Party | Candidate | Votes | % | ± | |
|---|---|---|---|---|---|
| Liberal | James Bryce | 4,238 | 52.5 | −3.6 | |
| Liberal Unionist | William Charles Smith | 3,830 | 47.5 | +3.6 | |
| Majority | 408 | 5.0 | −7.2 | ||
| Turnout | 8,068 | 70.9 | −2.1 | ||
| Registered electors | 11,383 | ||||
| Liberal hold | Swing | −3.6 | |||
Elections in the 1890s
1895 general election
| Party | Candidate | Votes | % | ± | |
|---|---|---|---|---|---|
| Liberal | James Bryce | 3,985 | 56.1 | +0.1 | |
| Liberal Unionist | David Stewart | 3,121 | 43.9 | +15.7 | |
| Majority | 864 | 12.2 | −15.6 | ||
| Turnout | 7,106 | 73.0 | +2.3 | ||
| Registered electors | 9,731 | ||||
| Liberal hold | Swing | −7.8 | |||
1892 by-election
| Party | Candidate | Votes | % | ± | |
|---|---|---|---|---|---|
| Liberal | James Bryce | Unopposed | |||
| Liberal hold | |||||
1892 general election
| Party | Candidate | Votes | % | ± | |
|---|---|---|---|---|---|
| Liberal | James Bryce | 3,513 | 56.0 | N/A | |
| Liberal Unionist | James Samuel G. McCullagh | 1,768 | 28.2 | N/A | |
| Scottish Trades Councils | Henry Hyde Champion | 991 | 15.8 | N/A | |
| Majority | 1,745 | 27.8 | N/A | ||
| Turnout | 6,272 | 70.7 | N/A | ||
| Registered electors | 8,876 | ||||
| Liberal hold | Swing | N/A | |||
Elections in the 1880s
1886 general election
| Party | Candidate | Votes | % | ± | |
|---|---|---|---|---|---|
| Liberal | James Bryce | Unopposed | |||
| Liberal hold | |||||
1885 general election
| Party | Candidate | Votes | % | ± | |
|---|---|---|---|---|---|
| Liberal | James Bryce | 4,548 | 75.8 | N/A | |
| Conservative | Colin McKenzie | 1,455 | 24.2 | N/A | |
| Majority | 3,093 | 51.6 | N/A | ||
| Turnout | 6,003 | 76.8 | N/A | ||
| Registered electors | 7,813 | ||||
| Liberal win (new seat) | |||||
References
- ↑ The boundaries of Holyrood constituencies remain as when the constituencies were created in 1999
Holyrood refers to the fact that the Scottish Parliament Building is in the Holyrood area of Edinburgh
See also Scottish Parliament constituencies and regions - ↑ Boundary Commission for Scotland website Archived 21 September 2007 at the Wayback Machine.
See also List of UK Parliamentary constituencies in Scotland - ↑ Debrett's House of Commons and the Judicial Bench, 1889
- 1 2 3 4 Boundaries of Parliamentary Constituencies 1885-1972 ( ISBN 0-900178-09-4), F. W. S. Craig 1972
- ↑ Crewe, Ivor (1983). British Parliamentary Constituencies - a statistical compendium. faber and faber. ISBN 0-571-13236-7.
- ↑ "Scotland's most expensive postcodes revealed". www.scotsman.com.
- ↑ "THE GREAT DIVIDE; Richest parts of Scotland 250 times better off than most deprived schemes. - Free Online Library". www.thefreelibrary.com.
- ↑ "General Election: SNP reselects 54 MPs". www.scotsman.com.
- ↑ "Callum O'Dwyer for Aberdeen South". www.facebook.com.
- ↑ "Election Data 2015". Electoral Calculus. Archived from the original on 17 October 2015. Retrieved 17 October 2015.
- ↑ "Archived copy". Archived from the original on 5 March 2016. Retrieved 2015-08-24.
- ↑ "Election Data 2010". Electoral Calculus. Archived from the original on 26 July 2013. Retrieved 17 October 2015.
- ↑ "BBC NEWS – Election 2010 – Aberdeen South". BBC News.
- ↑ "Election Data 2005". Electoral Calculus. Archived from the original on 15 October 2011. Retrieved 18 October 2015.
- ↑ "Election Data 2001". Electoral Calculus. Archived from the original on 15 October 2011. Retrieved 18 October 2015.
- ↑ "Election Data 1997". Electoral Calculus. Archived from the original on 15 October 2011. Retrieved 18 October 2015.
- ↑ "Election Data 1992". Electoral Calculus. Archived from the original on 15 October 2011. Retrieved 18 October 2015.
- ↑ "Politics Resources". Election 1992. Politics Resources. 9 April 1992. Retrieved 6 December 2010.
- ↑ "Election Data 1987". Electoral Calculus. Archived from the original on 15 October 2011. Retrieved 18 October 2015.
- ↑ "Election Data 1983". Electoral Calculus. Archived from the original on 15 October 2011. Retrieved 18 October 2015.
- ↑ Whitaker's Almanack, 1977
- ↑ Whitaker's Almanack 1963
- ↑ The Times, 28 November 1946
- ↑ Whitaker's Almanack, 1939
- ↑ The Times, 23 May 1935
- ↑ Whitaker's Almanack, 1934
- ↑ British Parliamentary Election Results 1918-1949, FWS Craig
- ↑ Oliver and Boyd's Edinburgh Almanack, 1927
- ↑ The Times, 8 December 1923
- ↑ British parliamentary election results 1918-1949, FWS Craig
- ↑ Whitaker's Almanack, 1920
- 1 2 3 4 5 6 7 8 9 10 11 Craig, FWS, ed. (1974). British Parliamentary Election Results: 1885-1918. London: Macmillan Press. ISBN 9781349022984.
- 1 2 Debrett's House of Commons and the Judicial Bench, 1916
- ↑ The Times, 21 February 1907
- ↑ Whitaker's Almanack, 1907
- 1 2 Debrett's House of Commons and the Judicial Bench, 1901
- ↑ Whitaker's Almanack, 1893
- 1 2 Debrett's House of Commons and Judicial Bench, 1889