Tonbridge and Malling (UK Parliament constituency)
| Tonbridge and Malling | |
|---|---|
|
County constituency for the House of Commons | |
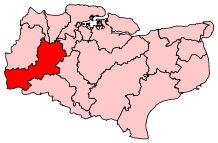 Boundary of Tonbridge and Malling in Kent. | |
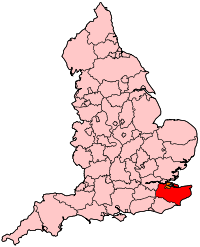 Location of Kent within England. | |
| County | Kent |
| Electorate | 72,671 (2015)[1] |
| Major settlements | Tonbridge, Edenbridge and West Malling |
| Current constituency | |
| Created | 1974 |
| Member of parliament | Tom Tugendhat (Conservative) |
| Number of members | One |
| Created from | Sevenoaks, Tonbridge |
| Overlaps | |
| European Parliament constituency | South East England |
Tonbridge and Malling is a constituency[n 1] represented in the House of Commons of the UK Parliament since 2015 by Tom Tugendhat, a Conservative.[n 2]
History
The seat was created in 1974 from parts of the seats of Sevenoaks and Tonbridge.
Boundaries
1974-1983: The Urban District of Tonbridge, the Rural District of Malling, and part of the Rural District of Tonbridge.
1983-1997: The District of Tonbridge and Malling.
1997-2010: The Borough of Tonbridge and Malling wards of Birling, Leybourne and Ryarsh, Borough Green, Cage Green, Castle, East Malling, East Peckham, Hadlow, Higham, Hildenborough, Ightham, Judd, Long Mill, Medway, Oast, Trench, Vauxhall, Wateringbury, West Malling, West Peckham and Mereworth, and Wrotham, and the District of Sevenoaks wards of Edenbridge North, Edenbridge South, Leigh, Penshurst and Fordcombe, and Somerden.
2010-present: The Borough of Tonbridge and Malling wards of Borough Green and Long Mill, Cage Green, Castle, Downs, East Malling, East Peckham and Golden Green, Hadlow, Mereworth and West Peckham, Higham, Hildenborough, Ightham, Judd, Kings Hill, Medway, Trench, Vauxhall, Wateringbury, West Malling and Leybourne, and Wrotham, and the District of Sevenoaks wards of Cowden and Hever, Edenbridge North and East, Edenbridge South and West, Leigh and Chiddingstone Causeway, and Penshurst, Fordcombe and Chiddingstone.
The constituency is in the west of the county of Kent in south eastern England and includes about two-thirds of the Borough of Tonbridge and Malling (the remainder being in the Chatham and Aylesford constituency),and parts of Sevenoaks District.
Constituency profile
This safe Conservative seat is characterised by a large commuter population although significant light engineering, farming and local service industry sectors are represented alongside the public sector, skilled trades and some construction.[2] It has good road and rail links with London. Visitor attractions in the constituency include the River Medway, the Eden Valley Walk which covers Edenbridge and Penshurst, including Hever Castle, Chiddingstone Castle, Penshurst Place and Tonbridge Castle. In this seat are numerous oast houses and remaining Wealden woodlands.
Workless claimants, registered jobseekers, were in November 2012 significantly lower than the national average of 3.8%, at 2.0% of the population based on a statistical compilation by The Guardian.[3]
Members of Parliament
| Election | Member[4] | Party | |
|---|---|---|---|
| 1974 | Sir John Stanley | Conservative | |
| 2015 | Tom Tugendhat | Conservative | |
Elections
Elections in the 2010s
| Party | Candidate | Votes | % | ± | |
|---|---|---|---|---|---|
| Conservative | Tom Tugendhat | 36,218 | 63.6 | ||
| Labour | Dylan Jones | 12,710 | 22.3 | ||
| Liberal Democrat | Keith Miller | 3,787 | 6.7 | ||
| Green | April Clark | 2,335 | 4.1 | ||
| UKIP | Collin Bullen | 1,857 | 3.3 | ||
| Majority | 23,508 | 41.3 | |||
| Turnout | 56,907 | 73.7 | |||
| Conservative hold | Swing | ||||
| Party | Candidate | Votes | % | ± | |
|---|---|---|---|---|---|
| Conservative | Tom Tugendhat[6] | 31,887 | 59.4 | ||
| UKIP | Robert Izzard[7] | 8,153 | 15.2 | ||
| Labour | Claire Leigh[8] | 7,604 | 14.2 | ||
| Liberal Democrat | Mary Varrall[9] | 3,660 | 6.8 | ||
| Green | Howard Porter | 2,366 | 4.4 | ||
| Majority | 23,734 | 44.2 | |||
| Turnout | 53,670 | 73.8 | |||
| Conservative hold | Swing | ||||
| Party | Candidate | Votes | % | ± | |
|---|---|---|---|---|---|
| Conservative | John Stanley | 29,723 | 57.9 | ||
| Liberal Democrat | Elizabeth Simpson | 11,545 | 22.5 | ||
| Labour | Daniel Griffiths | 6,476 | 12.6 | ||
| UKIP | David Waller | 1,911 | 3.7 | ||
| Green | Steve Dawe | 764 | 1.5 | N/A | |
| National Front | Michael Easter | 505 | 1.0 | N/A | |
| English Democrat | Lisa Rogers | 390 | 0.8 | N/A | |
| Majority | 18,178 | 35.4 | |||
| Turnout | 51,314 | 71.5 | |||
| Conservative hold | Swing | ||||
Elections in the 2000s
| Party | Candidate | Votes | % | ± | |
|---|---|---|---|---|---|
| Conservative | John Stanley | 24,357 | 52.9 | +3.5 | |
| Labour | Victoria Hayman | 11,005 | 23.9 | −6.0 | |
| Liberal Democrat | John Barstow | 8,980 | 19.5 | +1.6 | |
| UKIP | Dave Waller | 1,721 | 3.7 | +0.9 | |
| Majority | 13,352 | 29.0 | |||
| Turnout | 46,063 | 67.3 | +3.0 | ||
| Conservative hold | Swing | ||||
| Party | Candidate | Votes | % | ± | |
|---|---|---|---|---|---|
| Conservative | John Stanley | 20,956 | 49.4 | +1.4 | |
| Labour | Victoria Hayman | 12,706 | 29.9 | +2.7 | |
| Liberal Democrat | Jean Canet | 7,605 | 17.9 | −1.3 | |
| UKIP | Lynne Croucher | 1,169 | 2.8 | +1.7 | |
| Majority | 8,250 | 19.5 | |||
| Turnout | 42,436 | 64.3 | −11.4 | ||
| Conservative hold | Swing | ||||
Elections in the 1990s
| Party | Candidate | Votes | % | ± | |
|---|---|---|---|---|---|
| Conservative | John Stanley | 23,640 | 48.0 | −9.2 | |
| Labour | Barbara Withstandley | 13,410 | 27.2 | +9.1 | |
| Liberal Democrat | Keith Brown | 9,467 | 19.2 | −4.3 | |
| Referendum | John Scrivenor | 2,005 | 4.1 | N/A | |
| UKIP | B. Bullen | 502 | 1.0 | N/A | |
| Natural Law | Gerard Valente | 205 | 0.4 | +0.1 | |
| Majority | 10,230 | 20.8 | |||
| Turnout | 49,229 | 75.8 | |||
| Conservative hold | Swing | ||||
| Party | Candidate | Votes | % | ± | |
|---|---|---|---|---|---|
| Conservative | John Stanley | 36,542 | 57.2 | +0.3 | |
| Liberal Democrat | Paul D. Roberts | 14,984 | 23.5 | −6.0 | |
| Labour | Margaret A. O'Neill | 11,533 | 18.1 | +5.0 | |
| Green | Jim Tidy | 612 | 1.0 | N/A | |
| Natural Law | Janet I.R. Horvath | 221 | 0.3 | N/A | |
| Majority | 21,558 | 33.7 | +6.2 | ||
| Turnout | 63,892 | 82.7 | +4.9 | ||
| Conservative hold | Swing | ||||
Elections in the 1980s
| Party | Candidate | Votes | % | ± | |
|---|---|---|---|---|---|
| Conservative | John Stanley | 33,990 | 56.9 | +0.8 | |
| Social Democratic | Michael Ward | 17,561 | 29.4 | −1.8 | |
| Labour | Derek Still | 7,803 | 13.1 | +0.4 | |
| BNP | Michael Easter | 369 | 0.6 | N/A | |
| Majority | 16,429 | 27.5 | |||
| Turnout | 59,725 | 77.8 | |||
| Conservative hold | Swing | ||||
| Party | Candidate | Votes | % | ± | |
|---|---|---|---|---|---|
| Conservative | John Stanley | 30,417 | 56.1 | +1.6 | |
| Social Democratic | R. Freeman | 16,897 | 31.2 | +11.1 | |
| Labour | D.J. Bishop | 6,896 | 12.7 | −11.8 | |
| Majority | 13,520 | 24.9 | |||
| Turnout | 54,210 | 74.7 | −4.8 | ||
| Conservative hold | Swing | ||||
Elections in the 1970s
| Party | Candidate | Votes | % | ± | |
|---|---|---|---|---|---|
| Conservative | John Stanley | 29,534 | 54.5 | +7.7 | |
| Labour | R. Ackerley | 13,282 | 24.5 | −4.9 | |
| Liberal | G. Knopp | 10,904 | 20.1 | −3.7 | |
| National Front | G. Burnett | 429 | 0.8 | N/A | |
| Majority | 16,252 | 30.0 | |||
| Turnout | 54,149 | 79.5 | +4.0 | ||
| Conservative hold | Swing | ||||
| Party | Candidate | Votes | % | ± | |
|---|---|---|---|---|---|
| Conservative | John Stanley | 23,188 | 46.8 | +1.0 | |
| Labour | P. Knight | 14,579 | 29.4 | +2.3 | |
| Liberal | M. Vann | 11,767 | 23.8 | −3.1 | |
| Majority | 8,609 | 17.4 | |||
| Turnout | 49,534 | 75.5 | −7.9 | ||
| Conservative hold | Swing | ||||
| Party | Candidate | Votes | % | ± | |
|---|---|---|---|---|---|
| Conservative | John Stanley | 24,809 | 45.8 | N/A | |
| Liberal | M Vann | 14,701 | 27.1 | N/A | |
| Labour | Jack Straw | 14,683 | 27.1 | N/A | |
| Majority | 10,108 | 18.7 | N/A | ||
| Turnout | 54,193 | 83.4 | N/A | ||
| Conservative win (new seat) | |||||
See also
Notes and references
- Notes
- ↑ A county constituency (for the purposes of election expenses and type of returning officer)
- ↑ As with all constituencies, the constituency elects one Member of Parliament (MP) by the first past the post system of election at least every five years.
- References
- ↑ "Electorate Figures - Boundary Commission for England". 2015 Electorate Figures. Boundary Commission for England. 29 April 2015. Archived from the original on 6 April 2015. Retrieved 8 May 2015.
- ↑ "Neighbourhood Statistics". statistics.gov.uk. Retrieved 13 September 2015.
- ↑ Unemployment claimants by constituency The Guardian
- ↑ Leigh Rayment's Historical List of MPs – Constituencies beginning with "T" (part 2)
- ↑ "Election Data 2015". Electoral Calculus. Archived from the original on 17 October 2015. Retrieved 17 October 2015.
- ↑ "Tom Tugendhat MP". Tom Tugendhat MP. Retrieved 13 September 2015.
- ↑ "UK Polling Report". ukpollingreport.co.uk. Retrieved 13 September 2015.
- ↑ Tonbridge and Malling Labour Party. "@ClaireLeighLab, Labour PPC for Tonbridge Edenbridge & Malling". claireleigh4tonbridge.co.uk. Retrieved 13 September 2015.
- ↑ http://www.libdems.org.uk/general_election_candidates#South East
- ↑ "Election Data 2010". Electoral Calculus. Archived from the original on 26 July 2013. Retrieved 17 October 2015.
- ↑ http://www.tmbc.gov.uk/assets/Elections/WPE/WPE_TM_SoPN.pdf
- ↑ "Election Data 2005". Electoral Calculus. Archived from the original on 15 October 2011. Retrieved 18 October 2015.
- ↑ "Election Data 2001". Electoral Calculus. Archived from the original on 15 October 2011. Retrieved 18 October 2015.
- ↑ "Election Data 1997". Electoral Calculus. Archived from the original on 15 October 2011. Retrieved 18 October 2015.
- ↑ "Election Data 1992". Electoral Calculus. Archived from the original on 15 October 2011. Retrieved 18 October 2015.
- ↑ "Politics Resources". Election 1992. Politics Resources. 9 April 1992. Retrieved 2010-12-06.
- ↑ "Election Data 1987". Electoral Calculus. Archived from the original on 15 October 2011. Retrieved 18 October 2015.
- ↑ "UK General Election results: June 1987 [Archive]". politicsresources.net. Retrieved 13 September 2015.
- ↑ "Election Data 1983". Electoral Calculus. Archived from the original on 15 October 2011. Retrieved 18 October 2015.
- ↑ "UK General Election results: June 1983 [Archive]". politicsresources.net. Retrieved 13 September 2015.
- ↑ "UK General Election results: May 1979 [Archive]". politicsresources.net. Retrieved 13 September 2015.
- ↑ "UK General Election results: October 1974 [Archive]". politicsresources.net. Retrieved 13 September 2015.
- ↑ "UK General Election results: February 1974 [Archive]". politicsresources.net. Retrieved 13 September 2015.