Orkney and Shetland (UK Parliament constituency)
Coordinates: 59°46′30″N 1°48′11″W / 59.775°N 1.803°W
| Orkney and Shetland | |
|---|---|
|
County constituency for the House of Commons | |
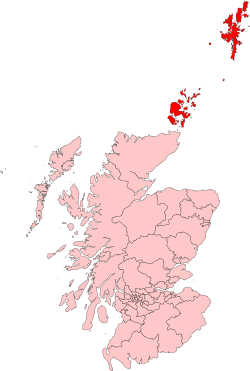 Boundary of Orkney and Shetland in Scotland. | |
| Subdivisions of Scotland | Orkney and Shetland |
| Electorate | 33,229[1] |
| Current constituency | |
| Created | 1708 |
| Member of parliament | Alistair Carmichael (Liberal Democrat) |
| Number of members | One |
| Created from | Orkney and Shetland |
| Overlaps | |
| European Parliament constituency | Scotland |
Orkney and Shetland is a constituency of the House of Commons of the Parliament of the United Kingdom. It elects one Member of Parliament (MP) by the first past the post system of election. In the Scottish Parliament, Orkney and Shetland are separate constituencies. The constituency was historically known as Orkney and Zetland (an alternative name for Shetland).
Boundaries
The constituency is made up of the two island groups, Orkney and Shetland. A constituency of this name has existed continuously since 1708. However, before 1918 the town of Kirkwall (the capital of Orkney) formed part of the Northern Burghs constituency. It is the most northerly of the 650 UK Parliament constituencies.
The constituency is one of three "protected constituencies", the others being Na h-Eileanan an Iar and the Isle of Wight, defining constituency boundaries exclusively by geography rather than by (or partly by) size of electorate.[2] The constituency contains the areas of the Orkney Islands Council and the Shetland Islands Council. Before 2011 the constituency had been unique in having its boundaries protected by legislation.[3]
The constituency has the second smallest electorate of any UK parliamentary constituency, after Na h-Eileanan an Iar.[1]
Members of Parliament
The constituency has elected only Liberal and Liberal Democrat MPs since 1950; the longest run of any British parliamentary constituency.[4][5]At each general election from 1955 until 1979, in 1987, 2010 and again in 2017 it was the safest Liberal Democrat seat in the UK. At the May 2015 general election, it was the only seat in Scotland to return a Liberal Democrat MP. Two years later, in 2017, the Lib Dems gained three more seats in Scotland; increasing their Scottish seat count to 4.
Elections
Elections in the 2010s
| Party | Candidate | Votes | % | ± | |
|---|---|---|---|---|---|
| Liberal Democrats | Alistair Carmichael | 11,312 | 48.6 | + 7.2 | |
| SNP | Miriam Brett | 6,749 | 29.0 | - 8.8 | |
| Labour | Robina Barton | 2,664 | 11.4 | + 4.3 | |
| Conservative | Jamie Halcro Johnston | 2,024 | 8.7 | - 0.2 | |
| UKIP | Robert Smith | 283 | 1.2 | - 3.5 | |
| Independent | Stuart Hill | 245 | 1.1 | N/A | |
| Majority | 4,563 | 19.6 | + 16.0 | ||
| Turnout | 23,277 | 68.1 | + 2.4 | ||
| Liberal Democrats hold | Swing | + 8.0 | |||
| Party | Candidate | Votes | % | ± | |
|---|---|---|---|---|---|
| Liberal Democrats | Alistair Carmichael[15] | 9,407 | 41.4 | - 20.6 | |
| SNP | Danus Skene | 8,590 | 37.8 | + 27.2 | |
| Conservative | Donald Cameron[16] | 2,025 | 8.9 | - 1.6 | |
| Labour | Gerry McGarvey | 1,624 | 7.1 | - 3.5 | |
| UKIP | Robert Smith[17] | 1,082 | 4.8 | -1.6 | |
| Majority | 817 | 3.6 | - 47.7 | ||
| Turnout | 22,728 | 65.8 | + 7.3 | ||
| Liberal Democrats hold | Swing | - 23.9 | |||
| Party | Candidate | Votes | % | ± | |
|---|---|---|---|---|---|
| Liberal Democrats | Alistair Carmichael | 11,989 | 62.0 | + 10.5 | |
| Labour | Mark Cooper | 2,061 | 10.7 | - 3.5 | |
| SNP | John Mowat | 2,042 | 10.6 | + 0.3 | |
| Conservative | Frank Nairn | 2,032 | 10.5 | - 2.8 | |
| UKIP | Robert Smith | 1,222 | 6.3 | + 3.9 | |
| Majority | 9,928 | 51.3 | + 13.9 | ||
| Turnout | 19,346 | 58.5 | + 4.1 | ||
| Liberal Democrats hold | Swing | + 7.0 | |||
Elections in the 2000s
| Party | Candidate | Votes | % | ± | |
|---|---|---|---|---|---|
| Liberal Democrats | Alistair Carmichael | 9,138 | 51.5 | + 10.1 | |
| Labour | Richard Meade | 2,511 | 14.2 | - 6.4 | |
| Conservative | Frank Nairn | 2,357 | 13.3 | - 5.4 | |
| SNP | John Mowat | 1,833 | 10.3 | - 4.5 | |
| Scottish Socialist | John Aberdein | 992 | 5.6 | + 1 | |
| UKIP | Scott Dyble | 424 | 2.4 | + 2.4 | |
| Legalise Cannabis | Paul Cruickshank | 311 | 1.8 | + 1.8 | |
| Free Scotland | Brian Nugent | 176 | 1.0 | + 1 | |
| Majority | 6,627 | 37.4 | + 16.7 | ||
| Turnout | 17,742 | 53.7 | + 1.7 | ||
| Liberal Democrats hold | Swing | + 8.3 | |||
| Party | Candidate | Votes | % | ± | |
|---|---|---|---|---|---|
| Liberal Democrats | Alistair Carmichael | 6,919 | 41.3 | - 10.6 | |
| Labour | Robert Mochrie | 3,444 | 20.6 | + 2.3 | |
| Conservative | John Firth | 3,121 | 18.7 | + 6.4 | |
| SNP | John Mowat | 2,473 | 14.8 | + 2.1 | |
| Scottish Socialist | Peter Andrews | 776 | 4.6 | + 4.6 | |
| Majority | 3,475 | 20.7 | - 13.0 | ||
| Turnout | 16,733 | 52.4 | - 11.5 | ||
| Liberal Democrats hold | Swing | - 13.0 | |||
Elections in the 1990s
| Party | Candidate | Votes | % | ± | |
|---|---|---|---|---|---|
| Liberal Democrats | Jim Wallace | 10,743 | 52.0 | + 5.6 | |
| Labour | James Paton | 3,775 | 18.3 | - 1.5 | |
| SNP | Willie Ross | 2,624 | 12.7 | + 1.5 | |
| Conservative | Hope Anderson | 2,527 | 12.2 | - 9.8 | |
| Referendum | Francis Adamson | 820 | 4.0 | + 4 | |
| Natural Law | Christian Wharton | 116 | 0.6 | - | |
| Independent | Arthur Robertson | 60 | 0.3 | + 0.3 | |
| Majority | 6,968 | 33.7 | + 10.3 | ||
| Turnout | 64.0 | - 1.5 | |||
| Liberal Democrats hold | Swing | + 3.6 | |||
| Party | Candidate | Votes | % | ± | |
|---|---|---|---|---|---|
| Liberal Democrats | Jim Wallace | 9,575 | 46.4 | + 4.7 | |
| Conservative | Paul McCormick | 4,542 | 22.0 | - 1.3 | |
| Labour | John Aberdein | 4,093 | 19.8 | + 1.1 | |
| SNP | Frances McKie | 2,301 | 11.2 | + 11.2 | |
| Natural Law | Christian Wharton | 115 | 0.6 | + 0.6 | |
| Majority | 5,033 | 24.4 | + 6.0 | ||
| Turnout | 20,626 | 65.5 | - 3.2 | ||
| Liberal Democrats hold | Swing | + 3.0 | |||
Elections in the 1980s
| Party | Candidate | Votes | % | ± | |
|---|---|---|---|---|---|
| Liberal | Jim Wallace | 8,881 | 41.7 | - 4.2 | |
| Conservative | Richard Jenkins | 4,959 | 23.3 | - 2.3 | |
| Labour | John Aberdein | 3,995 | 18.7 | + 5.4 | |
| Orkney and Shetland Movement | John Goodlad | 3,095 | 14.5 | + 14.5 | |
| Green | Grierson Collister | 389 | 1.8 | + 1.8 | |
| Majority | 3,922 | 18.4 | |||
| Turnout | 68.7 | ||||
| Liberal hold | Swing | ||||
| Party | Candidate | Votes | % | ± | |
|---|---|---|---|---|---|
| Liberal | Jim Wallace | 9,374 | 45.9 | - 10.5 | |
| Conservative | David Myles | 5,224 | 25.6 | + 4.3 | |
| SNP | Winifred Ewing | 3,147 | 15.4 | + 10.6 | |
| Labour | Robina Goodlad | 2,665 | 13.1 | - 4.3 | |
| Majority | 4,150 | 20.3 | |||
| Turnout | 67.8 | ||||
| Liberal hold | Swing | ||||
Elections in the 1970s
| Party | Candidate | Votes | % | ± | |
|---|---|---|---|---|---|
| Liberal | Jo Grimond | 10,950 | 56.4 | + 0.2 | |
| Conservative | C. Donaldson | 4,140 | 21.3 | + 7.1 | |
| Labour | Robina Goodlad | 3,385 | 17.4 | + 5.4 | |
| SNP | M. Spens | 935 | 4.8 | - 12.4 | |
| Majority | 6,810 | 35.1 | |||
| Turnout | 67.2 | ||||
| Liberal hold | Swing | ||||
| Party | Candidate | Votes | % | ± | |
|---|---|---|---|---|---|
| Liberal | Jo Grimond | 9,877 | 56.2 | - 5.8 | |
| SNP | Howard Firth | 3,025 | 17.2 | + 17.2 | |
| Conservative | Raymond M. Fraser | 2,495 | 14.2 | - 8.4 | |
| Labour | Jonathan W. G. Wills | 2,175 | 12.4 | - 3.1 | |
| Majority | 6,852 | 39.0 | |||
| Turnout | 66.8 | ||||
| Liberal hold | Swing | ||||
| Party | Candidate | Votes | % | ± | |
|---|---|---|---|---|---|
| Liberal | Jo Grimond | 11,491 | 62.0 | + 15.0 | |
| Conservative | John L. Firth | 4,186 | 22.6 | - 9.6 | |
| Labour | Jonathan W. G. Wills | 2,865 | 15.5 | - 6.1 | |
| Majority | 7,305 | 39.4 | |||
| Turnout | 71.1 | ||||
| Liberal hold | Swing | ||||
| Party | Candidate | Votes | % | ± | |
|---|---|---|---|---|---|
| Liberal | Jo Grimond | 7,896 | 47.0 | - 12.1 | |
| Conservative | John L. Firth | 5,364 | 31.9 | + 9.6 | |
| Labour | William Macpherson Reid | 3,552 | 21.1 | + 2.5 | |
| Majority | 2,532 | 15.1 | |||
| Turnout | 65.6 | ||||
| Liberal hold | Swing | ||||
Elections in the 1960s
| Party | Candidate | Votes | % | ± | |
|---|---|---|---|---|---|
| Liberal | Jo Grimond | 9,605 | 59.1 | - 3.5 | |
| Unionist | John L. Firth | 3,630 | 22.3 | + 2.3 | |
| Labour | Hugh Lynch | 3,021 | 18.6 | + 1.2 | |
| Majority | 5,975 | 36.8 | |||
| Turnout | 16,256 | 65.2 | |||
| Liberal hold | Swing | ||||
| Party | Candidate | Votes | % | ± | |
|---|---|---|---|---|---|
| Liberal | Jo Grimond | 11,604 | 62.6 | -1.5 | |
| Unionist | John L. Firth | 3,704 | 20.0 | + 1.5 | |
| Labour | Ian MacInnes | 3,232 | 17.4 | - | |
| Majority | 7,900 | 42.6 | |||
| Turnout | 18,540 | 72.7 | |||
| Liberal hold | Swing | ||||
Elections in the 1950s
| Party | Candidate | Votes | % | ± | |
|---|---|---|---|---|---|
| Liberal | Jo Grimond | 12,099 | 64.1 | + 0.3 | |
| Unionist | Robert Hunter Wingate Bruce | 3,487 | 18.5 | - 1.9 | |
| Labour | Robert S. McGowan | 3,275 | 17.4 | + 1.6 | |
| Majority | 8,612 | 45.7 | |||
| Turnout | 18,861 | 71.3 | |||
| Liberal hold | Swing | ||||
| Party | Candidate | Votes | % | ± | |
|---|---|---|---|---|---|
| Liberal | Jo Grimond | 11,753 | 63.8 | + 6.3 | |
| Unionist | John W. Eunson | 3,760 | 20.4 | - 6.2 | |
| Labour | Edgar Ramsay | 2,914 | 15.8 | - 0.4 | |
| Majority | 7,993 | 43.4 | |||
| Turnout | 18,427 | 66.1 | |||
| Liberal hold | Swing | ||||
| Party | Candidate | Votes | % | ± | |
|---|---|---|---|---|---|
| Liberal | Jo Grimond | 11,745 | 57.5 | + 11.3 | |
| Unionist | Archibald Tennant | 5,354 | 26.2 | - 5.7 | |
| Labour | Magnus A. Fairnie | 3,335 | 16.2 | - 3.1 | |
| Majority | 6,391 | 31.3 | |||
| Turnout | 20,434 | 69.0 | |||
| Liberal hold | Swing | ||||
| Party | Candidate | Votes | % | ± | |
|---|---|---|---|---|---|
| Liberal | Jo Grimond | 9,237 | 46.8 | + 12.6 | |
| Unionist | Basil Neven-Spence | 6,281 | 31.9 | - 4.1 | |
| Labour | Harald Leslie | 3,335 | 21.3 | - 8.5 | |
| Majority | 2,956 | 15.0 | |||
| Turnout | 19,716 | 67.7 | |||
| Liberal gain from Unionist | Swing | ||||
Elections in the 1940s
| Party | Candidate | Votes | % | ± | |
|---|---|---|---|---|---|
| Unionist | Basil Neven-Spence | 6,304 | 36.0 | - 21.6 | |
| Liberal | Jo Grimond | 5,975 | 34.2 | - 8.2 | |
| Labour | Prophet Smith | 5,208 | 29.8 | + 29.8 | |
| Majority | 329 | 1.8 | - 13.4 | ||
| Turnout | 17,487 | 55.5 | + 9.2 | ||
| Unionist hold | Swing | ||||
Elections in the 1930s
General election 1939/40: Another general election was required to take place before the end of 1940. The political parties had been making preparations for an election to take place and by the Autumn of 1939, the following candidates had been selected;
- Conservative: Basil Neven-Spence
- Liberal: Louise Glen-Coats
| Party | Candidate | Votes | % | ± | |
|---|---|---|---|---|---|
| Unionist | Basil Neven-Spence | 8,406 | 57.6 | n/a | |
| Liberal | Robert Hamilton | 6,180 | 42.4 | n/a | |
| Majority | 2,226 | 15.2 | n/a | ||
| Turnout | 1,586 | 46.3 | n/a | ||
| Unionist gain from Liberal | Swing | n/a | |||
| Party | Candidate | Votes | % | ± | |
|---|---|---|---|---|---|
| Liberal | Robert Hamilton | Unopposed | N/A | N/A | |
| Liberal hold | Swing | N/A | |||
Elections in the 1920s
| Party | Candidate | Votes | % | ± | |
|---|---|---|---|---|---|
| Liberal | Robert Hamilton | 8,256 | 60.4 | n/a | |
| Unionist | Basil Neven-Spence | 5,404 | 39.6 | n/a | |
| Majority | 2,852 | 20.6 | n/a | ||
| Turnout | 13,660 | 43.1 | n/a | ||
| Liberal hold | Swing | n/a | |||
| Party | Candidate | Votes | % | ± | |
|---|---|---|---|---|---|
| Liberal | Robert Hamilton | Unopposed | N/A | N/A | |
| Liberal hold | Swing | N/A | |||
| Party | Candidate | Votes | % | ± | |
|---|---|---|---|---|---|
| Liberal | Robert Hamilton | 5,129 | 54.3 | + 0.8 | |
| Unionist | Robert Boothby | 4,318 | 45.7 | + 45.7 | |
| Majority | 811 | 8.6 | + 1.6 | ||
| Turnout | 9,447 | 39.1 | + 1.7 | ||
| Liberal hold | Swing | ||||

| Party | Candidate | Votes | % | ± | |
|---|---|---|---|---|---|
| Liberal | Robert Hamilton | 4,814 | 53.5 | n/a | |
| National Liberal | Malcolm Smith | 4,189 | 46.5 | n/a | |
| Majority | 625 | 7.0 | n/a | ||
| Turnout | 9,003 | 37.4 | n/a | ||
| Liberal gain from National Liberal | Swing | n/a | |||
| Party | Candidate | Votes | % | ± | |
|---|---|---|---|---|---|
| C | Liberal | Malcolm Smith | Unopposed | ||
| Liberal hold | |||||
| C indicates candidate endorsed by the coalition government. | |||||
Elections in the 1910s
| Party | Candidate | Votes | % | ± | |
|---|---|---|---|---|---|
| C | Liberal | Cathcart Wason | Unopposed | ||
| Liberal hold | |||||
| C indicates candidate endorsed by the coalition government. | |||||
| Party | Candidate | Votes | % | ± | |
|---|---|---|---|---|---|
| Liberal | Cathcart Wason | Unopposed | |||
| Liberal hold | |||||

| Party | Candidate | Votes | % | ± | |
|---|---|---|---|---|---|
| Liberal | Cathcart Wason | 4,117 | 80.6 | + 1.6 | |
| Liberal Unionist | Thomas William Hemsley | 994 | 19.4 | - 1.6 | |
| Majority | 3,123 | 61.2 | + 3.2 | ||
| Turnout | 5,111 | 71.8 | + 8.5 | ||
| Liberal hold | Swing | ||||
Elections in the 1900s
| Party | Candidate | Votes | % | ± | |
|---|---|---|---|---|---|
| Liberal | Cathcart Wason | 3,837 | 79.0 | + 29.5 | |
| Conservative | C. J. Dunlop | 1,021 | 21.0 | - 29.5 | |
| Majority | 2,816 | 58.0 | |||
| Turnout | 4,858 | 63.3 | + 8.4 | ||
| Registered electors | 7,680 | ||||
| Liberal gain from Liberal Unionist | Swing | + 29.5 | |||
| Party | Candidate | Votes | % | ± | |
|---|---|---|---|---|---|
| Independent Liberal | Cathcart Wason | 2,412 | 46.8 | + 46.8 | |
| Liberal | McKinnon Wood | 2,001 | 38.8 | - 10.7 | |
| Liberal Unionist | Theodore Vivian Samuel Angier | 740 | 14.4 | - 36.1 | |
| Majority | 411 | 8.0 | |||
| Turnout | 5,153 | 68.1 | + 13.2 | ||
| Registered electors | 7,572 | ||||
| Independent Liberal gain from Liberal Unionist | Swing | ||||
| Party | Candidate | Votes | % | ± | |
|---|---|---|---|---|---|
| Liberal Unionist | Cathcart Wason | 2,057 | 50.5 | + 10.4 | |
| Liberal | Leonard Lyell | 2,017 | 49.5 | - 10.4 | |
| Majority | 40 | 1.0 | |||
| Turnout | 4,074 | 54.9 | - 1.0 | ||
| Registered electors | 7,420 | ||||
| Liberal Unionist gain from Liberal | Swing | + 10.4 | |||
Elections in the 1890s
| Party | Candidate | Votes | % | ± | |
|---|---|---|---|---|---|
| Liberal | Leonard Lyell | 2,361 | 59.9 | - 2.0 | |
| Liberal Unionist | Ralph Wardlaw MacLeod Fullarton | 1,580 | 40.1 | + 2.0 | |
| Majority | 781 | 19.8 | - 4.0 | ||
| Turnout | 3,941 | 55.9 | - 4.0 | ||
| Registered electors | 7,053 | ||||
| Liberal hold | Swing | - 2.0 | |||
| Party | Candidate | Votes | % | ± | |
|---|---|---|---|---|---|
| Liberal | Leonard Lyell | 2,624 | 61.9 | - 1.1 | |
| Liberal Unionist | William Younger | 1,617 | 38.1 | + 1.1 | |
| Majority | 1,007 | 23.8 | - 2.2 | ||
| Turnout | 4,241 | 59.9 | + 9.4 | ||
| Registered electors | 7,075 | ||||
| Liberal hold | Swing | - 1.1 | |||
Elections in the 1880s
| Party | Candidate | Votes | % | ± | |
|---|---|---|---|---|---|
| Liberal | Leonard Lyell | 2,353 | 63.0 | - 0.3 | |
| Liberal Unionist | Henry Hoare[31] | 1,382 | 37.0 | + 0.3 | |
| Majority | 971 | 26.0 | - 0.6 | ||
| Turnout | 3,735 | 50.5 | - 21.1 | ||
| Registered electors | 7,394 | ||||
| Liberal hold | Swing | - 0.3 | |||
| Party | Candidate | Votes | % | ± | |
|---|---|---|---|---|---|
| Liberal | Leonard Lyell | 3,352 | 63.3 | + 2.5 | |
| Conservative | Cospatrick Thomas Dundas [32] | 1,940 | 36.7 | - 2.5 | |
| Majority | 1,412 | 26.6 | + 5.0 | ||
| Turnout | 5,292 | 71.6 | - 14.9 | ||
| Registered electors | 7,394 | ||||
| Liberal hold | Swing | + 2.5 | |||
| Party | Candidate | Votes | % | ± | |
|---|---|---|---|---|---|
| Liberal | Samuel Laing | 896 | 60.8 | N/A | |
| Conservative | George Roy Badenoch[34] | 578 | 39.2 | N/A | |
| Majority | 318 | 21.6 | N/A | ||
| Turnout | 1,474 | 86.5 | N/A | ||
| Registered electors | 1,704 | ||||
| Liberal hold | Swing | N/A | |||
Elections in the 1870s
| Party | Candidate | Votes | % | ± | |
|---|---|---|---|---|---|
| Liberal | Samuel Laing | Unopposed | |||
| Registered electors | 1,618 | ||||
| Liberal hold | |||||
| Party | Candidate | Votes | % | ± | |
|---|---|---|---|---|---|
| Liberal | Samuel Laing | 646 | 51.0 | N/A | |
| Liberal | Peter Tait[35] | 621 | 49.0 | N/A | |
| Majority | 25 | 2.0 | −21.2 | ||
| Turnout | 1,267 | 82.4 | +4.3 | ||
| Registered electors | 1,537 | ||||
| Liberal hold | Swing | N/A | |||
- Caused by Dundas' death.
Elections in the 1860s
| Party | Candidate | Votes | % | ± | |
|---|---|---|---|---|---|
| Liberal | Frederick Dundas | 715 | 61.6 | N/A | |
| Conservative | Henry Riddell[36][37] | 446 | 38.4 | N/A | |
| Majority | 269 | 23.2 | N/A | ||
| Turnout | 1,161 | 78.1 | N/A | ||
| Registered electors | 1,486 | ||||
| Liberal hold | Swing | N/A | |||
| Party | Candidate | Votes | % | ± | |
|---|---|---|---|---|---|
| Liberal | Frederick Dundas | Unopposed | |||
| Registered electors | 685 | ||||
| Liberal hold | |||||
Elections in the 1850s
| Party | Candidate | Votes | % | ± | |
|---|---|---|---|---|---|
| Liberal | Frederick Dundas | Unopposed | |||
| Registered electors | 621 | ||||
| Liberal hold | |||||
| Party | Candidate | Votes | % | ± | |
|---|---|---|---|---|---|
| Whig | Frederick Dundas | Unopposed | |||
| Registered electors | 615 | ||||
| Whig hold | |||||
| Party | Candidate | Votes | % | ± | |
|---|---|---|---|---|---|
| Whig | Frederick Dundas | 227 | 53.9 | ||
| Conservative | John Inglis[38] | 194 | 46.1 | ||
| Majority | 33 | 7.8 | |||
| Turnout | 421 | 64.7 | |||
| Registered electors | 651 | ||||
| Whig hold | Swing | ||||
Elections in the 1840s
| Party | Candidate | Votes | % | ± | |
|---|---|---|---|---|---|
| Liberal | Arthur Anderson | 209 | |||
| Liberal | Frederick Dundas | 183 | |||
| Majority | 26 | ||||
| Turnout | 392 | ||||
| Liberal hold | Swing | ||||
Elections in the 1830s
| Party | Candidate | Votes | % | ± | |
|---|---|---|---|---|---|
| Tory | Thomas Balfour | 114 | |||
| Whig | George Traill | 84 | |||
| Majority | 30 | ||||
| Turnout | 198 | ||||
| Tory gain from Whig | Swing | ||||
| Party | Candidate | Votes | % | ± | |
|---|---|---|---|---|---|
| Whig | George Traill | 107 | |||
| Tory | S. Laing | 96 | |||
| Whig | R. Hunter | 9 | |||
| Majority | 11 | ||||
| Turnout | 212 | ||||
| Whig hold | Swing | ||||
Notes
- 1 2 Office for National Statistics (24 February 2016). "Parliamentary Electors by Parliamentary Constituencies 2010–2015". Retrieved 17 February 2017.
- ↑ Protected constituencies, s 11, schedule 2, Parliamentary Voting System and Constituencies Act 2011. The constituencies are protected from splitting or merging in future boundary reviews. The two Isle of Wight constituencies have not yet been formed.
- ↑ Rule 3A of the Boundary Commission rules stated "A constituency which includes the Orkney Islands or the Shetland Islands shall not include the whole or any part of a local government area other than the Orkney Islands and the Shetland Islands." Boundary Commission Rules Archived 2014-09-24 at the Wayback Machine. This rule was added in the Parliamentary Constituencies Act 1986 and retained in the Scotland Act 1998, which established the Scottish Parliament.
- ↑ "Candidates and Constituency Assessments" Archived January 18, 2012, at the Wayback Machine.. alba.org.uk - "The almanac of Scottish elections and politics". Retrieved 9 February 2010.
- ↑ "The Untouchable Orkney & Shetland Isles " Archived 2 June 2013 at the Wayback Machine. (1 October 2009) www.snptacticalvoting.com Retrieved 9 February 2010.
- 1 2 3 4 5 Smith, Henry Stooks (1842). The Register of Parliamentary Contested Elections (Second ed.). Simpkin, Marshall & Company. pp. 207–208. Retrieved 14 September 2018 – via Google Books.
- 1 2 Churton, Edward (1838). The Assembled Commons or Parliamentary Biographer: 1838. p. 77. Retrieved 14 September 2018 – via Google Books.
- 1 2 "Orkney". Fife Herald. 3 August 1837. pp. 1–2. Retrieved 14 September 2018 – via British Newspaper Archive. (Subscription required (help)).
- ↑ "Forthcoming Elections". Morning Post. 27 July 1847. p. 2. Retrieved 14 September 2018 – via British Newspaper Archive. (Subscription required (help)).
- ↑ "Election 2017: Carmichael to stand for re-election". BBC. Retrieved 24 April 2017.
- ↑ "shetnews: Barton for Labour". shetnews. Retrieved 29 April 2017.
- ↑ "shetnews: Hill to Stand for Parliament". shetnews. Retrieved 7 May 2017.
- ↑ "Election Data 2015". Electoral Calculus. Archived from the original on 17 October 2015. Retrieved 17 October 2015.
- ↑ http://www.shetland.gov.uk/elections/documents/DeclarationofResults-OrkneyandShetland.pdf
- ↑ "Alistair Carmichael reselected for Orkney and Shetland". Liberal Democrat Voice.
- ↑ "Conservative candidate named". The Shetland Times.
- ↑ "UKIP to field Robert Smith again". Shetland News.
- ↑ "Election Data 2010". Electoral Calculus. Archived from the original on 26 July 2013. Retrieved 17 October 2015.
- ↑ "Press Association Elections". pressassociation.com.
- ↑ "BBC News — Election 2010 - Constituency - Orkney & Shetland". bbc.co.uk.
- ↑ "Election Data 2005". Electoral Calculus. Archived from the original on 15 October 2011. Retrieved 18 October 2015.
- ↑ "Election Data 2001". Electoral Calculus. Archived from the original on 15 October 2011. Retrieved 18 October 2015.
- ↑ "Election Data 1997". Electoral Calculus. Archived from the original on 15 October 2011. Retrieved 18 October 2015.
- ↑ "Politics Resources". Election 1997. Politics Resources. 1 May 1997. Retrieved 2010-12-25.
- ↑ C. Rallings & M. Thrasher, The Media Guide to the New Parliamentary Constituencies, p.130 (Plymouth: LGC Elections Centre, 1995)
- ↑ "Election Data 1992". Electoral Calculus. Archived from the original on 15 October 2011. Retrieved 18 October 2015.
- ↑ "Politics Resources". Election 1992. Politics Resources. 9 April 1992. Retrieved 2010-12-06.
- ↑ "Election Data 1987". Electoral Calculus. Archived from the original on 15 October 2011. Retrieved 18 October 2015.
- ↑ "Election Data 1983". Electoral Calculus. Archived from the original on 15 October 2011. Retrieved 18 October 2015.
- 1 2 3 4 5 6 7 Craig, FWS, ed. (1974). British Parliamentary Election Results: 1885-1918. London: Macmillan Press. ISBN 9781349022984.
- ↑ "Orkney and Shetland Election". Hampshire Advertiser. 28 July 1886. p. 4. Retrieved 6 December 2017 – via British Newspaper Archive. (Subscription required (help)).
- ↑ "Every Man's Duty". The Shetland Times. 5 December 1885. p. 2. Retrieved 6 December 2017 – via British Newspaper Archive. (Subscription required (help)).
- 1 2 3 4 5 6 7 8 Craig, F. W. S., ed. (1977). British Parliamentary Election Results 1832-1885 (e-book)
|format=requires|url=(help) (1st ed.). London: Macmillan Press. ISBN 978-1-349-02349-3. - ↑ "Candidate". The Shetland Times. 24 April 1880. p. 3. Retrieved 6 December 2017 – via British Newspaper Archive. (Subscription required (help)).
- ↑ "Orkney and Shetland Election". The Shetland Times. 16 December 1872. p. 4. Retrieved 14 January 2018 – via British Newspaper Archive. (Subscription required (help)).
- ↑ "The County Contest". Orkney Herald. 10 November 1868. p. 2. Retrieved 14 March 2018 – via British Newspaper Archive. (Subscription required (help)).
- ↑ "Orkney and Shetland". London Evening Standard. 12 November 1868. pp. 4–5. Retrieved 14 March 2018 – via British Newspaper Archive. (Subscription required (help)).
- ↑ "Orkney and Shetland Election". John o'Groat Journal. 23 July 1852. pp. 1–2. Retrieved 14 September 2018 – via British Newspaper Archive. (Subscription required (help)).
Further reading
- F. W. S. Craig, British Parliamentary Election Results 1918 – 1949
- F. W. S. Craig, British Parliamentary Election Results 1885 – 1918
- F. W. S. Craig, British Parliamentary Election Results 1832 – 1885
External links
- Leigh Rayment's Historical List of MPs – Constituencies beginning with "O"
- BBC Vote 2001
- BBC Election 2005
- Guardian Unlimited Politics
- UK general elections since 1832
- http://www.psr.keele.ac.uk/ (Election results from 1950 to the present)