Buckingham (UK Parliament constituency)
Coordinates: 52°00′00″N 0°59′17″W / 52.000°N 0.988°W
| Buckingham | |
|---|---|
|
County constituency for the House of Commons | |
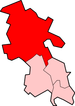
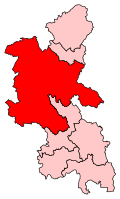 Boundary of Buckingham in Buckinghamshire. | |
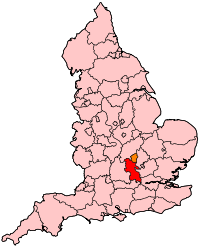 Location of Buckinghamshire within England. | |
| County | Buckinghamshire |
| Population | 97,184 (2011 census)[1] |
| Electorate | 75,837 (December 2010)[2] |
| Major settlements | Princes Risborough, Buckingham, Winslow |
| Current constituency | |
| Created | 1885 |
| Member of parliament | John Bercow (Speaker) |
| Number of members | One |
| 1542–1885 | |
| Number of members | Two until 1868, then one until 1885 |
| Type of constituency | Borough constituency |
| Overlaps | |
| European Parliament constituency | South East England |
Buckingham /ˈbʌkɪŋm̩/ is a constituency[n 1] represented in the House of Commons of the UK Parliament since 1997 by former Conservative MP John Bercow, who later became Speaker of the House of Commons.[n 2]
Boundaries
1885–1918: The Municipal Borough of Buckingham, the Sessional Divisions of Ashendon, Buckingham, Newport, and Stony Stratford, and part of the Sessional Division of Winslow.
1918–1950: The Municipal Borough of Buckingham, the Urban Districts of Bletchley, Linslade, and Newport Pagnell, the Rural Districts of Buckingham, Newport Pagnell, Stratford and Wolverton, Wing, and Winslow, and parts of the Rural Districts of Aylesbury and Long Crendon.
1950–1974: The Municipal Borough of Buckingham, the Urban Districts of Bletchley, Linslade, Newport Pagnell, and Wolverton, and the Rural Districts of Buckingham, Newport Pagnell, Wing, and Winslow.
1974–1983: The Municipal Borough of Buckingham, the Urban Districts of Bletchley, Newport Pagnell, and Wolverton, and the Rural Districts of Buckingham, Newport Pagnell, Wing, and Winslow.
1983–1992: The District of Aylesbury Vale wards of Bierton, Brill, Buckingham North, Buckingham South, Cheddington, Eddlesborough, Great Brickhill, Great Horwood, Grendon Underwood, Haddenham, Hogshaw, Long Crendon, Luffield Abbey, Marsh Gibbon, Newton Longville, Oakley, Pitstone, Quainton, Steeple Claydon, Stewkley, Stone, Tingewick, Waddesdon, Wing, Wingrave, and Winslow, and the Borough of Milton Keynes wards of Stony Stratford, Wolverton, and Wolverton Stacey Bushes.
1992–1997: The District of Aylesbury Vale wards of Bierton, Brill, Buckingham North, Buckingham South, Cheddington, Eddlesborough, Great Brickhill, Great Horwood, Grendon Underwood, Haddenham, Hogshaw, Long Crendon, Luffield Abbey, Marsh Gibbon, Newton Longville, Oakley, Pitstone, Quainton, Steeple Claydon, Stewkley, Stone, Tingewick, Waddesdon, Wing, Wingrave, and Winslow.
1997–2010: The District of Aylesbury Vale wards of Aston Clinton, Bierton, Brill, Buckingham North, Buckingham South, Cheddington, Eddlesborough, Great Brickhill, Great Horwood, Grendon Underwood, Haddenham, Hogshaw, Long Crendon, Luffield Abbey, Marsh Gibbon, Newton Longville, Oakley, Pitstone, Quainton, Steeple Claydon, Stewkley, Stone, Tingewick, Waddesdon, Wing, Wingrave, and Winslow.
2010–present: The District of Aylesbury Vale wards of Buckingham North, Buckingham South, Edlesborough, Gatehouse, Great Brickhill & Newton Longville, Great Horwood, Grendon Underwood & Brill, Haddenham & Stone, Long Crendon, Luffield Abbey, Marsh Gibbon, Oakfield & Bierton, Oakley, Pitstone & Cheddington, Quainton, Steeple Claydon, Stewkley, Tingewick, Waddesdon, Watermead, Weedon, Wing, Wingrave, and Winslow, and the District of Wycombe wards of Icknield and The Risboroughs.
The constituency takes up a large part of central Buckinghamshire, covering much of the Aylesbury Vale district including the town of Buckingham, and south of it, parts of Wycombe, which includes Chequers, the official country residence of the Prime Minister since 1921.[3][4] To the north, the remaining part of ceremonial Buckinghamshire forms two Borough of Milton Keynes constituencies (Milton Keynes South and Milton Keynes North).
History
The seat has sent MPs since 1542 — its standard double representation was halved in 1868. In the twentieth century, the constituency was held by the Conservative Party for most of the time. However, a Labour Party MP served Buckingham from 1945 until 1951, Aidan Crawley and from 1964 until 1970 its Labour MP was the controversial publisher Robert Maxwell.
Before the periodic review effected in 1983, the new town of Milton Keynes, including its older parts such as Bletchley and Fenny Stratford[n 3] was in the constituency. The review followed the previous national review in 1974 and recognised the large increase in electorate in the seat. The sitting Buckingham MP William Benyon stood for the then-created Milton Keynes constituency where he was elected. The residual seat was won in 1983 by Conservative George Walden. Walden retired in 1997, and John Bercow won the following general elections in 2001, 2005, 2010, 2015 and 2017. In 2009, Bercow was elected as Speaker of the House of Commons following the resignation of Michael Martin and there is an inconsistently followed convention not to oppose a professed speaker candidate at election which is mostly kept by the major parties — nonetheless UKIP's leader stood against Bercow in the 2010 election but finished third behind the Buckinghamshire Campaign for Democracy founder who previously founded the Pro-Euro Conservative Party.[5]
At the 2005 general election, this constituency had the Conservatives' highest numerical majority, although a higher share of the vote was achieved in Kensington and Chelsea in London and Richmond in North Yorkshire, the constituency of William Hague.
Members of Parliament
- Constituency created (1542)
MPs to 1660
| Year | First member | Second member |
|---|---|---|
| Apr 1640 | Sir Peter Temple | Sir Alexander Denton |
| Nov 1640 | Sir Peter Temple | Sir Alexander Denton disabled 1644 |
| 1645 | Sir Peter Temple | John Dormer |
| 1653 | Buckingham not Represented in Barebones Parliament | |
| 1654 | Francis Ingoldsby | (one seat only) |
| 1656 | Francis Ingoldsby | (one seat only) |
| 1659 | Francis Ingoldsby | Sir Richard Temple, 3rd Baronet |
MPs 1660–1868
MPs since 1868
Elections
Elections in the 2010s
| Party | Candidate | Votes | % | ± | |
|---|---|---|---|---|---|
| Speaker | John Bercow[n 4] | 34,299 | 65.1 | +0.6 | |
| Green | Michael Sheppard | 8,574 | 16.3 | +2.5 | |
| Independent | Scott Raven | 5,638 | 10.7 | N/A | |
| UKIP | Brian Mapletoft | 4,168 | 7.9 | -13.8 | |
| Majority | 25,795 | 49.0 | |||
| Turnout | 52,679 | 66.2% | |||
| Speaker hold | Swing | ||||
| Party | Candidate | Votes | % | ± | |
|---|---|---|---|---|---|
| Speaker | John Bercow[n 4] | 34,617 | 64.5 | +17.2 | |
| UKIP | Dave Fowler | 11,675 | 21.7 | +4.3 | |
| Green | Alan Francis | 7,400 | 13.7 | N/A | |
| Majority | 22,942 | 42.7 | 16.8 | ||
| Turnout | 53,692 | 69.3 | 4.8 | ||
| Speaker hold | Swing | +6.4 | |||
| Party | Candidate | Votes | % | ± | |
|---|---|---|---|---|---|
| Speaker | John Bercow[n 4] | 22,860 | 47.3 | -10.1 | |
| Buckinghamshire Campaign for Democracy | John Stevens | 10,331 | 21.4 | N/A | |
| UKIP | Nigel Farage | 8,410 | 17.4 | +14.4 | |
| Independent | Patrick Phillips | 2,394 | 5.0 | N/A | |
| Independent | Debbie Martin | 1,270 | 2.6 | N/A | |
| BNP | Lynne Mozar | 980 | 2.0 | N/A | |
| Monster Raving Loony | Colin Dale | 856 | 1.8 | N/A | |
| Independent | Geoff Howard | 435 | 0.9 | N/A | |
| Christian | David Hews | 369 | 0.8 | N/A | |
| Independent | Anthony Watts | 332 | 0.7 | N/A | |
| Cut The Deficit | Simon Strutt | 107 | 0.2 | N/A | |
| Majority | 12,529 | 25.9 | N/A | ||
| Turnout | 48,344 | 64.5 | −3.8 | ||
| Speaker gain from Conservative | Swing | N/A | |||
Elections in the 2000s
| Party | Candidate | Votes | % | ± | |
|---|---|---|---|---|---|
| Conservative | John Bercow | 27,748 | 57.4 | +3.7 | |
| Labour | David Greene | 9,619 | 19.9 | −4.3 | |
| Liberal Democrat | Luke Croydon | 9,508 | 19.7 | −0.3 | |
| UKIP | David Williams | 1,432 | 3.0 | +0.9 | |
| Majority | 18,129 | 37.5 | +8.0 | ||
| Turnout | 48,307 | 68.7 | −0.7 | ||
| Conservative hold | Swing | +4.0 | |||
| Party | Candidate | Votes | % | ± | |
|---|---|---|---|---|---|
| Conservative | John Bercow | 24,296 | 53.7 | +3.9 | |
| Labour | Mark Seddon | 10,971 | 24.2 | −0.5 | |
| Liberal Democrat | Isobel Wilson | 9,037 | 20.0 | −4.7 | |
| UKIP | Christopher Silcock | 968 | 2.1 | N/A | |
| Majority | 13,325 | 29.5 | +4.4 | ||
| Turnout | 45,272 | 69.4 | −9.1 | ||
| Conservative hold | Swing | +2.2 | |||
Elections in the 1990s
| Party | Candidate | Votes | % | ± | |
|---|---|---|---|---|---|
| Conservative | John Bercow | 24,594 | 49.8 | −12.7 | |
| Labour | Robert C. Lehmann | 12,208 | 24.7 | +8.5 | |
| Liberal Democrat | Neil Stuart | 12,175 | 24.6 | +4.0 | |
| Natural Law | Geoffrey Clements | 421 | 0.9 | +0.2 | |
| Majority | 12,386 | 25.1 | -16.8 | ||
| Turnout | 49,398 | 78.5 | -5.7 | ||
| Conservative hold | Swing | −10.6 | |||
| Party | Candidate | Votes | % | ± | |
|---|---|---|---|---|---|
| Conservative | George Walden | 29,496 | 62.5 | +3.8 | |
| Liberal Democrat | Tudor Jones | 9,705 | 20.6 | −4.3 | |
| Labour | Keith M. White | 7,662 | 16.2 | −0.3 | |
| Natural Law | Lawrence R. Sheaff | 353 | 0.7 | +0.7 | |
| Majority | 19,791 | 41.9 | +8.1 | ||
| Turnout | 47,216 | 84.2 | +5.9 | ||
| Conservative hold | Swing | +4.1 | |||
Elections in the 1980s
| Party | Candidate | Votes | % | ± | |
|---|---|---|---|---|---|
| Conservative | George Walden | 32,162 | 58.6 | +1.7 | |
| Liberal | Charles Burke | 13,636 | 24.9 | −3.2 | |
| Labour | Martyn Groucutt | 9,053 | 16.5 | +1.5 | |
| Majority | 18,526 | 33.8 | +5.0 | ||
| Turnout | 54,851 | 78.3 | +1.2 | ||
| Conservative hold | Swing | +2.5 | |||
| Party | Candidate | Votes | % | ± | |
|---|---|---|---|---|---|
| Conservative | George Walden | 27,522 | 56.9 | ||
| Liberal | R. Ryder | 13,584 | 28.1 | ||
| Labour | Martyn Groucutt | 7,272 | 15.0 | ||
| Majority | 13,938 | 28.8 | |||
| Turnout | 48,378 | 77.1 | |||
| Conservative hold | Swing | ||||
Elections in the 1970s
| Party | Candidate | Votes | % | ± | |
|---|---|---|---|---|---|
| Conservative | Bill Benyon | 41,719 | 51.3 | +9.1 | |
| Labour | J.S. Fryer | 27,752 | 34.1 | −3.5 | |
| Liberal | S.B. Crooks | 11,045 | 13.6 | −6.6 | |
| National Front | M. Smith | 803 | 1.0 | N/A | |
| Majority | 13,967 | 17.2 | |||
| Turnout | 81,319 | 78.6 | |||
| Conservative hold | Swing | +6.3 | |||
| Party | Candidate | Votes | % | ± | |
|---|---|---|---|---|---|
| Conservative | Bill Benyon | 26,597 | 42.2 | +1.5 | |
| Labour | Robert Maxwell | 23,679 | 37.6 | +1.6 | |
| Liberal | S.B. Crooks | 12,707 | 20.2 | −3.1 | |
| Majority | 2,918 | 4.6 | |||
| Turnout | 62,983 | 79.7 | |||
| Conservative hold | Swing | −0.1 | |||
| Party | Candidate | Votes | % | ± | |
|---|---|---|---|---|---|
| Conservative | Bill Benyon | 27,179 | 40.7 | −6.8 | |
| Labour | Robert Maxwell | 24,056 | 36.0 | −7.2 | |
| Liberal | C. Crooks | 15,519 | 23.3 | +14.0 | |
| Majority | 3,123 | 4.7 | |||
| Turnout | 66,754 | 85.3 | |||
| Conservative hold | Swing | −0.2 | |||
| Party | Candidate | Votes | % | ± | |
|---|---|---|---|---|---|
| Conservative | Bill Benyon | 28,088 | 47.5 | +4.3 | |
| Labour | Robert Maxwell | 25,567 | 43.2 | −4.3 | |
| Liberal | John M Cornwall | 5,475 | 9.3 | −0.1 | |
| Majority | 2,521 | 4.3 | |||
| Turnout | 59,130 | 81.8 | |||
| Conservative gain from Labour | Swing | +4.3 | |||
Elections in the 1960s
| Party | Candidate | Votes | % | ± | |
|---|---|---|---|---|---|
| Labour | Robert Maxwell | 24,854 | 47.5 | +1.6 | |
| Conservative | Elaine Kellett-Bowman | 22,600 | 43.2 | +0.2 | |
| Liberal | John M Cornwall | 4,914 | 9.4 | −1.7 | |
| Majority | 2,254 | 4.3 | |||
| Turnout | 52,368 | 85.8 | |||
| Labour hold | Swing | +0.7 | |||
| Party | Candidate | Votes | % | ± | |
|---|---|---|---|---|---|
| Labour | Robert Maxwell | 23,085 | 45.9 | +2.6 | |
| Conservative | Elaine Kellett-Bowman | 21,604 | 43.0 | −4.0 | |
| Liberal | Jack Raphael Wallis | 5,578 | 11.1 | +1.4 | |
| Majority | 1,181 | 3.0 | |||
| Turnout | 50,267 | 86.5 | |||
| Labour gain from Conservative | Swing | +3.3 | |||
Elections in the 1950s
| Party | Candidate | Votes | % | ± | |
|---|---|---|---|---|---|
| Conservative | Frank Markham | 22,304 | 47.0 | −4.3 | |
| Labour | Robert Maxwell | 20,558 | 43.3 | −5.4 | |
| Liberal | Evan Laurence Frederick Richards | 4,577 | 9.7 | N/A | |
| Majority | 1,746 | 3.7 | |||
| Turnout | 47,439 | 86.4 | |||
| Conservative hold | Swing | +0.6 | |||
| Party | Candidate | Votes | % | ± | |
|---|---|---|---|---|---|
| Conservative | Frank Markham | 23,250 | 51.3 | +1.2 | |
| Labour | David Gordon Evans | 22,110 | 48.7 | −1.2 | |
| Majority | 1,140 | 2.5 | |||
| Turnout | 45,360 | 85.1 | |||
| Conservative hold | Swing | +1.2 | |||
| Party | Candidate | Votes | % | ± | |
|---|---|---|---|---|---|
| Conservative | Frank Markham | 22,688 | 50.1 | +6.7 | |
| Labour | Aidan Crawley | 22,634 | 49.9 | +2.8 | |
| Majority | 54 | 0.1 | |||
| Turnout | 45,322 | 86.6 | |||
| Conservative gain from Labour | Swing | +2.0 | |||
| Party | Candidate | Votes | % | ± | |
|---|---|---|---|---|---|
| Labour | Aidan Crawley | 20,782 | 47.1 | −7.6 | |
| Conservative | Frank Markham | 19,128 | 43.4 | −1.9 | |
| Liberal | John Denis Gilbert Kellock | 4,196 | 9.5 | N/A | |
| Majority | 1,654 | 3.8 | |||
| Turnout | 44,106 | 86.2 | |||
| Labour hold | Swing | −2.9 | |||
Elections in the 1940s
| Party | Candidate | Votes | % | ± | |
|---|---|---|---|---|---|
| Labour | Aidan Crawley | 22,302 | 54.7 | +12.7 | |
| Conservative | Lionel Berry | 18,457 | 45.3 | −12.7 | |
| Majority | 3,845 | 9.4 | |||
| Turnout | 40,759 | 71.8 | |||
| Labour gain from Conservative | Swing | +12.7 | |||
| Party | Candidate | Votes | % | ± | |
|---|---|---|---|---|---|
| Conservative | Lionel Berry | Unopposed | N/A | N/A | |
| Conservative hold | Swing | n/a | |||
Elections in the 1930s
| Party | Candidate | Votes | % | ± | |
|---|---|---|---|---|---|
| Conservative | John Whiteley | 17,919 | 52.6 | −5.4 | |
| Labour | James Viner Delahaye | 12,820 | 37.6 | −4.4 | |
| Liberal | E.J. Boyce | 3,348 | 9.8 | N/A | |
| Majority | 5,099 | 15.0 | −1.0 | ||
| Turnout | 34,087 | 71.4 | −3.7 | ||
| Conservative hold | Swing | ||||
| Party | Candidate | Votes | % | ± | |
|---|---|---|---|---|---|
| Conservative | George Bowyer | 20,616 | 58.0 | ||
| Labour | Joseph Sparks | 14,928 | 42.0 | ||
| Majority | 5,688 | 16.0 | |||
| Turnout | 35,544 | 75.13 | |||
| Conservative hold | Swing | ||||
| Party | Candidate | Votes | % | ± | |
|---|---|---|---|---|---|
| Conservative | George Bowyer | 23,783 | 66.96 | ||
| Labour | James Lievsley George | 11,736 | 33.04 | ||
| Majority | 12,047 | 33.92 | |||
| Turnout | 77.73 | ||||
| Conservative hold | Swing | ||||
Elections in the 1920s
| Party | Candidate | Votes | % | ± | |
|---|---|---|---|---|---|
| Unionist | George Bowyer | 16,375 | 45.8 | −6.0 | |
| Labour | James Lievsley George | 11,718 | 32.7 | +2.1 | |
| Liberal | Norman Crump | 7,713 | 21.5 | +3.9 | |
| Majority | 4,657 | 13.1 | −8.1 | ||
| Turnout | 35,806 | 79.6 | +1.5 | ||
| Registered electors | 44,974 | ||||
| Unionist hold | Swing | −4.1 | |||
| Party | Candidate | Votes | % | ± | |
|---|---|---|---|---|---|
| Unionist | George Bowyer | 15,129 | 51.8 | −1.2 | |
| Labour | E. J. Pay | 8,939 | 30.6 | −16.4 | |
| Liberal | R Kingesley-Johnson | 5,144 | 17.6 | N/A | |
| Majority | 6,190 | 21.2 | +15.2 | ||
| Turnout | 29,212 | 78.1 | +9.7 | ||
| Registered electors | 37,394 | ||||
| Unionist hold | Swing | +7.6 | |||
| Party | Candidate | Votes | % | ± | |
|---|---|---|---|---|---|
| Unionist | George Bowyer | 13,351 | 53.0 | +3.6 | |
| Labour | E. J. Pay | 11,824 | 47.0 | +20.7 | |
| Majority | 1,527 | 6.0 | −17.1 | ||
| Turnout | 25,175 | 68.4 | −8.5 | ||
| Registered electors | 36,785 | ||||
| Unionist hold | Swing | −8.6 | |||
| Party | Candidate | Votes | % | ± | |
|---|---|---|---|---|---|
| Unionist | George Bowyer | 13,751 | 49.4 | −4.3 | |
| Labour | Owen Connellan | 7,343 | 26.3 | −6.0 | |
| Liberal | Charles Hobhouse | 6,789 | 24.3 | +9.3 | |
| Majority | 6,408 | 23.1 | +1.7 | ||
| Turnout | 27,883 | 76.9 | +13.3 | ||
| Registered electors | 36,262 | ||||
| Unionist hold | Swing | +0.9 | |||
Elections in the 1910s
| Party | Candidate | Votes | % | ± | |
|---|---|---|---|---|---|
| C | Unionist | George Bowyer | 12,441 | 53.7 | +5.1 |
| Labour | John Scurr | 7,481 | 32.3 | N/A | |
| Liberal | Harry Verney | 3,250 | 14.0 | −37.4 | |
| Majority | 4,960 | 21.4 | N/A | ||
| Turnout | 23,172 | 63.6 | −26.1 | ||
| Registered electors | 36,434 | ||||
| Unionist gain from Liberal | Swing | N/A | |||
| C indicates candidate endorsed by the coalition government. | |||||
| Party | Candidate | Votes | % | ± | |
|---|---|---|---|---|---|
| Liberal | Harry Verney | 6,029 | 51.4 | +0.9 | |
| Liberal Unionist | Francis Tyringham Higgins Bernard | 5,702 | 48.6 | -0.9 | |
| Majority | 327 | 2.8 | +1.8 | ||
| Turnout | 89.7 | -2.0 | |||
| Liberal hold | Swing | +0.9 | |||
| Party | Candidate | Votes | % | ± | |
|---|---|---|---|---|---|
| Liberal | Frederick Verney | 6,055 | 50.5 | -6.7 | |
| Conservative | Thomas Fremantle | 5,944 | 49.5 | +6.7 | |
| Majority | 111 | 1.0 | -13.4 | ||
| Turnout | 91.7 | +3.1 | |||
| Liberal hold | Swing | -6.7 | |||
Elections in the 1900s
| Party | Candidate | Votes | % | ± | |
|---|---|---|---|---|---|
| Liberal | Frederick Verney | 6,253 | 57.2 | +9.3 | |
| Conservative | Thomas Fremantle | 4,673 | 42.8 | −9.3 | |
| Majority | 1,580 | 14.4 | N/A | ||
| Turnout | 10,926 | 88.6 | +4.9 | ||
| Registered electors | 12,334 | ||||
| Liberal gain from Conservative | Swing | +9.3 | |||
| Party | Candidate | Votes | % | ± | |
|---|---|---|---|---|---|
| Conservative | William Carlile | 5,101 | 52.1 | −0.1 | |
| Liberal | Hubert Beaumont | 4,684 | 47.9 | +0.1 | |
| Majority | 417 | 4.2 | −0.2 | ||
| Turnout | 9,785 | 83.7 | −4.9 | ||
| Registered electors | 11,685 | ||||
| Conservative hold | Swing | −0.1 | |||
Elections in the 1890s
| Party | Candidate | Votes | % | ± | |
|---|---|---|---|---|---|
| Conservative | William Carlile | 5,266 | 52.2 | +4.5 | |
| Liberal | Herbert Leon | 4,830 | 47.8 | −4.5 | |
| Majority | 436 | 4.4 | N/A | ||
| Turnout | 10,096 | 88.6 | +3.0 | ||
| Registered electors | 11,395 | ||||
| Conservative gain from Liberal | Swing | +4.5 | |||
| Party | Candidate | Votes | % | ± | |
|---|---|---|---|---|---|
| Liberal | Herbert Leon | 5,153 | 52.3 | +3.4 | |
| Conservative | William Carlile | 4,704 | 47.7 | −3.4 | |
| Majority | 449 | 4.6 | N/A | ||
| Turnout | 9,857 | 85.6 | +7.3 | ||
| Registered electors | 11,518 | ||||
| Liberal gain from Conservative | Swing | +3.4 | |||
| Party | Candidate | Votes | % | ± | |
|---|---|---|---|---|---|
| Liberal | Herbert Leon | 5,013 | 52.0 | +2.4 | |
| Conservative | Evelyn Hubbard | 4,632 | 48.0 | −2.4 | |
| Majority | 381 | 4.0 | N/A | ||
| Turnout | 9,645 | 84.6 | +6.3 | ||
| Registered electors | 11,407 | ||||
| Liberal gain from Conservative | Swing | +2.4 | |||
Elections in the 1880s
| Party | Candidate | Votes | % | ± | |
|---|---|---|---|---|---|
| Liberal | Edmund Verney | 4,855 | 51.1 | +1.5 | |
| Conservative | Evelyn Hubbard | 4,647 | 48.9 | −1.5 | |
| Majority | 208 | 2.2 | N/A | ||
| Turnout | 9,502 | 75.6 | −2.7 | ||
| Registered electors | 12,565 | ||||
| Liberal gain from Conservative | Swing | +1.5 | |||
- Caused by Hubbard's elevation to the peerage, becoming Lord Addington.
| Party | Candidate | Votes | % | ± | |
|---|---|---|---|---|---|
| Conservative | Egerton Hubbard | 4,460 | 50.4 | +8.1 | |
| Liberal | Edmund Verney | 4,389 | 49.6 | −8.1 | |
| Majority | 71 | 0.8 | N/A | ||
| Turnout | 8,849 | 78.3 | −5.4 | ||
| Registered electors | 11,307 | ||||
| Conservative gain from Liberal | Swing | +8.1 | |||
| Party | Candidate | Votes | % | ± | |
|---|---|---|---|---|---|
| Liberal | Edmund Verney | 5,462 | 57.7 | +7.3 | |
| Conservative | Samuel Wilson | 4,006 | 42.3 | −7.3 | |
| Majority | 1,456 | 15.4 | +14.6 | ||
| Turnout | 9,468 | 83.7 | −7.5 | ||
| Registered electors | 11,307 | ||||
| Liberal hold | Swing | +7.3 | |||
| Party | Candidate | Votes | % | ± | |
|---|---|---|---|---|---|
| Liberal | Harry Verney | 528 | 50.4 | +10.5 | |
| Conservative | Egerton Hubbard | 520 | 49.6 | −10.5 | |
| Majority | 8 | 0.8 | N/A | ||
| Turnout | 1,048 | 91.2 | +3.5 | ||
| Registered electors | 1,149 | ||||
| Liberal gain from Conservative | Swing | +10.5 | |||
Elections in the 1870s
| Party | Candidate | Votes | % | ± | |
|---|---|---|---|---|---|
| Conservative | Egerton Hubbard | 589 | 60.1 | +17.9 | |
| Liberal | Harry Verney | 391 | 39.9 | −17.9 | |
| Majority | 198 | 20.2 | N/A | ||
| Turnout | 980 | 87.7 | +3.2 | ||
| Registered electors | 1,118 | ||||
| Conservative gain from Liberal | Swing | +17.9 | |||
Elections in the 1860s
| Party | Candidate | Votes | % | ± | |
|---|---|---|---|---|---|
| Liberal | Harry Verney | 463 | 57.8 | N/A | |
| Conservative | John Hubbard | 338 | 42.2 | N/A | |
| Majority | 125 | 15.6 | N/A | ||
| Turnout | 801 | 84.5 | N/A | ||
| Registered electors | 948 | ||||
| Liberal hold | Swing | N/A | |||
| Party | Candidate | Votes | % | ± | |
|---|---|---|---|---|---|
| Liberal | Harry Verney | Unopposed | |||
| Conservative | John Hubbard | Unopposed | |||
| Registered electors | 948 | ||||
| Liberal hold | |||||
| Conservative hold | |||||
Elections in the 1850s
| Party | Candidate | Votes | % | ± | |
|---|---|---|---|---|---|
| Liberal | Harry Verney | 198 | 36.6 | −21.8 | |
| Conservative | John Hubbard | 196 | 36.2 | +9.2 | |
| Conservative | George Barrington[37] | 147 | 27.2 | +12.6 | |
| Majority | 2 | 0.4 | −7.1 | ||
| Turnout | 271 (est) | 74.3 (est) | −4.8 | ||
| Registered electors | 364 | ||||
| Liberal hold | Swing | −21.8 | |||
| Conservative hold | Swing | +10.1 | |||
| Party | Candidate | Votes | % | ± | |
|---|---|---|---|---|---|
| Whig | Harry Verney | 193 | 34.5 | N/A | |
| Conservative | John Hall | 151 | 27.0 | N/A | |
| Whig | Richard Cavendish[38] | 134 | 23.9 | N/A | |
| Conservative | Philip Box[39] | 82 | 14.6 | N/A | |
| Turnout | 280 (est) | 79.1 (est) | N/A | ||
| Registered electors | 354 | ||||
| Majority | 42 | 7.5 | N/A | ||
| Whig gain from Conservative | Swing | N/A | |||
| Majority | 17 | 3.0 | N/A | ||
| Conservative hold | Swing | N/A | |||
| Party | Candidate | Votes | % | ± | |
|---|---|---|---|---|---|
| Conservative | John Hall | Unopposed | |||
| Conservative | Richard Temple-Nugent-Brydges-Chandos-Grenville | Unopposed | |||
| Registered electors | 349 | ||||
| Conservative hold | |||||
| Conservative hold | |||||
| Party | Candidate | Votes | % | ± | |
|---|---|---|---|---|---|
| Conservative | Richard Temple-Nugent-Brydges-Chandos-Grenville | Unopposed | |||
| Conservative hold | |||||
- Caused by Temple-Nugent-Brydges-Chandos-Grenville's appointment as a Lord Commissioner of the Treasury.
See also
Notes and references
- Notes
- ↑ A county constituency (for the purposes of election expenses and type of returning officer)
- ↑ As with all constituencies, the constituency elects one Member of Parliament (MP) by the first past the post system of election at least every five years.
- ↑ The development of Milton Keynes commenced in 1967.
- 1 2 3 John Bercow stood as 'The Speaker seeking re-election'.
- References
- ↑ "Buckingham: Usual Resident Population, 2011". Neighbourhood Statistics. Office for National Statistics. Retrieved 7 February 2015.
- ↑ "Electorate Figures - Boundary Commission for England". 2011 Electorate Figures. Boundary Commission for England. 4 March 2011. Archived from the original on 6 November 2010. Retrieved 13 March 2011.
- ↑ Stuff, Good. "Chequers, Ellesborough, Buckinghamshire". www.britishlistedbuildings.co.uk.
- ↑ "Seat Details". www.electoralcalculus.co.uk.
- ↑ The Guardian profile of the seat as at 2010.
- 1 2 3 4 5 6 7 8 9 10 "History of Parliament". Retrieved 2011-09-29.
- 1 2 3 4 5 6 7 8 9 10 "History of Parliament". Retrieved 2011-09-29.
- 1 2 "Buckingham 1660-". Hansard 1803-2005. UK Parliament. Retrieved 7 February 2015. [For members from 1796].
- 1 2 3 Leigh Rayment's Historical List of MPs – Constituencies beginning with "B" (part 6)
- 1 2 Martin, Howard (1996). "Years of Whig Achievement and Conservative Renewal, 1833–41". Britain in the 19th Century. Cheltenham: Thomas Nelson and Sons. p. 117. ISBN 0174350627. Retrieved 8 April 2018.
- 1 2 Evans, Eric J. (2001). "The age of Peel? Politics and policies, 1832–1846". The Forging of the Modern State: Early industrial Britain 1783–1870 (Third ed.). Abingdon: Routledge. p. 310. ISBN 978-0-582-47267-9. Retrieved 20 April 2018.
- 1 2 The Assembled Commons or Parliamentary Biographer: 1836. 1836. p. 176.
- ↑ "Buckingham 1660-". Hansard 1803-2005. UK Parliament. Retrieved 7 February 2015.
- ↑ "Statement of Persons Nominated - Buckingham" (PDF). Aylesbury Vale District Council. Retrieved 12 May 2017.
- ↑ "Buckingham parliamentary constituency – Election 2017 – BBC News". BBC.com. BBC. Retrieved 9 June 2017.
- ↑ "Election Data 2015". Electoral Calculus. Archived from the original on 17 October 2015. Retrieved 17 October 2015.
- ↑ "General election 2015 - results - AVDC". www.aylesburyvaledc.gov.uk.
- ↑ "Election Data 2010". Electoral Calculus. Archived from the original on 26 July 2013. Retrieved 17 October 2015.
- ↑ Aylesburyvaledc.gov.uk Aylesbury Vale District Council
- ↑ "BBC News - Election 2010 - Constituency - Buckingham". news.bbc.co.uk.
- ↑ "Election Data 2005". Electoral Calculus. Archived from the original on 15 October 2011. Retrieved 18 October 2015.
- ↑ "Election Data 2001". Electoral Calculus. Archived from the original on 15 October 2011. Retrieved 18 October 2015.
- ↑ "Election Data 1997". Electoral Calculus. Archived from the original on 15 October 2011. Retrieved 18 October 2015.
- ↑ "Election Data 1992". Electoral Calculus. Archived from the original on 15 October 2011. Retrieved 18 October 2015.
- ↑ "Politics Resources". Election 1992. Politics Resources. 9 April 1992. Retrieved 2010-12-06.
- ↑ "Election Data 1987". Electoral Calculus. Archived from the original on 15 October 2011. Retrieved 18 October 2015.
- ↑ "Election Data 1983". Electoral Calculus. Archived from the original on 15 October 2011. Retrieved 18 October 2015.
- ↑ British Parliamentary Election Results 1918-1949, FWS Craig
- 1 2 3 4 5 British parliamentary election results 1918-1949, Craig, F.W.S.
- 1 2 3 4 British parliamentary election results, 1885-1918 (Craig)
- 1 2 3 Craig, FWS, ed. (1974). British Parliamentary Election Results: 1885-1918. London: Macmillan Press. ISBN 9781349022984.
- 1 2 The Constitutional Year Book, 1904, published by Conservative Central Office, page 140 (164 in web page), Berkshire
- 1 2 3 British Parliamentary Election Results 1885-1918, FWS Craig
- ↑ The Liberal Year Book, 1907
- ↑ Debrett's House of Commons & Judicial Bench, 1886
- 1 2 3 4 5 6 7 8 Craig, F. W. S., ed. (1977). British Parliamentary Election Results 1832-1885 (e-book)
|format=requires|url=(help) (1st ed.). London: Macmillan Press. ISBN 978-1-349-02349-3. - ↑ "To the Electors of the County of Buckingham". Bucks Herald. 9 April 1859. p. 4. Retrieved 20 April 2018 – via British Newspaper Archive. (Subscription required (help)).
- ↑ "To the Editor of the Morning Advertiser". Morning Advertiser. 14 April 1857. pp. 5–6. Retrieved 20 April 2018 – via British Newspaper Archive. (Subscription required (help)).
- ↑ "Buckingham". Oxford Chronicle and Reading Gazette. 28 March 1857. p. 8. Retrieved 20 April 2018 – via British Newspaper Archive. (Subscription required (help)).
- Sources
External links
- nomis Constituency Profile for Buckingham — presenting data from the ONS annual population survey and other official statistics.
| Parliament of the United Kingdom | ||
|---|---|---|
| Vacant since 1754 Title last held by Sussex |
Constituency represented by the Prime Minister 1763–1765 |
Vacant until 1766 Title next held by Bath |
| Preceded by Glasgow North East |
Constituency represented by the Speaker 2009–present |
Incumbent |
| Towns (component areas and hamlets) | 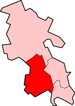 | |
|---|---|---|
| Other civil parishes (component villages and hamlets) |
| |
| Former districts and boroughs | ||
| Former constituencies | ||