St Albans (UK Parliament constituency)
Coordinates: 51°44′24″N 0°20′13″W / 51.740°N 0.337°W
| St Albans | |
|---|---|
|
County constituency for the House of Commons | |
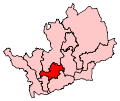 Boundary of St Albans in Hertfordshire. | |
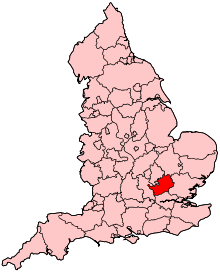 Location of Hertfordshire within England. | |
| County | Hertfordshire |
| Electorate | 70,298 (December 2010)[1] |
| Current constituency | |
| Created | 1885 |
| Member of parliament | Anne Main (Conservative) |
| Number of members | One |
| Created from | Hertfordshire |
| 1554–1852 | |
| Number of members | Two |
| Type of constituency | Borough constituency |
| Replaced by | Hertfordshire |
| Overlaps | |
| European Parliament constituency | East of England |
St Albans is a constituency[n 1] represented in the House of Commons of the UK Parliament since 2005 by Anne Main, a Conservative.[n 2]
This article also describes the parliamentary borough (1554-1852) of the same name, consisting only of the city of St Albans, which elected two MPs by the bloc vote system.
Current boundaries
The seat is in Hertfordshire, England. Specifically, it comprises the cathedral city of St Albans and some of the surrounding countryside, mainly to the south of the city.
Constituencies were most recently redrawn in 2007, with the new boundaries taking effect at the 2010 general election. The Boundary Commission for England decided to retain the existing 11 seats in Hertfordshire, making relatively minor adjustments to bring the parliamentary boundaries in line with those of local government wards, which had changed since the 1995 review.[2]
The seat since 2010 comprises the following electoral wards:[3]
- Ashley, Batchwood, Clarence, Colney Heath, Cunningham, London Colney, Marshalswick North, Marshalswick South, Park Street, St Peter's, St Stephen, Sopwell, and Verulam in the City of St Albans
- Bedmond and Primrose Hill in the Three Rivers District.
Historic boundaries
1885-1918:
1918-1945: The Municipal Borough of St Albans, the Urban Districts of Barnet and East Barnet Valley, the Rural Districts of Barnet and Hatfield, and the part of the Rural District of St Albans which was not included in the Hemel Hempstead constituency.
1945-1950:
1950-1955: The Municipal Borough of St Albans, the Urban District of Welwyn Garden City, the Rural District of Welwyn, and the Rural District of St Albans except the civil parishes of Harpenden Rural and Redbourn.
1955-1974: The Municipal Borough of St Albans, and in the Rural District of St Albans the civil parishes of Colney Heath, London Colney, Sandridge Rural, St Michael Rural, St Stephen, and Wheathampstead.
1974-1983: The Municipal Borough of St Albans, the Urban District of Harpenden, and in the Rural District of St Albans the civil parishes of Harpenden Rural, Redbourn, St Michael Rural, Sandridge, and Wheathampstead.
1983-1997: The District of St Albans wards of Ashley, Batchwood, Clarence, Colney Heath, Cunningham, Harpenden East, Harpenden North, Harpenden South, Harpenden West, Marshalswick North, Marshalswick South, Redbourn, St Peter's, Sandridge, Sopwell, and Verulam.
1997-2010: The District of St Albans wards of Ashley, Batchwood, Clarence, Colney Heath, Cunningham, London Colney, Marshalswick North, Marshalswick South, Park Street, St Peter's, St Stephen's, Sopwell, and Verulam, and the District of Three Rivers ward of Bedmond.
History
The constituency elected a borough representative for over 300 years, until it was disenfranchised as a result of electoral corruption in 1852.[4] The constituency was re-established in an enlarged form in 1885 with an alternative pseudonym, the Mid Division of Hertfordshire. Both names were used in the Redistribution of Seats Act, which dovetailed with the Third Reform Act.
1885 to date
- Political history
The constituency was until 1997 held by a Conservative with the exception of five years of the Attlee ministry and early 20th century opposition of Henry Campbell-Bannerman and the first part of his premiership which was when he was in a minority.
Following boundary changes in 1997, and the founding of the New Labour movement which sought public sector reform and investment with expansion based on economic growth, the seat stood the possibility of, on the expected national swing led by Tony Blair, a win by a Labour politician, which took place when it was won for the party for the first time since the 1945 election.
Despite the former Labour MP for the seat, Kerry Pollard, standing there in 2015 and 2017, he has not come close to regaining it. This is in no small part due to the seat showing an unusually high level of support for the Liberal Democrats and their predecessor parties; they have only twice (in 2001 and 2015) failed to win at least 20% of the vote in St Albans since 1974, and in 2010 and 2017 came a strong second (4.4% and 10.7%) behind the Conservatives.
- Prominent members
The noble and local landowning Grimston family have produced nine members throughout the seat's history. The three first heirs to the Earldom of Verulam have won election in the seat - the latest MP from the family was John Grimston who later became the 6th Earl.
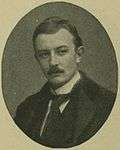
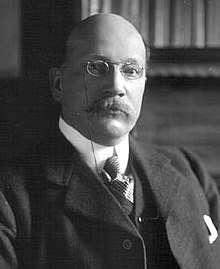
Sir Hildred Carlile was a textiles entrepreneur and generous benefactor of Bedford College, University of London.
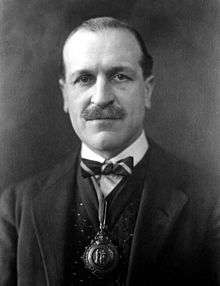
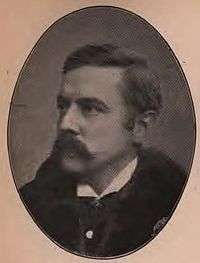
Francis Fremantle was chairman of the Parliamentary Medical Committee from 1923 to 1943.
Peter Lilley was a frontbench minister in government from 1992 until 1997, the Secretary of State for Social Security, after two years as Secretary of State for Trade and Industry.
Constituency profile
Workless claimants (registered jobseekers) were in November 2012 significantly lower than the national average of 3.8%, at 1.9% of the population based on a statistical compilation by The Guardian.[5]
MPs since 1885
Election Results
| Party | Candidate | Votes | % | ± | |
|---|---|---|---|---|---|
| Conservative | Anne Main | 24,571 | 43.1 | ||
| Liberal Democrat | Daisy Cooper | 18,462 | 32.4 | ||
| Labour | Kerry Pollard | 13,137 | 23.0 | ||
| Green | Jack Easton | 828 | 1.5 | ||
| Majority | 6,109 | 10.7 | |||
| Turnout | 56,998 | 78.3 | |||
| Conservative hold | Swing | ||||
| Party | Candidate | Votes | % | ± | |
|---|---|---|---|---|---|
| Conservative | Anne Main | 25,392 | 46.6 | ||
| Labour | Kerry Pollard | 12,660 | 23.3 | ||
| Liberal Democrat | Sandy Walkington | 10,076 | 18.5 | ||
| UKIP | Chris Wright | 4,271 | 7.8 | ||
| Green | Jack Easton | 2,034 | 3.7 | ||
| Majority | 12,732 | 23.4 | |||
| Turnout | 54,433 | 72.0 | |||
| Conservative hold | Swing | ||||
| Party | Candidate | Votes | % | ± | |
|---|---|---|---|---|---|
| Conservative | Anne Main | 21,533 | 40.8 | ||
| Liberal Democrat | Sandy Walkington | 19,228 | 36.4 | ||
| Labour | Roma Mills | 9,288 | 17.6 | ||
| UKIP | John Stocker | 2,028 | 3.8 | ||
| Green | Jack Easton | 758 | 1.4 | N/A | |
| Majority | 2,305 | 4.4 | |||
| Turnout | 52,835 | 75.4 | |||
| Conservative hold | Swing | ||||
Elections in the 2000s
| Party | Candidate | Votes | % | ± | |
|---|---|---|---|---|---|
| Conservative | Anne Main | 16,953 | 37.3 | ||
| Labour | Kerry Pollard | 15,592 | 34.3 | ||
| Liberal Democrat | Michael Green | 11,561 | 25.4 | ||
| UKIP | Richard Evans | 707 | 1.6 | ||
| St Albans Party | Janet Girsman | 430 | 0.9 | N/A | |
| Independent | Mark Reynolds | 219 | 0.5 | N/A | |
| Majority | 1,361 | 3.0 | N/A | ||
| Turnout | 45,462 | 70.00 | |||
| Conservative gain from Labour | Swing | ||||
| Party | Candidate | Votes | % | ± | |
|---|---|---|---|---|---|
| Labour | Kerry Pollard | 19,889 | 45.4 | ||
| Conservative | Charles Elphicke | 15,423 | 35.2 | ||
| Liberal Democrat | Nick Rijke | 7,847 | 17.9 | ||
| UKIP | Chris Sherwin | 602 | 1.4 | N/A | |
| Majority | 4,466 | 10.2 | |||
| Turnout | 43,761 | 66.3 | |||
| Labour hold | Swing | ||||
Elections in the 1990s
| Party | Candidate | Votes | % | ± | |
|---|---|---|---|---|---|
| Labour | Kerry Pollard | 21,338 | 42.0 | +17.0 | |
| Conservative | David Rutley | 16,879 | 33.2 | -12.4 | |
| Liberal Democrat | Anthony Rowlands | 10,692 | 21.0 | -6.9 | |
| Referendum | Jim Warrilow | 1,619 | 3.2 | N/A | |
| Rainbow Dream Ticket | Sari Craigen | 166 | 0.3 | N/A | |
| Natural Law | Ian Docker | 111 | 0.2 | -0.1 | |
| Majority | 4,459 | 8.8 | N/A | ||
| Turnout | 50,805 | 77.5 | -6.0 | ||
| Labour gain from Conservative | Swing | +21.1 | |||
| Party | Candidate | Votes | % | ± | |
|---|---|---|---|---|---|
| Conservative | Peter Lilley | 32,709 | 52.8 | +0.3 | |
| Liberal Democrat | Monica Howes | 16,305 | 26.3 | -8.2 | |
| Labour | Kerry Pollard | 12,016 | 19.4 | +7.9 | |
| Green | Craig Simmons | 734 | 1.2 | -0.1 | |
| Natural Law | David Lucas | 161 | 0.3 | N/A | |
| Majority | 16,404 | 26.5 | +8.5 | ||
| Turnout | 61,925 | 83.5 | +3.3 | ||
| Conservative hold | Swing | -4.3 | |||
Elections in the 1980s
| Party | Candidate | Votes | % | ± | |
|---|---|---|---|---|---|
| Conservative | Peter Lilley | 31,726 | 52.5 | +0.5 | |
| Liberal | Alexander Walkington | 20,845 | 34.5 | -2.5 | |
| Labour | Tony McWalter | 6,922 | 11.5 | +0.6 | |
| Green | Elaine Field | 788 | 1.3 | N/A | |
| CPRP | William Pass | 110 | 0.2 | N/A | |
| Majority | 10,881 | 18.0 | +3.0 | ||
| Turnout | 60,391 | 80.2 | +2.0 | ||
| Conservative hold | Swing | +1.5 | |||
| Party | Candidate | Votes | % | ± | |
|---|---|---|---|---|---|
| Conservative | Peter Lilley | 29,676 | 52.1 | -1.0 | |
| Liberal | Alexander Walkington | 21,115 | 37.0 | +13.2 | |
| Labour | R Austin | 6,213 | 10.9 | -12.2 | |
| Majority | 8,561 | 15.0 | -14.2 | ||
| Turnout | 57,004 | 78.3 | -2.1 | ||
| Conservative hold | Swing | -7.1 | |||
Elections in the 1970s
| Party | Candidate | Votes | % | ± | |
|---|---|---|---|---|---|
| Conservative | Victor Goodhew | 31,301 | 53.1 | +8.1 | |
| Liberal | David Michael Picton | 14,057 | 23.8 | -3.1 | |
| Labour | Ronald John Greaves | 13,638 | 23.1 | -5.0 | |
| Majority | 17,244 | 29.2 | +12.4 | ||
| Turnout | 58,996 | 80.4 | +2.4 | ||
| Conservative hold | Swing | +5.6 | |||
| Party | Candidate | Votes | % | ± | |
|---|---|---|---|---|---|
| Conservative | Victor Goodhew | 24,436 | 45.0 | -0.2 | |
| Labour | Edwin Hudson | 15,301 | 28.2 | +4.1 | |
| Liberal | Charles Anthony Shaw | 14,614 | 26.9 | -3.8 | |
| Majority | 9,135 | 16.8 | +2.4 | ||
| Turnout | 54,351 | 78.0 | -6.6 | ||
| Conservative hold | Swing | -2.15 | |||
| Party | Candidate | Votes | % | ± | |
|---|---|---|---|---|---|
| Conservative | Victor Goodhew | 26,345 | 45.2 | -6.4 | |
| Liberal | Charles Anthony Shaw | 17,924 | 30.7 | +17.2 | |
| Labour | Daniel Lipman Bernstein | 14,077 | 24.1 | -10.8 | |
| Majority | 8,421 | 14.4 | -2.2 | ||
| Turnout | 58,356 | 84.6 | +8.4 | ||
| Conservative hold | Swing | -11.8 | |||
| Party | Candidate | Votes | % | ± | |
|---|---|---|---|---|---|
| Conservative | Victor Goodhew | 24,503 | 51.5 | +3.8 | |
| Labour | Christopher Hubert Beaumont | 16,629 | 35.0 | -6.7 | |
| Liberal | Charles Anthony Shaw | 6,439 | 13.5 | +2.9 | |
| Majority | 7,874 | 16.6 | +10.5 | ||
| Turnout | 47,571 | 76.2 | -6.8 | ||
| Conservative hold | Swing | +5.3 | |||
Elections in the 1960s
| Party | Candidate | Votes | % | ± | |
|---|---|---|---|---|---|
| Conservative | Victor Goodhew | 22,260 | 47.7 | -0.3 | |
| Labour | Keith Kyle | 19,428 | 41.6 | +5.4 | |
| Liberal | Julian J Wates | 4,977 | 10.7 | -5.1 | |
| Majority | 2,832 | 6.1 | -5.7 | ||
| Turnout | 46,665 | 83.0 | +0.4 | ||
| Conservative hold | Swing | -2.8 | |||
| Party | Candidate | Votes | % | ± | |
|---|---|---|---|---|---|
| Conservative | Victor Goodhew | 22,063 | 48.0 | -4.9 | |
| Labour | Bruce Douglas-Mann | 16,672 | 36.3 | +2.8 | |
| Liberal | William Glanville Brown | 7,231 | 15.7 | +2.1 | |
| Majority | 5,391 | 11.7 | -7.7 | ||
| Turnout | 45,966 | 82.6 | -0.2 | ||
| Conservative hold | Swing | -3.9 | |||
Elections in the 1950s
| Party | Candidate | Votes | % | ± | |
|---|---|---|---|---|---|
| Conservative | Victor Goodhew | 23,157 | 52.9 | -4.6 | |
| Labour | Lawrence William Carroll | 14,650 | 33.5 | -9.0 | |
| Liberal | WA Newton Jones | 5,948 | 13.6 | N/A | |
| Majority | 8,507 | 19.4 | +4.4 | ||
| Turnout | 52,823 | 82.8 | +3.5 | ||
| Conservative hold | Swing | +2.2 | |||
| Party | Candidate | Votes | % | ± | |
|---|---|---|---|---|---|
| Conservative | John Grimston | 21,828 | 57.5 | +3.0 | |
| Labour | Renée Short | 16,107 | 42.5 | -3.0 | |
| Majority | 5,721 | 15.1 | +6.2 | ||
| Turnout | 37,935 | 79.3 | -4.8 | ||
| Conservative hold | Swing | +3.0 | |||
| Party | Candidate | Votes | % | ± | |
|---|---|---|---|---|---|
| Conservative | John Grimston | 28,602 | 54.5 | +7.2 | |
| Labour | John McKnight | 23,911 | 45.5 | +2.9 | |
| Majority | 4,691 | 8.9 | +4.4 | ||
| Turnout | 52,513 | 84.1 | -0.8 | ||
| Conservative hold | Swing | +2.2 | |||
| Party | Candidate | Votes | % | ± | |
|---|---|---|---|---|---|
| Conservative | John Grimston | 24,733 | 47.2 | +4.4 | |
| Labour | Cyril Dumpleton | 22,351 | 42.7 | -3.8 | |
| Liberal | Deryck Abel | 5,280 | 10.1 | -0.6 | |
| Majority | 2,382 | 4.6 | N/A | ||
| Turnout | 52,464 | 85.0 | +12.4 | ||
| Conservative gain from Labour | Swing | -4.1 | |||
Elections in the 1940s
| Party | Candidate | Votes | % | ± | |
|---|---|---|---|---|---|
| Labour | Cyril Dumpleton | 22,421 | 46.5 | +14.0 | |
| Conservative | John Grimston | 22,362 | 42.8 | -24.7 | |
| Liberal | Enid Lakeman | 5,601 | 10.7 | N/A | |
| Majority | 1,879 | 3.7 | N/A | ||
| Turnout | 50,384 | 72.6 | +10.0 | ||
| Labour gain from Conservative | Swing | +19.35 | |||
| Party | Candidate | Votes | % | ± | |
|---|---|---|---|---|---|
| Conservative | John Grimston | Unopposed | |||
| Conservative hold | |||||
Elections in the 1930s
| Party | Candidate | Votes | % | ± | |
|---|---|---|---|---|---|
| Conservative | Francis Fremantle | 33,743 | 67.5 | -10.6 | |
| Labour | Hugh Franklin | 16,233 | 35.5 | +10.6 | |
| Majority | 17,510 | 35.0 | -21.2 | ||
| Turnout | 49,976 | 62.6 | -9.3 | ||
| Conservative hold | Swing | -10.6 | |||
| Party | Candidate | Votes | % | ± | |
|---|---|---|---|---|---|
| Conservative | Francis Fremantle | 36,690 | 78.1 | +30.0 | |
| Labour | Monica Whately | 10,289 | 21.9 | -5.7 | |
| Majority | 26,401 | 56.2 | +35.7 | ||
| Turnout | 46,979 | 71.9 | -0.7 | ||
| Conservative hold | Swing | +17.8 | |||
Elections in the 1920s
| Party | Candidate | Votes | % | ± | |
|---|---|---|---|---|---|
| Unionist | Francis Fremantle | 20,436 | 48.1 | -19.4 | |
| Labour | Monica Whately | 11,699 | 27.6 | -4.9 | |
| Liberal | George Gordon Honeyman | 10,299 | 24.3 | N/A | |
| Majority | 8,737 | 20.5 | -14.5 | ||
| Turnout | 41,434 | 72.6 | +2.3 | ||
| Unionist hold | Swing | -7.25 | |||
| Party | Candidate | Votes | % | ± | |
|---|---|---|---|---|---|
| Unionist | Francis Fremantle | 18,004 | 67.5 | +19.8 | |
| Labour | Frank Herbert | 8,862 | 32.5 | +6.0 | |
| Majority | 9,322 | 35.0 | +13.8 | ||
| Turnout | 26,864 | 70.3 | +1.5 | ||
| Unionist hold | Swing | +6.9 | |||
| Party | Candidate | Votes | % | ± | |
|---|---|---|---|---|---|
| Unionist | Francis Fremantle | 11,968 | 47.7 | -10.1 | |
| Labour | Christopher Thomson | 6,640 | 26.5 | -15.7 | |
| Liberal | Harry Krauss Nield | 6,469 | 25.8 | N/A | |
| Majority | 5,328 | 21.2 | +5.6 | ||
| Turnout | 25,077 | 68.8 | -2.3 | ||
| Unionist hold | Swing | +2.8 | |||
| Party | Candidate | Votes | % | ± | |
|---|---|---|---|---|---|
| Unionist | Francis Fremantle | 14,594 | 57.8 | +12.0 | |
| Labour | John W. Brown | 10,662 | 42.2 | -0.2 | |
| Majority | 3,932 | 15.6 | +12.2 | ||
| Turnout | 25,256 | 71.1 | +8.3 | ||
| Unionist hold | Swing | +6.1 | |||
Elections in the 1910s
| Party | Candidate | Votes | % | ± | |
|---|---|---|---|---|---|
| C | Unionist | Francis Fremantle | 9,621 | 45.8 | N/A |
| Labour | John W. Brown | 8,908 | 42.4 | N/A | |
| Liberal | Milner Gray | 2,474 | 11.8 | N/A | |
| Majority | 713 | 3.4 | N/A | ||
| Turnout | 21,003 | 62.8 | N/A | ||
| Unionist hold | Swing | N/A | |||
| C indicates candidate endorsed by the coalition government. | |||||
| Party | Candidate | Votes | % | ± | |
|---|---|---|---|---|---|
| C | Unionist | Hildred Carlile | Unopposed | ||
| Unionist hold | |||||
| C indicates candidate endorsed by the coalition government. | |||||
| Party | Candidate | Votes | % | ± | |
|---|---|---|---|---|---|
| Conservative | Hildred Carlile | 6,899 | 59.1 | +1.0 | |
| Liberal | Robert Charles Phillimore | 4,777 | 40.9 | -1.0 | |
| Majority | 2,122 | 18.2 | +2.0 | ||
| Turnout | 11,676 | 83.8 | -6.6 | ||
| Conservative hold | Swing | +1.0 | |||
| Party | Candidate | Votes | % | ± | |
|---|---|---|---|---|---|
| Conservative | Hildred Carlile | 7,323 | 58.1 | +5.6 | |
| Liberal | Henry Roscoe Beddoes | 5,271 | 41.9 | -5.6 | |
| Majority | 2,052 | 16.2 | +11.2 | ||
| Turnout | 12,594 | 90.4 | +10.1 | ||
| Conservative hold | Swing | +5.6 | |||
Elections in the 1900s
| Party | Candidate | Votes | % | ± | |
|---|---|---|---|---|---|
| Conservative | Hildred Carlile | 5,856 | 52.5 | N/A | |
| Liberal | John Bamford Slack | 5,304 | 47.5 | N/A | |
| Majority | 552 | 5.0 | N/A | ||
| Turnout | 11,160 | 89.3 | N/A | ||
| Registered electors | 12,497 | ||||
| Conservative hold | Swing | N/A | |||
| Party | Candidate | Votes | % | ± | |
|---|---|---|---|---|---|
| Liberal | John Bamford Slack | 4,757 | 50.7 | N/A | |
| Conservative | Vicary Gibbs | 4,635 | 49.3 | N/A | |
| Majority | 132 | 1.4 | N/A | ||
| Turnout | 9,382 | 81.5 | N/A | ||
| Registered electors | 11,518 | ||||
| Liberal gain from Conservative | Swing | N/A | |||
| Party | Candidate | Votes | % | ± | |
|---|---|---|---|---|---|
| Conservative | Vicary Gibbs | Unopposed | |||
| Conservative hold | |||||
Elections in the 1890s
| Party | Candidate | Votes | % | ± | |
|---|---|---|---|---|---|
| Conservative | Vicary Gibbs | Unopposed | |||
| Conservative hold | |||||
| Party | Candidate | Votes | % | ± | |
|---|---|---|---|---|---|
| Conservative | Vicary Gibbs | 3,417 | 45.1 | N/A | |
| Liberal | Thomas Morgan Harvey[40] | 2,573 | 34.0 | N/A | |
| Ind. Conservative | William Henry Bingham-Cox | 1,580 | 20.9 | N/A | |
| Majority | 844 | 11.1 | N/A | ||
| Turnout | 7,570 | 78.3 | N/A | ||
| Registered electors | 9,672 | ||||
| Conservative hold | Swing | N/A | |||
Elections in the 1880s
| Party | Candidate | Votes | % | ± | |
|---|---|---|---|---|---|
| Conservative | James Grimston | Unopposed | |||
| Conservative hold | |||||
| Party | Candidate | Votes | % | ± | |
|---|---|---|---|---|---|
| Conservative | James Grimston | 4,108 | 57.5 | N/A | |
| Liberal | John Coles | 3,037 | 42.5 | N/A | |
| Majority | 1,071 | 15.0 | N/A | ||
| Turnout | 7,145 | 81.7 | N/A | ||
| Registered electors | 8,741 | ||||
| Conservative win (new seat) | |||||
Elections in the 1850s
On 3 May 1852, the borough was disenfranchised after a Royal Commission found proof of extensive bribery. The electorate was incorporated into Hertfordshire.[41]
| Party | Candidate | Votes | % | ± | |
|---|---|---|---|---|---|
| Whig | Jacob Bell | 276 | 65.2 | ||
| Conservative | Robert Carden | 147 | 34.8 | ||
| Majority | 129 | 30.5 | |||
| Turnout | 423 | 87.6 | |||
| Registered electors | 483 | ||||
| Whig hold | Swing | ||||
- Caused by Raphael's death
Members of Parliament
MPs 1553–1640
MPs 1640–1852
See also
Notes and references
- Notes
- ↑ A borough constituency (for the purposes of election expenses and type of returning officer)
- ↑ As with all constituencies, the constituency elects one Member of Parliament (MP) by the first past the post system of election at least every five years.
- References
- ↑ "Electorate Figures - Boundary Commission for England". 2011 Electorate Figures. Boundary Commission for England. 4 March 2011. Archived from the original on 6 November 2010. Retrieved 13 March 2011.
- ↑ "Fifth Periodical Report, Volume 1" (PDF). Boundary Commission for England. 2007. p. 335. Retrieved 21 August 2013.
- ↑ "The Parliamentary Constituencies (England) Order 2007 (S.I. 2007/1681)". legislation.gov.uk. The National Archives. Retrieved 21 August 2013.
- ↑ Reform Act 1867
- ↑ Unemployment claimants by constituency The Guardian
- ↑ Leigh Rayment's Historical List of MPs – Constituencies beginning with "S" (part 1)
- 1 2 3 4 5 6 7 8 9 10 Craig, F. W. S. (1989) [1974]. British parliamentary election results 1885–1918 (2nd ed.). Chichester: Parliamentary Research Services. p. 297. ISBN 0-900178-27-2.
- 1 2 3 4 5 6 7 8 9 10 11 Craig, F. W. S. (1983) [1969]. British parliamentary election results 1918–1949 (3rd ed.). Chichester: Parliamentary Research Services. p. 375. ISBN 0-900178-06-X.
- ↑ New M.P. For St. Albans, The Times, October 06, 1943
- ↑ "Election Data 2015". Electoral Calculus. Archived from the original on 17 October 2015. Retrieved 17 October 2015.
- ↑ "2015 Parliamentary Election Results". St Albans City and District Council. 8 May 2015. Retrieved 8 May 2015.
- ↑ "Election Data 2010". Electoral Calculus. Archived from the original on 26 July 2013. Retrieved 17 October 2015.
- ↑ City & District of St Albans - Statement of persons nominated
- ↑ "UK General Election results May 2010". Richard Kimber's Political Science Resources. Retrieved 4 February 2011.
- ↑ "Election Data 2005". Electoral Calculus. Archived from the original on 15 October 2011. Retrieved 18 October 2015.
- ↑ "UK General Election results May 2005". Richard Kimber's Political Science Resources. Retrieved 4 February 2011.
- ↑ "Election Data 2001". Electoral Calculus. Archived from the original on 15 October 2011. Retrieved 18 October 2015.
- ↑ "General Election result, June 2001". Richard Kimber's Political Science Resources. Retrieved 4 February 2011.
- ↑ "Election Data 1997". Electoral Calculus. Archived from the original on 15 October 2011. Retrieved 18 October 2015.
- ↑ "General Election result, May 1997". Richard Kimber's Political Science Resources. Retrieved 4 February 2011.
- ↑ "Election Data 1992". Electoral Calculus. Archived from the original on 15 October 2011. Retrieved 18 October 2015.
- ↑ "UK General Election results April 1992". Richard Kimber's Political Science Resources. Retrieved 4 February 2011.
- ↑ "Election Data 1987". Electoral Calculus. Archived from the original on 15 October 2011. Retrieved 18 October 2015.
- ↑ "UK General Election results 1987". Richard Kimber's Political Science Resources. Retrieved 4 February 2011.
- ↑ "Election Data 1983". Electoral Calculus. Archived from the original on 15 October 2011. Retrieved 18 October 2015.
- ↑ "UK General Election results June 1983". Richard Kimber's Political Science Resources. Retrieved 4 February 2011.
- ↑ "UK General Election results May 1979". Richard Kimber's Political Science Resources. Retrieved 4 February 2011.
- 1 2 3 "'St Albans', Feb 1974 - May 1983". ElectionWeb Project. Cognitive Computing Limited. Retrieved 4 April 2016.
- ↑ "UK General Election results October 1974". Richard Kimber's Political Science Resources. Retrieved 4 February 2011.
- ↑ "UK General Election results February 1974". Richard Kimber's Political Science Resources. Retrieved 4 February 2011.
- ↑ "UK General Election results June 1970". Richard Kimber's Political Science Resources. Retrieved 4 February 2011.
- ↑ "UK General Election results March 1966". Richard Kimber's Political Science Resources. Retrieved 4 February 2011.
- ↑ "UK General Election results October 1964". Richard Kimber's Political Science Resources. Retrieved 4 February 2011.
- ↑ "UK General Election results October 1959". Richard Kimber's Political Science Resources. Retrieved 4 February 2011.
- ↑ "UK General Election results May 1955". Richard Kimber's Political Science Resources. Retrieved 4 February 2011.
- ↑ "UK General Election results October 1951". Richard Kimber's Political Science Resources. Retrieved 4 February 2011.
- ↑ "UK General Election results February 1950". Richard Kimber's Political Science Resources. Retrieved 4 February 2011.
- ↑ For the 1945 general election, changes are calculated relative to the 1935 general election results, not the uncontested by-election in 1943
- ↑ Large Labour Vote At St. Albans, Seat Held By Coalition, The Times, Wednesday 24 December 1919, page 10
- ↑ Moore, Julie Patricia (September 2010). The Impact of Agricultural Depression and Land Ownership Change on the County of Hertfordshire, c.1870-1914 (PDF) (PhD). University of Hertfordshire. p. 214.
- 1 2 Craig, F. W. S., ed. (1977). British Parliamentary Election Results 1832-1885 (e-book)
|format=requires|url=(help) (1st ed.). London: Macmillan Press. p. 261. ISBN 978-1-349-02349-3. - 1 2 3 4 5 "History of Parliament". Retrieved 2011-10-02.
- 1 2 3 4 5 6 7 8 9 10 "History of Parliament". Retrieved 2011-10-02.
- ↑

- ↑ Admiral from 1702
- ↑ Created The Viscount Grimston (in the Peerage of Ireland), November 1719
- ↑ On petition (in a dispute over the franchise), Hale was found not to have been duly elected
- ↑ The 2nd Viscount Grimston (in the Peerage of Ireland) from October 1756
- ↑ Richard Sutton was created a baronet, 1772
- ↑ Styled Lord Bingham from October 1795, when his father was raised to an Earldom
- ↑ Kennedy, David (30 January 2018). "From Madras to Surbiton. Alexander Raphael, Unbeaton Champion, 1775–1850". Kingston History Research. Retrieved 7 July 2018.
- ↑ "St Albans". Newcastle Courant. 27 December 1850. p. 3. Retrieved 12 May 2018 – via British Newspaper Archive. (Subscription required (help)).
- ↑ "Summary". Liverpool Mercury. 27 December 1850. p. 8. Retrieved 12 May 2018 – via British Newspaper Archive. (Subscription required (help)).
- ↑ "St. Alban's Election". Northern Star and Leeds General Advertiser. 28 December 1850. p. 17. Retrieved 12 May 2018 – via British Newspaper Archive. (Subscription required (help)).
Sources
- Robert Beatson, A Chronological Register of Both Houses of Parliament (London: Longman, Hurst, Res & Orme, 1807)
- D Brunton & D H Pennington, Members of the Long Parliament (London: George Allen & Unwin, 1954)
- Cobbett's Parliamentary history of England, from the Norman Conquest in 1066 to the year 1803 (London: Thomas Hansard, 1808)
- F W S Craig, British Parliamentary Election Results 1832-1885 (2nd edition, Aldershot: Parliamentary Research Services, 1989)
- Henry Stooks Smith, The Parliaments of England from 1715 to 1847 (2nd edition, edited by FWS Craig - Chichester: Parliamentary Reference Publications, 1973)
- Leigh Rayment's Historical List of MPs – Constituencies beginning with "S" (part 1)
External links
- 2005 voting statistics from the BBC
- 2001 and 1997 voting statistics from the BBC
- OBV
- Coverage from The Times