Hastings and Rye (UK Parliament constituency)
Coordinates: 50°54′36″N 0°39′25″E / 50.910°N 0.657°E
| Hastings and Rye | |
|---|---|
|
County constituency for the House of Commons | |
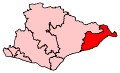 Boundary of Hastings and Rye in East Sussex. | |
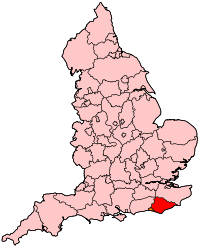 Location of East Sussex within England. | |
| County | East Sussex |
| Electorate | 76,422 (December 2010)[1] |
| Current constituency | |
| Created | 1983 |
| Member of parliament | Amber Rudd (Conservative) |
| Number of members | One |
| Created from | Hastings, Rye |
| Overlaps | |
| European Parliament constituency | South East England |
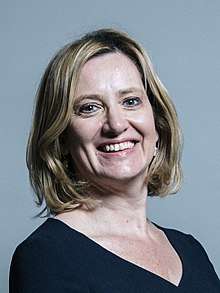
Hastings and Rye is a constituency[n 1] represented in the House of Commons of the UK Parliament since 2010 by Amber Rudd, a Conservative.[n 2] Rudd was Home Secretary in Theresa May's Cabinet from 2016 until her resignation in April 2018.
Boundaries
1983–2010: The Borough of Hastings, and the District of Rother wards of Camber, Fairlight, Guestling and Pett, Rye, and Winchelsea.
2010–present: The Borough of Hastings, and the District of Rother wards of Brede Valley, Eastern Rother, Marsham, and Rye.
Constituency profile
As its name suggests, the main settlements in the constituency are the seaside resort of Hastings and smaller nearby tourist town of Rye. The constituency also includes the Cinque Port of Winchelsea and the villages of Fairlight, Winchelsea Beach, Three Oaks, Guestling, Icklesham, Playden, Iden, Rye Harbour, East Guldeford, Camber, and Pett.
The constituency is set in a relatively isolated part of the southeast from the railways perspective and so does not enjoy some of the more general affluence of this part of the country. In the 2000 index of multiple deprivation a majority of wards fell within the bottom half of rankings so it can arguably be considered a deprived area.[2] Hastings has some light industry, while Rye has a small port, which includes hire and repair activities for leisure vessels and fishing. Hastings is mostly Labour-voting, whereas Rye and the rest of the areas from Rother council are Conservative.
History
The constituency was created in 1983 by combining most of Hastings with a small part of Rye. The Conservative MP for Hastings since 1970, Kenneth Warren, won the new seat.[n 3]. Warren held Hastings and Rye until he chose to retire in 1992; during this period its large majorities suggest it was a Conservative safe seat, with the Liberal Party (now the Liberal Democrats) regularly coming second. Jacqui Lait won the seat on Warren's retirement, but in 1997 the Labour candidate Michael Foster narrowly defeated Lait, becoming the second-least expected (on swing) Labour MP in the landslide of that year and since 2001 setting a pattern that suggests the seat is a two-way Labour-Conservative marginal.[n 4] Foster held the seat, again with slim majorities over Conservatives, in 2001 and 2005, but lost it to Conservative Amber Rudd in 2010. Rudd was re-elected with an increased majority in 2015.
In the 2017 general election, the Green Party declined to contest the seat and instead called on its supporters to back the Labour candidate.[3] In the event, Rudd held on to the seat, but only by just over 300 votes, making the seat a very closely fought marginal between the two main parties again.
Elections
| Election | Member[4] | Party | Notes | |
|---|---|---|---|---|
| 1983 | Kenneth Warren | Conservative | ||
| 1992 | Jacqui Lait | Conservative | ||
| 1997 | Michael Foster | Labour | ||
| 2010 | Amber Rudd | Conservative | Home Secretary (2016-2018) Minister for Women and Equalities (2018) | |
Elections in the 2010s
| Party | Candidate | Votes | % | ± | |
|---|---|---|---|---|---|
| Conservative | Amber Rudd | 25,668 | 46.9 | ||
| Labour | Peter Chowney | 25,322 | 46.2 | ||
| Liberal Democrat | Nick Perry | 1,885 | 3.4 | ||
| UKIP | Michael Phillips | 1,479 | 2.7 | ||
| Independent | Nicholas Wilson | 412 | 0.8 | New | |
| Majority | 346 | 0.7 | |||
| Turnout | 52,881 | 69.9 | |||
| Conservative hold | Swing | ||||
| Party | Candidate | Votes | % | ± | |
|---|---|---|---|---|---|
| Conservative | Amber Rudd | 22,686 | 44.5 | +3.4 | |
| Labour | Sarah Owen | 17,890 | 35.1 | −2.0 | |
| UKIP | Andrew Michael | 6,786 | 13.3 | +10.5 | |
| Green | Jake Bowers | 1,951 | 3.8 | +3.8 | |
| Liberal Democrat | Nick Perry | 1,614 | 3.2 | −12.5 | |
| Majority | 4,796 | 9.4 | +5.4 | ||
| Turnout | 50,927 | 68.0 | +4.1 | ||
| Conservative hold | Swing | +2.7 | |||
| Party | Candidate | Votes | % | ± | |
|---|---|---|---|---|---|
| Conservative | Amber Rudd | 20,468 | 41.1 | +3.0 | |
| Labour | Michael Foster | 18,475 | 37.1 | −3.5 | |
| Liberal Democrat | Nick Perry | 7,825 | 15.7 | +0.6 | |
| UKIP | Anthony Smith | 1,397 | 2.8 | +0.1 | |
| BNP | Nick Prince | 1,310 | 2.6 | +2.6 | |
| English Democrat | Rod Bridger | 339 | 0.7 | +0.7 | |
| Majority | 1,993 | 4.0 | |||
| Turnout | 49,814 | 63.9 | +4.9 | ||
| Conservative gain from Labour | Swing | +3.3 | |||
Elections in the 2000s
| Party | Candidate | Votes | % | ± | |
|---|---|---|---|---|---|
| Labour | Michael Foster | 18,107 | 42.1 | −5.0 | |
| Conservative | Mark Coote | 16,081 | 37.4 | +0.8 | |
| Liberal Democrat | Richard Stevens | 6,479 | 15.1 | +4.8 | |
| UKIP | Terry Grant | 1,098 | 2.6 | +0.4 | |
| Green | Sally Phillips | 1,032 | 2.4 | +0.7 | |
| Monster Raving Loony | Viscount Clarkey of Rochdale Canal Ord-Clarke | 207 | 0.5 | 0.0 | |
| Majority | 2,026 | 4.7 | |||
| Turnout | 43,004 | 59.1 | +0.8 | ||
| Labour hold | Swing | -2.9 | |||
| Party | Candidate | Votes | % | ± | |
|---|---|---|---|---|---|
| Labour | Michael Foster | 19,402 | 47.1 | +12.7 | |
| Conservative | Mark Coote | 15,094 | 36.6 | +7.5 | |
| Liberal Democrat | Graem Peters | 4,266 | 10.3 | −17.6 | |
| UKIP | Alan Coomber | 911 | 2.2 | +1.2 | |
| Green | Sally Phillips | 721 | 1.7 | N/A | |
| Independent | Gillian Bargery | 486 | 1.2 | N/A | |
| Monster Raving Loony | John Ord-Clarke | 198 | 0.5 | +0.2 | |
| Rock 'n' Roll Loony | Brett McLean | 140 | 0.3 | N/A | |
| Majority | 4,308 | 10.5 | |||
| Turnout | 41,218 | 58.4 | -11.3 | ||
| Labour hold | Swing | +2.6 | |||
Elections in the 1990s
| Party | Candidate | Votes | % | ± | |
|---|---|---|---|---|---|
| Labour | Michael Foster | 16,867 | 34.4 | +18.6 | |
| Conservative | Jacqui Lait | 14,307 | 29.2 | -18.4 | |
| Liberal Democrat | Monroe Palmer | 13,717 | 28.0 | −7.3 | |
| Referendum | Christopher J.M. McGovern | 2,511 | 5.1 | N/A | |
| Liberal | Jane M.E. Amstad | 1,046 | 2.1 | N/A | |
| UKIP | W.N. Andrews | 472 | 1.0 | N/A | |
| Monster Raving Loony | Derek Tiverton | 149 | 0.3 | 0.0 | |
| Majority | 2,560 | 5.2 | |||
| Turnout | 49,069 | 69.7 | −5.2 | ||
| Labour gain from Conservative | Swing | +18.5 | |||
| Party | Candidate | Votes | % | ± | |
|---|---|---|---|---|---|
| Conservative | Jacqui Lait | 25,573 | 47.6 | −2.5 | |
| Liberal Democrat | Monroe Palmer | 18,939 | 35.2 | −0.8 | |
| Labour | Richard D. Stevens | 8,458 | 15.7 | +2.6 | |
| Green | Sally Philips | 640 | 1.2 | N/A | |
| Monster Raving Loony | Lord of Howell Derek Tiverton | 168 | 0.3 | −0.1 | |
| Majority | 6,634 | 12.4 | |||
| Turnout | 53,778 | 74.9 | +3.1 | ||
| Conservative hold | Swing | −0.9 | |||
Elections in the 1980s
| Party | Candidate | Votes | % | ± | |
|---|---|---|---|---|---|
| Conservative | Kenneth Warren | 26,163 | 50.1 | −3.2 | |
| Liberal | David Amies | 18,816 | 36.0 | +5.5 | |
| Labour | Joy Hurcombe | 6,825 | 13.1 | −2.1 | |
| Monster Raving Loony | Lord of Howell Derek Tiverton | 242 | 0.4 | N/A | |
| Independent | Stanley Davies | 194 | 0.4 | N/A | |
| Majority | 7,347 | 14.1 | |||
| Turnout | 52,240 | 71.8 | +2.9 | ||
| Conservative hold | Swing | −4.4 | |||
| Party | Candidate | Votes | % | ± | |
|---|---|---|---|---|---|
| Conservative | Kenneth Warren | 25,626 | 53.3 | N/A | |
| Liberal | David Amies | 14,646 | 30.5 | N/A | |
| Labour | N. Knowles | 7,304 | 15.2 | N/A | |
| Independent | G.L. McNally | 503 | 1.0 | N/A | |
| Majority | 10,980 | 22.8 | N/A | ||
| Turnout | 48,079 | 68.9 | N/A | ||
| Conservative win (new seat) | |||||
See also
Notes
- ↑ A county constituency (for the purposes of election expenses and type of returning officer)
- ↑ As with all constituencies, the constituency elects one Member of Parliament (MP) by the first past the post system of election at least every five years.
- ↑ The Conservative MP for the abolished seat of Rye (since 1955) Bryant Godman Irvine retired
- ↑ Since 2001 Liberal Democrat candidates' greatest share of the vote has been 15.7%. In other words, in the latest three elections they have achieved a relatively distant third place.
References
- ↑ "Electorate Figures – Boundary Commission for England". 2011 Electorate Figures. Boundary Commission for England. 4 March 2011. Archived from the original on 6 November 2010. Retrieved 13 March 2011.
- ↑ "Local statistics". Office for National Statistics.
- ↑ Labour say they have 'every chance of winning' Home Secretary Amber Rudd's seat
- ↑ Leigh Rayment's Historical List of MPs – Constituencies beginning with "H" (part 2)
- ↑ "Election Data 2015". Electoral Calculus. Archived from the original on 17 October 2015. Retrieved 17 October 2015.
- ↑ "08 May 2015 Parliamentary Election – Results". council web site. Hastings Borough Council. Archived from the original on 18 May 2015. Retrieved 8 May 2015.
- ↑ "Election Data 2010". Electoral Calculus. Archived from the original on 26 July 2013. Retrieved 17 October 2015.
- ↑ "Official announcements from Hastings council". Archived from the original on 2011-06-10.
- ↑ "Election Data 2005". Electoral Calculus. Archived from the original on 15 October 2011. Retrieved 18 October 2015.
- ↑ "Election Data 2001". Electoral Calculus. Archived from the original on 15 October 2011. Retrieved 18 October 2015.
- ↑ "Election Data 1997". Electoral Calculus. Archived from the original on 15 October 2011. Retrieved 18 October 2015.
- ↑ "Election Data 1992". Electoral Calculus. Archived from the original on 15 October 2011. Retrieved 18 October 2015.
- ↑ "Politics Resources". Election 1992. Politics Resources. 9 April 1992. Retrieved 2010-12-06.
- ↑ "Election Data 1987". Electoral Calculus. Archived from the original on 15 October 2011. Retrieved 18 October 2015.
- ↑ "Election Data 1983". Electoral Calculus. Archived from the original on 15 October 2011. Retrieved 18 October 2015.
Sources
- Election result, 2005 (BBC)
- Election results, 1997 – 2001 (BBC)
- Election results, 1997 – 2001 (Election Demon)
- Election results, 1983 – 1992 (Election Demon)
- Election results, 1992 – 2005 (Guardian)