Luton North (UK Parliament constituency)
Coordinates: 51°54′07″N 0°26′46″W / 51.902°N 0.446°W
| Luton North | |
|---|---|
|
Borough constituency for the House of Commons | |
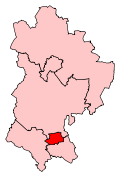 Boundary of Luton North in Bedfordshire. | |
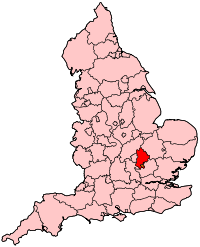 Location of Bedfordshire within England. | |
| County | Bedfordshire |
| Electorate | 66,273 (December 2010)[1] |
| Major settlements | Luton |
| Current constituency | |
| Created | 1983 |
| Member of parliament | Kelvin Hopkins (Independent) |
| Number of members | One |
| Created from | Luton West, Mid Bedfordshire, South Bedfordshire and Luton East[2] |
| Overlaps | |
| European Parliament constituency | East of England |
Luton North is a constituency[n 1] represented in the House of Commons of the UK Parliament since 1997 by Kelvin Hopkins, elected as a member of the Labour Party. In November 2017, Hopkins was suspended from the Labour Party due to allegations of sexual misconduct, thus he currently sits as an Independent.[3][n 2]
Boundaries
1983-1997: The Borough of Luton wards of Bramingham, Challney, Icknield, Leagrave, Lewsey, Limbury, and Sundon Park, the District of Mid Bedfordshire wards of Flitton and Pulloxhill, Flitwick East, Flitwick West, Harlington, and Westoning, and the District of South Bedfordshire wards of Barton-le-Clay, Streatley, and Toddington.
1997-2010: The Borough of Luton wards of Bramingham, Challney, Icknield, Leagrave, Lewsey, Limbury, Saints, and Sundon Park.
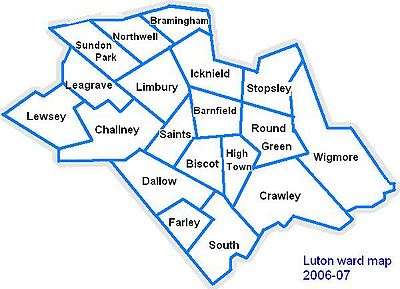
2010–present: The Borough of Luton wards of Barnfield, Bramingham, Challney, Icknield, Leagrave, Lewsey, Limbury, Northwell, Saints, and Sundon Park.
Luton North was created in 1983, primarily from the former seat of Luton West. It consists of the northern portion of the town of Luton, excluding Stopsley.
Constituency profile
One other constituency than Luton North includes Luton — Luton South — both cover a similar housing profile[n 3][4] and economic ambit that have seen house prices increase above the national average since 1997, two periods of relatively high numbers of the unemployed and lowest wage earners (the 1990s and 2008–2011 global recession).[5] The former covers roughly the LU3 and 4 postcode districts and excludes the town centre of what one broadsheet characterised as a tough town[6] whereas other commentators state that Luton has a resilient economy which "revolves around the airport as well as the retail sector."[7]
At creation, Luton North included eight wards from the neighbouring districts of Mid Bedfordshire and South Bedfordshire; these made it a much safer seat for the Conservatives than Luton South, which included only one ward from outside the Borough of Luton. Boundary changes in 1997 reduced the Conservative majority from 13,094 to 7,357, and it was 81st on Labour's list of target seats; Labour duly gained it on a 17.1% swing, and since then the Labour MP elected in 1997, Kelvin Hopkins, has held the seat with comfortable majorities.
From 2005 to 2015, Luton North was Labour's safest seat in the East of England by both vote and voteshare majority; in 2017 it was overtaken in the former count by Norwich South, but the percentage margin in Luton North (30.8% compared to 30.4% in Norwich South) is slightly higher.
Members of Parliament
| Election | Member[8] | Party | |
|---|---|---|---|
| 1983 | John Carlisle | Conservative | |
| 1997 | Kelvin Hopkins | Labour | |
| 2017 | Independent | ||
Elections
Elections in the 2010s
| Party | Candidate | Votes | % | ± | |
|---|---|---|---|---|---|
| Labour | Kelvin Hopkins | 29,765 | 63.8 | +11.6 | |
| Conservative | Caroline Kerswell | 15,401 | 33.0 | +3.1 | |
| Liberal Democrat | Rabi Martins | 808 | 1.7 | -1.3 | |
| Green | Simon Hall | 648 | 1.4 | -0.9 | |
| Majority | 14,364 | 30.8 | +8.5 | ||
| Turnout | 46,622 | 71.0 | +7.0 | ||
| Labour hold | Swing | +4.3 | |||
| Party | Candidate | Votes | % | ± | |
|---|---|---|---|---|---|
| Labour | Kelvin Hopkins[10] | 22,243 | 52.2 | +2.9 | |
| Conservative | Dean Russell[11] | 12,739 | 29.9 | −1.9 | |
| UKIP | Allan White[11] | 5,318 | 12.5 | +8.9 | |
| Liberal Democrat | Aroosa Ulzaman | 1,299 | 3.1 | −8.1 | |
| Green | Sofiya Ahmed | 972 | 2.3 | +1.1 | |
| Majority | 9,504 | 22.3 | +4.8 | ||
| Turnout | 42,571 | 64.0 | −1.5 | ||
| Labour hold | Swing | +2.4 | |||
| Party | Candidate | Votes | % | ± | |
|---|---|---|---|---|---|
| Labour | Kelvin Hopkins | 21,192 | 49.3 | +0.7 | |
| Conservative | Jeremy Brier | 13,672 | 31.8 | −0.4 | |
| Liberal Democrat | Rabi Martins | 4,784 | 11.1 | −4.5 | |
| UKIP | Colin Brown | 1,564 | 3.6 | +0.4 | |
| BNP | Shelley Rose | 1,316 | 3.1 | N/A | |
| Green | Simon Hall | 490 | 1.1 | N/A | |
| Majority | 7,520 | 17.5 | +0.9 | ||
| Turnout | 43,018 | 65.5 | +8.6 | ||
| Labour hold | Swing | +0.5 | |||
Elections in the 2000s
| Party | Candidate | Votes | % | ± | |
|---|---|---|---|---|---|
| Labour | Kelvin Hopkins | 19,062 | 48.7 | −8.0 | |
| Conservative | Hannah S. Hall | 12,575 | 32.1 | +0.9 | |
| Liberal Democrat | Linda A. Jack | 6,081 | 15.5 | +5.8 | |
| UKIP | Colin Brown | 1,255 | 3.2 | +0.8 | |
| Open Forum | Kayson J. Gurney | 149 | 0.4 | N/A | |
| Majority | 6,487 | 16.6 | -8.9 | ||
| Turnout | 39,122 | 57.4 | −0.5 | ||
| Labour hold | Swing | −4.5 | |||
| Party | Candidate | Votes | % | ± | |
|---|---|---|---|---|---|
| Labour | Kelvin Hopkins | 22,187 | 56.7 | +2.1 | |
| Conservative | Amanda Sater | 12,210 | 31.2 | −3.1 | |
| Liberal Democrat | Robert C.H. Hoyle | 3,795 | 9.7 | +0.6 | |
| UKIP | Colin Brown | 934 | 2.4 | +0.9 | |
| Majority | 9,977 | 25.5 | +5.2 | ||
| Turnout | 39,126 | 57.9 | −15.3 | ||
| Labour hold | Swing | ||||
Elections in the 1990s
| Party | Candidate | Votes | % | ± | |
|---|---|---|---|---|---|
| Labour | Kelvin Hopkins | 25,860 | 54.6 | +17.4 | |
| Conservative | David Senior | 16,234 | 34.3 | −16.9 | |
| Liberal Democrat | Kathryn Newbound | 4,299 | 9.1 | −1.1 | |
| UKIP | Colin Brown | 689 | 1.5 | N/A | |
| Natural Law | Aaron Custance | 250 | 0.5 | +0.0 | |
| Majority | 9,626 | 20.3 | N/A | ||
| Turnout | 47,332 | 73.2 | -8.6 | ||
| Labour gain from Conservative | Swing | ||||
| Party | Candidate | Votes | % | ± | |
|---|---|---|---|---|---|
| Conservative | John Carlisle | 33,777 | 53.7 | −0.2 | |
| Labour | Tony McWalter | 20,683 | 32.9 | +6.1 | |
| Liberal Democrat | Jane Jackson | 7,570 | 12.0 | −7.4 | |
| Green | Roger Jones | 633 | 1.0 | N/A | |
| Natural Law | Keith Buscombe | 292 | 0.5 | N/A | |
| Majority | 13,094 | 20.8 | −6.2 | ||
| Turnout | 62,955 | 81.8 | +4.2 | ||
| Conservative hold | Swing | −3.1 | |||
Elections in the 1980s
| Party | Candidate | Votes | % | ± | |
|---|---|---|---|---|---|
| Conservative | John Carlisle | 30,997 | 53.8 | +5.5 | |
| Labour | Michael Wright | 15,424 | 26.8 | +0.6 | |
| Social Democratic | John Stephen | 11,166 | 19.4 | −6.1 | |
| Majority | 15,573 | 27.0 | +4.8 | ||
| Turnout | 57,587 | 77.6 | +0.2 | ||
| Conservative hold | Swing | ||||
| Party | Candidate | Votes | % | ± | |
|---|---|---|---|---|---|
| Conservative | John Carlisle | 26,115 | 48.3 | N/A | |
| Labour | Kelvin Hopkins | 14,134 | 26.2 | N/A | |
| Social Democratic | John Stephen | 13,769 | 25.5 | N/A | |
| Majority | 11,981 | 22.2 | N/A | ||
| Turnout | 54,018 | 77.4 | N/A | ||
| Conservative win (new seat) | |||||
See also
Notes and references
- Notes
- ↑ A borough constituency (for the purposes of election expenses and type of returning officer)
- ↑ As with all constituencies, the constituency elects one Member of Parliament (MP) by the first past the post system of election at least every five years.
- ↑ The proportion of semi-detached houses is in the highest of the five categories, similar to London Borough of Havering, London Borough of Bexley, Castle Point and Ipswich only surpassed in the east/southeast by Rochford
- References
- ↑ "Electorate Figures – Boundary Commission for England". 2011 Electorate Figures. Boundary Commission for England. 4 March 2011. Archived from the original on 6 November 2010. Retrieved 13 March 2011.
- ↑ "'Luton North', June 1983 up to May 1997". ElectionWeb Project. Cognitive Computing Limited. Archived from the original on 13 March 2016. Retrieved 12 March 2016.
- ↑ Kentish, Ben (2 November 2017). "Labour suspends MP Kelvin Hopkins amid allegations of sexual harassment". The Independent. London. Retrieved 2 November 2017.
- ↑ 2011 census interactive maps Archived 29 January 2016 at the Wayback Machine.
- ↑ "Local statistics - Office for National Statistics". neighbourhood.statistics.gov.uk.
- ↑ "Politics". the Guardian.
- ↑ "Area and Property Guide for lu3 - Mouseprice". www.mouseprice.com.
- ↑ Leigh Rayment's Historical List of MPs – Constituencies beginning with "L" (part 4)
- ↑ "Election Data 2015". Electoral Calculus. Archived from the original on 17 October 2015. Retrieved 17 October 2015.
- ↑ "LUTON NORTH 2015". electionresults.blogspot.co.uk.
- 1 2 "UK Polling Report". ukpollingreport.co.uk.
- ↑ "Election Data 2010". Electoral Calculus. Archived from the original on 26 July 2013. Retrieved 17 October 2015.
- ↑ "Election Data 2005". Electoral Calculus. Archived from the original on 15 October 2011. Retrieved 18 October 2015.
- ↑ "Election Data 2001". Electoral Calculus. Archived from the original on 15 October 2011. Retrieved 18 October 2015.
- ↑ "Election Data 1997". Electoral Calculus. Archived from the original on 15 October 2011. Retrieved 18 October 2015.
- ↑ "Election Data 1992". Electoral Calculus. Archived from the original on 15 October 2011. Retrieved 18 October 2015.
- ↑ "Politics Resources". Election 1992. Politics Resources. 9 April 1992. Retrieved 6 December 2010.
- ↑ "Election Data 1987". Electoral Calculus. Archived from the original on 15 October 2011. Retrieved 18 October 2015.
- ↑ "Election Data 1983". Electoral Calculus. Archived from the original on 15 October 2011. Retrieved 18 October 2015.