Manchester Gorton (UK Parliament constituency)
| Manchester, Gorton | |
|---|---|
|
Borough constituency for the House of Commons | |
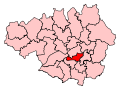 Boundary of Manchester Gorton in Greater Manchester in 2010. | |
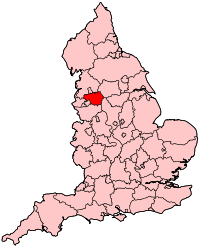 Location of Greater Manchester within England. | |
| County | Greater Manchester |
| Electorate | 74,681 (December 2010)[1] |
| Current constituency | |
| Created | 1918 |
| Member of parliament | Afzal Khan (Labour) |
| Number of members | One |
| Overlaps | |
| European Parliament constituency | North West England |
| South East Lancashire Gorton | |
|---|---|
|
Former County constituency for the House of Commons | |
| 1885–1918 | |
| Number of members | one |
| Created from | South East Lancashire |
Manchester Gorton is a constituency[n 1] represented in the House of Commons of the UK Parliament by Labour's Afzal Khan, who was elected at the 2017 general election.
History
The Redistribution of Seats Act 1885 divided the existing seat of South East Lancashire into eight single-member constituencies, an Act which significantly increased representation across Britain.
Manchester Gorton has returned MPs from the Labour Party since 1935, with majorities exceeding 17% since 1979. The 2015 general election result made the seat the eighth-safest of Labour's 232 seats by percentage of majority.[2]
From 1983-2017, Sir Gerald Kaufman, Father of the House of Commons, represented the constituency. His death in February 2017 triggered a by-election which was due to be held on 4 May 2017, but this was subsequently countermanded (that is, cancelled) after the House of Commons voted for a snap general election to be held on 8 June 2017.[3][n 2] At that election, the Conservatives returned their lowest vote share for any seat in Great Britain, at 7.3%.[4]
Historic boundaries
1885–1918
South-East Lancashire, Gorton Division consisted of the area of the Gorton Local Board and the townships or parishes of Denton, Haughton, and Openshaw. The constituency comprised an area bounded on the west by the city of Manchester and to the east and south by the county boundary with Cheshire.[5] In 1890, Manchester's municipal boundaries were extended to include Gorton and Openshaw, although constituency boundaries remained unchanged until 1918.[6]
1918–1950
The Representation of the People Act 1918 reorganised parliamentary seats throughout Great Britain. The redistribution reflected the boundary changes of 1890, with Gorton becoming a division of the parliamentary borough of Manchester. The Manchester, Gorton Division comprised three wards of the county borough of Manchester: Gorton North, Gorton South and Openshaw. Denton and Haughton, which together had formed Denton Urban District in 1894, were transferred to the Mossley Division of Lancashire.[6][7]
1950–1955
The next redrawing of English constituencies was effected by the Representation of the People Act 1948. The Act introduced the term "borough constituency", with Manchester Gorton Borough Constituency now consisting of four wards of the city: Gorton North, Gorton South, Levenshulme and Openshaw.[8] Levenshulme was transferred from the abolished Manchester Rusholme seat.[6] The revised boundaries were first used at the 1950 general election.
1955–1983
In 1955 boundary changes were made based on the recommendations of the Boundary Commission appointed under the House of Commons (Redistribution of Seats) Act 1949. The constituency was redefined as consisting of the Gorton North and Gorton South wards of the county borough and the two neighbouring urban districts of Audenshaw and Denton in the administrative county of Lancashire. Levenshulme passed to Manchester Withington while Openshaw formed the core of a new Manchester Openshaw seat.[9]
1983–2010
The 1983 redistribution of seats reflected local government reforms made in 1974. Manchester Gorton became a borough constituency in the parliamentary county of Greater Manchester. The constituency was redefined as comprising six wards of the Metropolitan district and City of Manchester, namely: Fallowfield, Gorton North, Gorton South, Levenshulme, Longsight and Rusholme.[10] The constituency was unaltered at the next redistribution prior to the 1997 general election.[11]
2010–2018
From the Fifth Periodic Review of Westminster constituencies the seat had wards (since the 2010 general election) of: Fallowfield, Gorton North, Gorton South, Levenshulme, Longsight, Rusholme and Whalley Range.[12]
Boundaries
_2018.png)
From the boundary review by the Local Government Boundary Commission for England (LGBCE) the previous electoral wards of Gorton North and Gorton South were merged to create a new ward, Gorton and Abbey Hey.[13]
The list of wards for the local elections 2018 onwards are: Fallowfield, Gorton and Abbey Hey, Levenshulme, Longsight, Rusholme and Whalley Range.[13]
Members of Parliament
| Year | Member[14] | Party | Notes | |
|---|---|---|---|---|
| 1885 | Richard Peacock | Liberal | ||
| 1889 by-election | William Mather | Liberal | ||
| 1895 | Ernest Hatch | Conservative | ||
| 1905–Mr Hatch crossed floor[15] | Liberal | |||
| 1906 | John Hodge | Labour | ||
| 1923 | Joseph Compton | Labour | ||
| 1931 | Eric Bailey | Conservative | ||
| 1935 | Joseph Compton | Labour | ||
| 1937 by-election | William Wedgewood Benn | Labour | ||
| 1942 by-election | William Oldfield | Labour | ||
| 1955 | Konni Zilliacus | Labour | ||
| 1967 by-election | Kenneth Marks | Labour | ||
| 1983 | Sir Gerald Kaufman | Labour | Died February 2017; by-election was called, but countermanded due to snap general election. | |
| 2017 | Afzal Khan | Labour | Shadow Immigration Minister | |
Elections
Elections in the 2010s
| Party | Candidate | Votes | % | ± | |
|---|---|---|---|---|---|
| Labour | Afzal Khan | 35,085 | 76.3 | ||
| Conservative | Shaden Jaradat | 3,355 | 7.3 | ||
| Independent | George Galloway | 2,615 | 5.7 | N/A | |
| Liberal Democrat | Jackie Pearcey | 2,597 | 5.7 | ||
| Green | Jess Mayo | 1,038 | 2.3 | ||
| UKIP | Phil Eckersley | 952 | 2.1 | ||
| Christian Peoples | Kemi Abidogun | 233 | 0.5 | N/A | |
| Independent | David Hopkins | 51 | 0.1 | N/A | |
| Communist League | Peter Clifford | 27 | 0.1 | N/A | |
| Majority | 31,730 | 69.0 | |||
| Turnout | 45,953 | 61.0 | |||
| Labour hold | Swing | ||||
These are the same as the candidates who were to stand at the cancelled 2017 by-election, except for an Official Monster Raving Loony Party candidate and another independent, who did not stand at the general election.
| Party | Candidate | Votes | % | ± | |
|---|---|---|---|---|---|
| Labour | Gerald Kaufman | 28,187 | 67.1 | +17.0 | |
| Green | Laura Bannister | 4,108 | 9.8 | +7.0 | |
| Conservative | Mohammed Afzal | 4,063 | 9.7 | -1.4 | |
| UKIP | Phil Eckersley | 3,434 | 8.2 | N/A | |
| Liberal Democrat | Dave Page | 1,782 | 4.2 | -28.4 | |
| TUSC | Simon Hickman | 264 | 0.6 | -0.3 | |
| Pirate | Cris Chesha | 181 | 0.4 | -0.2 | |
| Majority | 24,079 | 57.3 | +39.8 | ||
| Turnout | 42,019 | 57.6 | +7.1 | ||
| Labour hold | Swing | +5.0 | |||
| Party | Candidate | Votes | % | ± | |
|---|---|---|---|---|---|
| Labour | Gerald Kaufman | 19,211 | 50.1 | −3.0 | |
| Liberal Democrat | Qassim Afzal | 12,508 | 32.6 | −0.9 | |
| Conservative | Caroline Healy | 4,224 | 11.0 | +1.2 | |
| Green | Justine Hall | 1,048 | 2.7 | N/A | |
| Respect | Mohammed Zulfikar | 507 | 1.3 | N/A | |
| TUSC | Karen Reissman | 337 | 0.9 | N/A | |
| Christian | Peter Harrison | 254 | 0.7 | N/A | |
| Pirate | Tim Dobson | 236 | 0.6 | N/A | |
| Majority | 6,703 | 17.5 | −2.1 | ||
| Turnout | 38,325 | 50.5 | +4.7 | ||
| Labour hold | Swing | −1.1 | |||
Elections in the 2000s
| Party | Candidate | Votes | % | ± | |
|---|---|---|---|---|---|
| Labour | Gerald Kaufman | 15,480 | 53.2 | −9.6 | |
| Liberal Democrat | Qassim Afzal | 9,672 | 33.2 | +11.9 | |
| Conservative | Amanda Byrne | 2,848 | 9.8 | −0.1 | |
| UKIP | Gregg Beaman | 783 | 2.7 | +1.0 | |
| Workers Revolutionary | Dan Waller | 181 | 0.6 | N/A | |
| Resolutionist Party | Matthew Kay | 159 | 0.5 | N/A | |
| Majority | 5,808 | 19.9 | |||
| Turnout | 29,123 | 45.0 | +2.3 | ||
| Labour hold | Swing | −10.8 | |||
| Party | Candidate | Votes | % | ± | |
|---|---|---|---|---|---|
| Labour | Gerald Kaufman | 17,099 | 62.8 | −2.5 | |
| Liberal Democrat | Jacqueline M. Pearcey | 5,795 | 21.3 | +3.8 | |
| Conservative | Christopher Causer | 2,705 | 9.9 | −1.8 | |
| Green | Bruce Bingham | 835 | 3.1 | +2.2 | |
| UKIP | Rashid Bhatti | 462 | 1.7 | N/A | |
| Socialist Labour | Kirsty Muir | 333 | 1.2 | −0.2 | |
| Majority | 11,304 | 41.5 | |||
| Turnout | 42.7 | −12.9 | |||
| Labour hold | Swing | ||||
Elections in the 1990s
Changes in vote compared with notional figures for 1997 election following boundary changes.
| Party | Candidate | Votes | % | ± | |
|---|---|---|---|---|---|
| Labour | Gerald Kaufman | 23,704 | 65.3 | +2.9 | |
| Liberal Democrat | Jackie Pearcey | 6,362 | 17.5 | +3.5 | |
| Conservative | Guy Senior | 4,249 | 11.7 | −7.8 | |
| Referendum | Kevin Hartley | 812 | 2.2 | N/A | |
| Green | Spencer FitzGibbon | 683 | 1.9 | +0.3 | |
| Socialist Labour | Trevor Wongsam | 501 | 1.4 | N/A | |
| Majority | 17,342 | 47.8 | |||
| Turnout | 36,311 | 55.6 | −5.2 | ||
| Labour hold | Swing | ||||
| Party | Candidate | Votes | % | ± | |
|---|---|---|---|---|---|
| Labour | Gerald Kaufman | 23,671 | 62.3 | +7.9 | |
| Conservative | Jonathan Bullock | 7,392 | 19.5 | −3.8 | |
| Liberal Democrat | Phil Harris | 5,327 | 14.0 | −7.7 | |
| Liberal | Terry Henderson | 767 | 2.0 | −19.7 | |
| Green | Mike Daw | 595 | 1.6 | N/A | |
| Revolutionary Communist | Pam Lawrence | 108 | 0.3 | N/A | |
| Natural Law | Philip D. Mitchell | 84 | 0.2 | N/A | |
| International Communist | Colleen E. Smith | 30 | 0.1 | N/A | |
| Majority | 16,279 | 42.9 | +11.8 | ||
| Turnout | 37,974 | 60.8 | −9.6 | ||
| Labour hold | Swing | +5.9 | |||
Elections in the 1980s
| Party | Candidate | Votes | % | ± | |
|---|---|---|---|---|---|
| Labour | Gerald Kaufman | 24,615 | 54.40 | ||
| Conservative | John Kershaw | 10,550 | 23.32 | ||
| Liberal | Keith Whitmore | 9,830 | 21.72 | ||
| Red Front | Pam Lawrence | 253 | 0.56 | ||
| Majority | 14,065 | 31.08 | |||
| Turnout | 70.43 | ||||
| Labour hold | Swing | ||||
| Party | Candidate | Votes | % | ± | |
|---|---|---|---|---|---|
| Labour | Gerald Kaufman | 22,460 | 51.20 | ||
| Conservative | John Kershaw | 12,495 | 28.48 | ||
| Liberal | Keith Whitmore | 8,348 | 19.03 | ||
| Communist | Malcolm Cowle | 333 | 0.76 | ||
| BNP | Leslie Andrews | 231 | 0.53 | ||
| Majority | 9,965 | 22.72 | |||
| Turnout | 67.86 | ||||
| Labour hold | Swing | ||||
Elections in the 1970s
| Party | Candidate | Votes | % | ± | |
|---|---|---|---|---|---|
| Labour | Kenneth Marks | 22,293 | 53.54 | ||
| Conservative | Michael Lord | 16,009 | 38.45 | ||
| Liberal | Graham Shaw | 2,867 | 6.89 | ||
| National Front | Richard Chadfield | 469 | 1.13 | ||
| Majority | 6,284 | 15.09 | |||
| Turnout | 77.19 | ||||
| Labour hold | Swing | ||||
| Party | Candidate | Votes | % | ± | |
|---|---|---|---|---|---|
| Labour | Kenneth Marks | 21,287 | 53.63 | ||
| Conservative | Stephen Waley-Cohen | 12,423 | 31.30 | ||
| Liberal | A. Cottam | 5,984 | 15.08 | ||
| Majority | 8,864 | 22.33 | |||
| Turnout | 70.94 | ||||
| Labour hold | Swing | ||||
| Party | Candidate | Votes | % | ± | |
|---|---|---|---|---|---|
| Labour | Kenneth Marks | 22,276 | 51.23 | ||
| Conservative | Stephen Waley-Cohen | 13,300 | 30.59 | ||
| Liberal | Robert Brooks | 7,906 | 18.18 | ||
| Majority | 8,976 | 20.64 | |||
| Turnout | 78.35 | ||||
| Labour hold | Swing | ||||
| Party | Candidate | Votes | % | ± | |
|---|---|---|---|---|---|
| Labour | Kenneth Marks | 23,679 | 53.47 | ||
| Conservative | John A. Kevill | 17,594 | 39.73 | ||
| Liberal | James M. Ashley | 3,013 | 6.80 | ||
| Majority | 6,085 | 13.74 | |||
| Turnout | 71.90 | ||||
| Labour hold | Swing | ||||
Elections in the 1960s
| Party | Candidate | Votes | % | ± | |
|---|---|---|---|---|---|
| Labour | Kenneth Marks | 19,259 | 45.89 | -14.21 | |
| Conservative | Winston Churchill | 18,682 | 44.51 | +4.61 | |
| Liberal | Terry Lacey | 2,471 | 5.89 | N/A | |
| All Party Alliance | John Creasey | 1,123 | 2.68 | N/A | |
| Communist | Victor Eddisford | 437 | 1.04 | N/A | |
| Majority | 557 | 1.38 | |||
| Labour hold | Swing | ||||
| Party | Candidate | Votes | % | ± | |
|---|---|---|---|---|---|
| Labour | Konni Zilliacus | 24,726 | 60.10 | ||
| Conservative | Ian Keith Paley | 16,418 | 39.90 | ||
| Majority | 8,308 | 20.19 | |||
| Turnout | 72.56 | ||||
| Labour hold | Swing | ||||
| Party | Candidate | Votes | % | ± | |
|---|---|---|---|---|---|
| Labour | Konni Zilliacus | 23,895 | 55.11 | ||
| Conservative | Edwin Hodson | 19,465 | 44.89 | ||
| Majority | 4,430 | 10.22 | |||
| Turnout | 76.44 | ||||
| Labour hold | Swing | ||||
Elections in the 1950s
| Party | Candidate | Votes | % | ± | |
|---|---|---|---|---|---|
| Labour | Konni Zilliacus | 23,337 | 50.94 | ||
| Conservative | Donald Henry Moore | 22,480 | 49.06 | ||
| Majority | 857 | 1.87 | |||
| Turnout | 82.04 | ||||
| Labour hold | Swing | ||||
| Party | Candidate | Votes | % | ± | |
|---|---|---|---|---|---|
| Labour | Konni Zilliacus | 21,102 | 50.32 | ||
| Conservative | K. Bruce Campbell | 20,833 | 49.68 | ||
| Majority | 269 | 0.64 | |||
| Turnout | 76.49 | ||||
| Labour hold | Swing | ||||
| Party | Candidate | Votes | % | ± | |
|---|---|---|---|---|---|
| Labour | William Oldfield | 28,763 | 58.02 | ||
| Conservative | Squire Horace Garlick | 20,815 | 41.98 | ||
| Majority | 7,948 | 16.03 | |||
| Turnout | 82.31 | ||||
| Labour hold | Swing | ||||
| Party | Candidate | Votes | % | ± | |
|---|---|---|---|---|---|
| Labour | William Oldfield | 28,088 | 55.18 | ||
| Conservative | James Watts | 18,564 | 36.47 | ||
| Liberal | Abram Maxwell Caplin | 3,377 | 6.63 | ||
| Communist | Syd Abbott[31] | 873 | 1.72 | ||
| Majority | 9,524 | 18.71 | |||
| Turnout | 85.49 | ||||
| Labour hold | Swing | ||||
Elections in the 1940s
| Party | Candidate | Votes | % | ± | |
|---|---|---|---|---|---|
| Labour | William Oldfield | 24,095 | 69.05 | n/a | |
| Conservative | Harry Sharp | 10,799 | 30.95 | n/a | |
| Majority | 13,296 | 38.10 | n/a | ||
| Turnout | 75.53 | n/a | |||
| Labour hold | Swing | n/a | |||
| Party | Candidate | Votes | % | ± | |
|---|---|---|---|---|---|
| Labour | William Oldfield | Unopposed | n/a | n/a | |
| Labour hold | Swing | n/a | |||
Elections in the 1930s
| Party | Candidate | Votes | % | ± | |
|---|---|---|---|---|---|
| Labour | William Wedgewood Benn | 17,849 | 57.69 | +1.83 | |
| Conservative | Alexander Spearman | 13,091 | 42.31 | -1.83 | |
| Majority | 4,758 | ||||
| Turnout | |||||
| Labour hold | Swing | ||||
| Party | Candidate | Votes | % | ± | |
|---|---|---|---|---|---|
| Labour | Joseph Compton | 20,039 | 55.86 | ||
| Conservative | Eric Bailey | 15,833 | 44.14 | ||
| Majority | 4,206 | 11.73 | |||
| Turnout | 77.12 | ||||
| Labour gain from Conservative | Swing | ||||
| Party | Candidate | Votes | % | ± | |
|---|---|---|---|---|---|
| Conservative | Eric Bailey | 21,228 | 55.1 | ||
| Labour | Joseph Compton | 16,316 | 42.3 | ||
| Communist | Chris Flanagan | 1,000 | 2.6 | ||
| Majority | 4,912 | 12.7 | |||
| Turnout | 81.9 | ||||
| Conservative gain from Labour | Swing | ||||
Elections in the 1920s
| Party | Candidate | Votes | % | ± | |
|---|---|---|---|---|---|
| Labour | Joseph Compton | 22,056 | 61.1 | +5.1 | |
| Unionist | Alfred Critchley | 10,664 | 29.5 | −14.5 | |
| Liberal | Beatrice Annie Bayfield | 3,385 | 9.4 | N/A | |
| Majority | 11,392 | 31.6 | +19.6 | ||
| Turnout | 36,105 | 81.5 | +1.0 | ||
| Registered electors | 44,300 | ||||
| Labour hold | Swing | +9.8 | |||
| Party | Candidate | Votes | % | ± | |
|---|---|---|---|---|---|
| Labour | Joseph Compton | 16,383 | 56.0 | −4.0 | |
| Unionist | B.C. Sellars | 12,898 | 44.0 | +4.0 | |
| Majority | 3,485 | 12.0 | −8.0 | ||
| Turnout | 29,281 | 80.5 | +6.0 | ||
| Registered electors | 36,378 | ||||
| Labour hold | Swing | −4.0 | |||
| Party | Candidate | Votes | % | ± | |
|---|---|---|---|---|---|
| Labour | Joseph Compton | 16,080 | 60.0 | +6.4 | |
| Unionist | William Heap | 10,702 | 40.0 | −6.4 | |
| Majority | 5,378 | 20.0 | +12.8 | ||
| Turnout | 26,782 | 74.5 | −4.5 | ||
| Registered electors | 35,963 | ||||
| Labour hold | Swing | +4.0 | |||
| Party | Candidate | Votes | % | ± | |
|---|---|---|---|---|---|
| Labour | John Hodge | 15,058 | 53.6 | −13.8 | |
| Unionist | William Heap | 13,057 | 46.4 | N/A | |
| Majority | 8,042 | 7.2 | −38.3 | ||
| Turnout | 28,115 | 79.0 | +21.0 | ||
| Registered electors | 35,567 | ||||
| Labour hold | Swing | N/A | |||
Election in 1918
| Party | Candidate | Votes | % | ± | |
|---|---|---|---|---|---|
| Labour | John Hodge | 13,047 | 67.4 | +15.2 | |
| Independent Unionist | Henry White | 5,005 | 25.9 | N/A | |
| Socialist Labour | J. T. Murphy | 1,300 | 6.7 | N/A | |
| Majority | 8,042 | 41.6 | +37.2 | ||
| Turnout | 19,352 | 58.0 | −24.7 | ||
| Registered electors | 33,382 | ||||
| Labour hold | Swing | N/A | |||
- Although Hodge was a member of the Coalition Government, no official Coalition Government endorsement was sent to any candidate
Election results for South-East Lancashire, Gorton Division
Elections in the 1910s
Expected General Election 1914/15: Under the terms of the Parliament Act 1911 a General Election was required to take place before the end of 1915. The political parties had been making preparations for an election to take place and by July 1914, the following candidates had been selected;
- Labour: John Hodge
- Unionist: Fred H Carter [36]
In the event, the election was postponed on the outbreak of the Great War.
| Party | Candidate | Votes | % | ± | |
|---|---|---|---|---|---|
| Labour | John Hodge | 7,840 | 52.2 | +0.6 | |
| Conservative | Henry White | 7,187 | 47.8 | −0.6 | |
| Majority | 653 | 4.4 | +1.2 | ||
| Turnout | 15,027 | 82.7 | −0.6 | ||
| Registered electors | 18,175 | ||||
| Labour hold | Swing | +0.6 | |||
| Party | Candidate | Votes | % | ± | |
|---|---|---|---|---|---|
| Labour | John Hodge | 7,807 | 51.6 | −14.8 | |
| Conservative | Henry White | 7,334 | 48.4 | +14.8 | |
| Majority | 473 | 3.2 | −29.6 | ||
| Turnout | 15,141 | 83.3 | +5.3 | ||
| Registered electors | 18,175 | ||||
| Labour hold | Swing | −14.8 | |||
Elections in the 1900s
| Party | Candidate | Votes | % | ± | |
|---|---|---|---|---|---|
| Labour Repr. Cmte. | John Hodge | 8,566 | 66.4 | +18.8 | |
| Conservative | SW Royce | 4,341 | 33.6 | −18.8 | |
| Majority | 4,225 | 32.8 | N/A | ||
| Turnout | 12,907 | 78.0 | +2.2 | ||
| Registered electors | 16,547 | ||||
| Labour Repr. Cmte. gain from Conservative | Swing | +18.8 | |||
Mr Hatch crossed the floor of the House of Commons to sit with the Liberals, around February 1905.[15]

| Party | Candidate | Votes | % | ± | |
|---|---|---|---|---|---|
| Conservative | Ernest Hatch | 5,761 | 52.4 | −5.5 | |
| Lib-Lab | W. Ward | 5,241 | 47.6 | N/A | |
| Majority | 520 | 4.8 | −11.0 | ||
| Turnout | 11,002 | 75.8 | −2.3 | ||
| Registered electors | 14,511 | ||||
| Conservative hold | Swing | N/A | |||
Elections in the 1890s
| Party | Candidate | Votes | % | ± | |
|---|---|---|---|---|---|
| Conservative | Ernest Hatch | 5,865 | 57.9 | +9.0 | |
| Ind. Labour Party | Richard Pankhurst | 4,261 | 42.1 | N/A | |
| Majority | 1,604 | 15.8 | N/A | ||
| Turnout | 10,126 | 78.1 | −9.2 | ||
| Registered electors | 14,511 | ||||
| Conservative gain from Liberal | Swing | N/A | |||
| Party | Candidate | Votes | % | ± | |
|---|---|---|---|---|---|
| Liberal | William Mather | 5,255 | 51.1 | −1.5 | |
| Conservative | Ernest Hatch | 5,033 | 48.9 | +1.5 | |
| Majority | 222 | 2.2 | −3.0 | ||
| Turnout | 10,288 | 87.3 | +2.9 | ||
| Registered electors | 11,782 | ||||
| Liberal hold | Swing | −1.5 | |||
Elections in the 1880s

| Party | Candidate | Votes | % | ± | |
|---|---|---|---|---|---|
| Liberal | William Mather | 5,155 | 54.5 | ||
| Conservative | Ernest Hatch | 4,309 | 45.5 | −1.9 | |
| Majority | 846 | 9.0 | +3.8 | ||
| Turnout | 9,464 | 88.7 | +4.3 | ||
| Registered electors | 10,674 | ||||
| Liberal hold | Swing | +1.9 | |||
- Caused by Peacock's death.
| Party | Candidate | Votes | % | ± | |
|---|---|---|---|---|---|
| Liberal | Richard Peacock | 4,592 | 52.6 | −8.0 | |
| Conservative | Arthur George Egerton | 4,135 | 47.4 | +8.0 | |
| Majority | 457 | 5.2 | −16.0 | ||
| Turnout | 8,727 | 84.4 | -0.3 | ||
| Registered electors | 10,334 | ||||
| Liberal hold | Swing | −.8.0 | |||
| Party | Candidate | Votes | % | ± | |
|---|---|---|---|---|---|
| Liberal | Richard Peacock | 5,300 | 60.6 | N/A | |
| Conservative | Daniel Irvine Flattely | 3,452 | 39.4 | N/A | |
| Majority | 1,848 | 21.2 | N/A | ||
| Turnout | 8,752 | 84.7 | N/A | ||
| Registered electors | 10,334 | ||||
| Liberal win (new seat) | |||||
See also
Notes and references
- Notes
- ↑ A borough constituency (for the purposes of election expenses and type of returning officer)
- ↑ As with all constituencies, the constituency elects one Member of Parliament (MP) by the first past the post system of election at least every five years.
- References
- ↑ "Electorate Figures - Boundary Commission for England". 2011 Electorate Figures. Boundary Commission for England. 4 March 2011. Archived from the original on 6 November 2010. Retrieved 13 March 2011.
- ↑ List of Labour MPs elected in 2015 by % majority UK Political.info. Retrieved 2017-01-29
- ↑ https://www.bbc.co.uk/news/uk-england-manchester-39646993
- ↑ "GE2017 - Constituency results". Britain Elects (Google Docs). Retrieved 11 June 2017.
- ↑ Seventh Schedule, Counties At Large, Number Of Members And Names And Contents Of Divisions, Redistribution of Seats Act 1885 (C.23)
- 1 2 3 F A Youngs Jr., Guide to the Local Administrative Units of England, Vol.II: Northern England, London 1991
- ↑ Ninth Schedule: Redistribution of Seats, Representation of the People Act 1918 (C.5)
- ↑ First Schedule, Parliamentary Constituencies, Representation of the People Act 1948 (C.65)
- ↑ The Parliamentary Constituencies (Manchester, Oldham and Ashton under Lyne) Order, 1955 (S.I. 1955 No.16)
- ↑ The Parliamentary Constituencies (England) Order 1983 (S.I. 1983 No.417)
- ↑ The Parliamentary Constituencies (England) Order 1995 (S.I. 1995 No.1626)
- ↑ Fifth periodical report - Volume 3 Mapping for the London Boroughs and the Metropolitan Counties, The Stationery Office, 26 February 2007, ISBN 0-10-170322-8
- 1 2 LGBCE (April 2017). Final recommendations on the new electoral arrangements for Manchester City Council (PDF). Local Government Boundary Commission for England. Archived from the original (PDF) on 4 February 2018.
- ↑ Leigh Rayment's Historical List of MPs – Constituencies beginning with "G" (part 2)
- 1 2 "Political Notes". The Times, London. 13 February 1905. p. 6. Retrieved 2017-02-27.
- ↑ "Statement of Persons Nominated & Notice of Poll". Manchester City Council. Retrieved 12 May 2017.
- ↑ "Election Data 2015". Electoral Calculus. Archived from the original on 17 October 2015. Retrieved 17 October 2015.
- ↑ "Manchester Gorton". BBC News. Retrieved 11 May 2015.
- ↑ "Election Data 2010". Electoral Calculus. Archived from the original on 26 July 2013. Retrieved 17 October 2015.
- ↑ BBC - Election 2010 - Manchester Gorton
- ↑ "Election Data 2005". Electoral Calculus. Archived from the original on 15 October 2011. Retrieved 18 October 2015.
- ↑ "Election Data 2001". Electoral Calculus. Archived from the original on 15 October 2011. Retrieved 18 October 2015.
- ↑ "Election Data 1997". Electoral Calculus. Archived from the original on 15 October 2011. Retrieved 18 October 2015.
- ↑ "Election Data 1992". Electoral Calculus. Archived from the original on 15 October 2011. Retrieved 18 October 2015.
- ↑ "UK General Election results April 1992". Richard Kimber's Political Science Resources. Politics Resources. 9 April 1992. Retrieved 2010-12-06.
- ↑ "Election Data 1987". Electoral Calculus. Archived from the original on 15 October 2011. Retrieved 18 October 2015.
- ↑ "Election Data 1983". Electoral Calculus. Archived from the original on 15 October 2011. Retrieved 18 October 2015.
- 1 2 3 4 5 6 7 8 9 10 The Times House of Commons, 1950-1970
- ↑
- ↑
- ↑ Stevenson, Graham. "Abbott Syd". Retrieved 29 April 2017.
- 1 2 3 4 F. W. S. Craig, ed. (1977). British Parliamentary Election Results 1918–1949. Palgrave Macmillan UK. doi:10.1007/978-1-349-81467-1.
- ↑ "Manchester & Salford: Only About Half The Voters Poll". The Manchester Guardian. 30 Dec 1918. p. 4.
- ↑ British Parliamentary Election Results 1918-49, FWS Craig
- ↑ Debrett's House of Commons & Judicial Bench, 1922
- ↑ Manchester Courier and Lancashire General Advertiser, 17 Jan 1914
- ↑ Debrett's House of Commons & Judicial Bench, 1916
- 1 2 3 4 5 6 7 8 9 Craig, FWS, ed. (1974). British Parliamentary Election Results: 1885-1918. London: Macmillan Press. ISBN 9781349022984.
- ↑ Debrett's House of Commons & Judicial Bench, 1916
- 1 2 3 4 5 6 The Liberal Year Book, 1907
- 1 2 Debrett's House of Commons & Judicial Bench, 1901
- ↑ The Constitutional Year Book, 1904, published by Conservative Central Office, page 147 (171 in web page), Lancashire South East
- ↑ Debrett's House of Commons & Judicial Bench, 1886
| Parliament of the United Kingdom | ||
|---|---|---|
| Preceded by Louth and Horncastle |
Constituency represented by the Father of the House 2015-2017 |
Succeeded by Rushcliffe |