United Kingdom local elections, 2014
|
| |||||||||||||||||||||||||||||||||||||||||||||||||||||||||||||||||||||||||||||||||||||
| |||||||||||||||||||||||||||||||||||||||||||||||||||||||||||||||||||||||||||||||||||||
162 councils in England 5 directly-elected mayors All 11 councils in Northern Ireland | |||||||||||||||||||||||||||||||||||||||||||||||||||||||||||||||||||||||||||||||||||||
|---|---|---|---|---|---|---|---|---|---|---|---|---|---|---|---|---|---|---|---|---|---|---|---|---|---|---|---|---|---|---|---|---|---|---|---|---|---|---|---|---|---|---|---|---|---|---|---|---|---|---|---|---|---|---|---|---|---|---|---|---|---|---|---|---|---|---|---|---|---|---|---|---|---|---|---|---|---|---|---|---|---|---|---|---|---|
| |||||||||||||||||||||||||||||||||||||||||||||||||||||||||||||||||||||||||||||||||||||
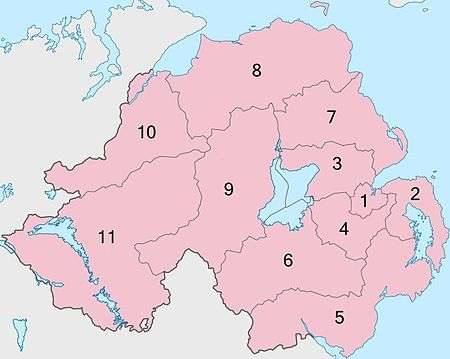
 Map showing results of English and Northern Irish local elections, 2014. Black represents No Overall Control, white represents areas that did not hold an election, blue represents the Conservative Party, red represents the Labour Party and gold represents the Liberal Democrats. Areas in light red represent the Democratic Unionist Party. Dark green represents Sinn Féin and light green represents the SDLP. Areas shown in grey are outside England and Northern Ireland. | |||||||||||||||||||||||||||||||||||||||||||||||||||||||||||||||||||||||||||||||||||||
.jpg)
.jpg)
The 2014 United Kingdom local elections were held on 22 May 2014. Usually these elections are held on the first Thursday in May but were postponed to coincide with the 2014 European Parliament Elections. Direct elections were held for all 32 London boroughs, all 36 metropolitan boroughs, 74 district/borough councils, 20 unitary authorities and various mayoral posts in England and elections to the new councils in Northern Ireland.
All registered electors (British, Irish, Commonwealth and European Union citizens) who were aged 18 or over on the day of the election were entitled to vote in the local elections.
The BBC's projected national vote share (PNV) put Labour on 31%, the Conservatives on 29%, UKIP on 17%, and the Liberal Democrats on 13%.[1] Rallings and Thrasher of Plymouth University's national equivalent vote share (NEV) estimated 31% for Labour, 30% for the Conservatives, 18% for UKIP, and 11% for the Liberal Democrats.[2]
For the fourth year running, the Labour Party enjoyed the largest share of the vote in local elections, but its share of the vote was its smallest since 2010. UKIP, which topped the same day's European Parliament elections, finished third in vote share, claiming council seats from Labour, the Conservatives and Liberal Democrats.
Overview of results
UK-wide results
| Party | Councillors | Councils | |||
|---|---|---|---|---|---|
| Number | Change | Number | Change | ||
| Labour | 2,121 | 82 | |||
| Conservative | 1,364 | 41 | |||
| Liberal Democrat | 427 | 6 | |||
| UKIP | 166 | 0 | |||
| DUP | 130 | 0 | |||
| Sinn Féin | 105 | 0 | |||
| UUP | 88 | 0 | |||
| Independent | 71 | 0 | |||
| SDLP | 66 | 0 | |||
| Residents | 53 | 0 | |||
| Green | 38 | 0 | |||
| Alliance | 32 | 0 | |||
| Tower Hamlets First | 18 | 0 | |||
| TUV | 13 | 0 | |||
| Green (NI) | 4 | 0 | |||
| PUP | 4 | 0 | |||
| NI21 | 1 | 0 | |||
| Liberal | 2 | 0 | |||
| BNP | 1 | 0 | |||
| Health Concern | 1 | 0 | |||
| No overall control | n/a | n/a | 43 | ||
England results
| Party | Councillors | Councils | |||
|---|---|---|---|---|---|
| Number | Change | Number | Change | ||
| Labour | 2,121 | 82 | |||
| Conservative | 1,364 | 41 | |||
| Liberal Democrat | 427 | 6 | |||
| UKIP | 163 | 0 | |||
| Independent | 71 | 0 | |||
| Residents | 53 | 0 | |||
| Green | 38 | 0 | |||
| Tower Hamlets First | 18 | 0 | |||
| Liberal | 2 | 0 | |||
| BNP | 1 | 0 | |||
| Health Concern | 1 | 0 | |||
| No overall control | n/a | n/a | 32 | ||
The Respect Party lost both their remaining councillors.[3]
English Councils - shift of control
This table depicts how the control of local councils shifted in this election.
The data along the diagonal represents no shift in control in that number of councils: for example, Chorley was among the solid colour no change 73 Labour controlled councils. The other cells represent the shifts of control: for example, Harrow was one of five councils of which Labour gained control from No Overall Control. The intensity of the colour in a table cell other than the diagonal reflects the relative number of losses in council control suffered by each party.
| after election → | N.O.C. | Labour | Cons. | Lib. Dem. |
Old total |
losses |
|---|---|---|---|---|---|---|
| ↓ before election | ||||||
| No Overall Control | 19 | 5 | - | - | 24 | − 5 |
| Labour | 4 | 73 | - | - | 77 | − 4 |
| Conservative | 8 | 4 | 40 | - | 52 | −12 |
| Liberal Democrats | 1 | - | 1 | 6 | 8 | − 2 |
| New total | 32 | 82 | 41 | 6 | 161 | - |
| gains | +13 | + 9 | + 1 | - | - | - |
| Net change | + 8 | + 5 | −11 | − 2 | - | - |
Last updated at 11:30:10 on 27 May 2014[4]
Northern Ireland results
| Party | Councillors | % of councillors | First preference votes | % of FP votes | |||||||||
|---|---|---|---|---|---|---|---|---|---|---|---|---|---|
| 2011[5] | 2014 | +/- | 2011[6] | 2014 | +/- | 2011[7] | 2014[8] | +/- | 2011 | 2014 | +/- | ||
| DUP | 145 | 130 | 31.4% | 28.1% | 179,436 | 144,928 | 27.2% | 23.1% | |||||
| Sinn Féin | 115 | 105 | 24.9% | 22.7% | 163,712 | 151,137 | 24.8% | 24.1% | |||||
| UUP | 77 | 88 | 16.7% | 19.0% | 100,643 | 101,385 | 15.2% | 16.1% | |||||
| SDLP | 67 | 66 | 14.5% | 14.2% | 99,325 | 85,237 | 15.0% | 13.6% | |||||
| Alliance | 34 | 32 | 7.4% | 6.9% | 48,859 | 41,769 | 7.4% | 6.7% | |||||
| TUV | 3 | 13 | 0.6% | 2.8% | 13,079 | 28,310 | 2.0% | 4.5% | |||||
| PUP | 1 | 4 | 0.2% | 0.8% | 3,858 | 12,753 | 0.6% | 2.0% | |||||
| Green (NI) | 1 | 4 | 0.2% | 0.8% | 6,317 | 5,515 | 1.0% | 0.8% | |||||
| UKIP | 1 | 3 | 0.2% | 0.6% | 2,550 | 9,311 | 0.4% | 1.4% | |||||
| NI21 | 0 | 1 | 0.0% | 0.2% | 0 | 11,495 | 0.0% | 1.8% | |||||
| People Before Profit | 0 | 1 | 0.0% | 0.2% | 1,721 | 1,923 | 0.3% | 0.3% | |||||
| NI Conservatives | 0 | 0 | 0.0% | 0.0% | 1,321 | 2,527 | 0.2% | 0.4% | |||||
| Éirígí | 0 | 0 | 0.0% | 0.0% | 2,062 | 1,756 | 0.3% | 0.3% | |||||
| Workers' Party | 0 | 0 | 0.0% | 0.0% | 760 | 985 | 0.1 | 0.2% | |||||
| Fermanagh Against Fracking | 0 | 0 | 0.0% | 0.0% | 0 | 555 | 0.0% | 0.1% | |||||
| Republican Network for Unity | 0 | 0 | 0.0% | 0.0% | 0 | 502 | 0.0% | 0.1% | |||||
| Community Partnership | 0 | 0 | 0.0% | 0.0% | 800 | 388 | 0.1 | 0.1% | |||||
| Socialist Party | 0 | 0 | 0.0% | 0.0% | 682 | 272 | 0.1% | 0.0% | |||||
| BNP | 0 | 0 | 0.0% | 0.0% | 491 | 174 | 0.1% | 0.0% | |||||
| Democracy First | 0 | 0 | 0.0% | 0.0% | 0 | 173 | 0.0% | 0.0% | |||||
| Others | 0 | 0 | 0.0% | 0.0% | 2,142 | 0 | 0.3% | 0.0% | |||||
| Independent | 18 | 15 | 3.9% | 3.2% | 32,151 | 26,682 | 4.9% | 4.2% | |||||
| Total | 462 | 462 | 100% | 100% | 660,631 | 627,777 | 100% | 100% | |||||
London boroughs
All seats in the 32 London Borough Councils were up for election.
Summary of results
| Party[9] | Votes won | % votes | Change | Seats | % seats | Change | Councils | Change | |
|---|---|---|---|---|---|---|---|---|---|
| Labour | 944,967 | 37.6 | +5.1 | 1,060 | 57.3 | +185 | 20 | +3 | |
| Conservative | 663,847 | 26.4 | −5.3 | 612 | 33.1 | −105 | 9 | −2 | |
| Liberal Democrat | 267,769 | 10.6 | −11.8 | 116 | 6.3 | −130 | 1 | −1 | |
| Green | 246,805 | 9.8 | +3.2 | 4 | 0.2 | +2 | 0 | ±0 | |
| UKIP | 239,001 | 9.5 | +8.4 | 12 | 0.6 | +12 | 0 | ±0 | |
| Others | 152,684 | 6.1 | +0.4 | 47 | 2.5 | +26 | 0 | ±0 | |
| No overall control | N/A | 2 | −6 | ||||||
Individual council results
Harrow's Council was elected in 2010 with a Labour majority but divisions within this majority in 2013 led to a coalition struck between the Conservatives and the Independent Labour Group (formed of eight ex-Labour councillors). Conservatives withdrew their support for Independent Labour on 16 September 2013 leading to a brief Conservative minority administration.
Metropolitan boroughs
One third of the seats in all 36 Metropolitan Boroughs were up for election (showing those elected and each party's total in the new council).
| Council | Previous control | Result | |||||||
|---|---|---|---|---|---|---|---|---|---|
| Con | Lab | LD | UKIP | Others | |||||
| Barnsley | Labour | Labour | 1, 4 | 18, 52 | 2, 7 | ||||
| Birmingham | Labour | Labour | 13, 31 | 22, 77 | 5, 12 | ||||
| Bolton | Labour | Labour | 5, 15 | 13, 40 | 1, 3 | 2, 2 | |||
| Bradford | Labour | Labour | 7, 21 | 17, 46 | 3, 8 | 1, 1 | 1,3Grn 2,11Ind | ||
| Bury | Labour | Labour | 2, 11 | 15, 38 | 0, 1 | 0, 1 | |||
| Calderdale | No overall control | No overall control (Lab minority, then Con-Ind minority) | 6, 19 | 9, 25 | 1, 6 | 1, 1 | |||
| Coventry | Labour | Labour | 6, 11 | 13, 43 | |||||
| Doncaster | Labour | Labour | 3, 8 | 15, 48 | 1, 1 | 2, 6 | |||
| Dudley | Labour | Labour | 7, 20 | 10, 40 | 7, 9 | 0,1Grn 0,2Ind | |||
| Gateshead | Labour | Labour | 18, 55 | 4, 11 | |||||
| Kirklees | No overall control | No overall control (Lab minority) | 6, 18 | 10, 32 | 5, 11 | 1,5Grn 1,3Ind | |||
| Knowsley | Labour | Labour | 21, 63 | ||||||
| Leeds | Labour | Labour | 6, 19 | 20, 62 | 4, 9 | 1,3Grn 2,6Ind | |||
| Liverpool | Labour | Labour | 27, 79 | 0, 3 | 2,4Grn 1,4Ind | ||||
| Manchester | Labour | Labour | 33, 95 | 1, 1 | |||||
| Newcastle upon Tyne | Labour | Labour | 18, 52 | 8, 24 | 0, 2 | ||||
| North Tyneside | Labour | Labour | 3, 12 | 15, 44 | 1, 4 | ||||
| Oldham | Labour | Labour | 0, 2 | 14, 45 | 3, 10 | 2, 2 | 1, 1 | ||
| Rochdale | Labour | Labour | 3, 11 | 16, 48 | 1, 1 | ||||
| Rotherham | Labour | Labour | 0, 2 | 11, 50 | 10, 10 | 0, 1 | |||
| St Helens | Labour | Labour | 1, 3 | 14, 43 | 1, 2 | ||||
| Salford | Labour | Labour | 3, 8 | 17, 52 | |||||
| Sandwell | Labour | Labour | 0, 1 | 23, 70 | 1, 1 | ||||
| Sefton | Labour | Labour | 2, 7 | 13, 40 | 6, 17 | 1, 2 | |||
| Sheffield | Labour | Labour | 18, 60 | 6, 17 | 3, 3 | 2,4Grn | |||
| Solihull | Conservative | Conservative | 9, 29 | 0, 2 | 3, 8 | 1, 1 | 4,10Grn | ||
| South Tyneside | Labour | Labour | 0, 1 | 17, 49 | 0, 1 | 1, 3 | |||
| Stockport | No overall control | No overall control (Lib Dem minority) | 4, 10 | 7, 22 | 9, 28 | 1, 3 | |||
| Sunderland | Labour | Labour | 3, 8 | 21, 63 | 1, 4 | ||||
| Tameside | Labour | Labour | 2, 6 | 17, 51 | |||||
| Trafford | Conservative | Conservative | 12, 33 | 9, 27 | 1, 3 | ||||
| Wakefield | Labour | Labour | 1, 6 | 17, 54 | 2, 2 | 1, 1 | |||
| Walsall | No overall control | No overall control (Lab minority) | 6, 21 | 9, 30 | 0, 3 | 3, 3 | 1, 3 | ||
| Wigan | Labour | Labour | 1, 2 | 23, 62 | 1, 11 | ||||
| Wirral | Labour | Labour | 8, 22 | 11, 37 | 2, 6 | 1,1Grn | |||
| Wolverhampton | Labour | Labour | 4, 12 | 15, 45 | 0, 2 | 1, 1 | |||
| Totals | 117, 373 | 563, 1,741 | 62, 189 | 33, 37 | 28, 104 | ||||
Unitary authorities
Two unitary authorities had all of their seats up for election following boundary changes.
| Council | Previous control | Result | ||||||
|---|---|---|---|---|---|---|---|---|
| Con | Lab | LD | UKIP | |||||
| Milton Keynes | No overall control | No overall control (Lab minority) | 18 | 25 | 13 | 1 | ||
| Slough | Labour | Labour | 8 | 33 | 1 | |||
One third of the council seats were up for election in 17 unitary authorities (elected and totals shown).
| Council | Previous control | Result | ||||||||
|---|---|---|---|---|---|---|---|---|---|---|
| Con | Lab | LD | UKIP | Ind | Others | |||||
| Blackburn with Darwen |
Labour won the most seats | 4 | 16 | 1 | ||||||
| Labour | Labour | 12 | 48 | 4 | ||||||
| Bristol | 6 | 10 | 6 | 1 | - | 3 Green | ||||
| No overall control | No overall control | 15 | 31 | 16 | 1 | 1 | 6 Green | |||
| Derby | 6 | 8 | 3 | 1 | - | |||||
| Labour | Labour | 14 | 27 | 7 | 2 | 1 | ||||
| Halton | Labour won the most seats | 16 | 1 | |||||||
| Labour | Labour | 2 | 51 | 3 | ||||||
| Hartlepool | Labour won the most seats | 1 | 6 | 2 | 2 | |||||
| Labour | Labour | 3 | 19 | 2 | 9 | |||||
| Kingston upon Hull |
Labour won the most seats | 1 | 12 | 7 | - | - | ||||
| Labour | Labour | 2 | 37 | 15 | 1 | 4 | ||||
| North East Lincolnshire |
3 | 3 | 2 | 7 | ||||||
| Labour | No overall control (Labour minority) | 10 | 21 | 3 | 8 | |||||
| Peterborough | 10 | 2 | 3 | 3 | 2 | |||||
| Conservative | No overall control (Conservative minority) | 28 | 12 | 4 | 3 | 10 | ||||
| Plymouth | 9 | 7 | 3 | |||||||
| Labour | Labour | 24 | 30 | 3 | ||||||
| Portsmouth | 5 | - | 3 | 6 | - | |||||
| Liberal Democrat | No overall control (Con with UKIP & Lab support) | 12 | 4 | 19 | 6 | 1 | ||||
| Reading | Labour won the most seats | 2 | 11 | 1 | 2 Green | |||||
| Labour | Labour | 10 | 31 | 2 | 3 Green | |||||
| Southampton | 8 | 8 | 1 | |||||||
| Labour | Labour | 18 | 28 | 2 | ||||||
| Southend- on-Sea |
4 | 4 | 1 | 5 | 4 | - | ||||
| Conservative | No overall control (Ind/Lab/LD coalition) | 19 | 9 | 5 | 5 | 10 | ||||
| Swindon | Conservatives won most seats | 11 | 8 | 1 | ||||||
| Conservative | Conservative | 30 | 23 | 4 | ||||||
| Thurrock | 5 | 6 | 5 | - | ||||||
| Labour | No overall control (Labour minority) | 18 | 23 | 6 | 2 | |||||
| Warrington | Labour won the most seats | 1 | 15 | 5 | ||||||
| Labour | Labour | 3 | 43 | 11 | ||||||
| Wokingham | Conservatives won most seats | 15 | 1 | 2 | - [10] | |||||
| Conservative | Conservative | 44 | 1 | 7 | 2 | |||||
| Totals | seats won in May 2014 | 91 | 133 | 36 | 33 | 9 | 5 Green | |||
| Total membership of new councils | 264 | 438 | 100 | 37 | 42 | 9 Green | ||||
| source: BBC News, retrieved June 2014 | Cons | Lab | LD | UKIP | Ind | others | ||||
Non-metropolitan districts
Whole council
Two district councils had all of their seats up for election following boundary changes.
| Council | Previous control | Result | ||||||
|---|---|---|---|---|---|---|---|---|
| Con | Lab | LD | Others | |||||
| Hart | No overall control | No overall control | 14 | 9 | 10 | |||
| Three Rivers | Liberal Democrat | Liberal Democrat | 10 | 3 | 23 | |||
Half of council
Seven district councils had half of their seats up for election (showing those elected and the new council).
| Council | Previous control | Result | |||||||
|---|---|---|---|---|---|---|---|---|---|
| Con | Lab | LD | UKIP | Others | |||||
| Adur | Conservative | Conservative | 9, 20 | 0, 1 | 4, 6 | 1, 2 | |||
| Cheltenham | Liberal Democrat | Liberal Democrat | 4, 11 | 13, 24 | 2, 5 | ||||
| Fareham | Conservative | Conservative | 11, 23 | 3, 5 | 1, 1 | 1, 2 | |||
| Gosport | Conservative | Conservative | 12, 21 | 2, 6 | 2, 6 | 0, 1 | |||
| Hastings | Labour | Labour | 5, 8 | 11, 24 | |||||
| Nuneaton and Bedworth | Labour | Labour | 2, 3 | 14, 28 | 1,2Grn 0,1Ind | ||||
| Oxford | Labour | Labour | 17, 33 | 5, 8 | 3,6Grn 0,1Ind | ||||
| Totals | 43, 86 | 44, 92 | 23, 43 | 5, 8 | 7, 19 | ||||
Third of council
65 district councils had one third of their seats up for election.
† Elected councillors will hold office for one year only as Purbeck District will adopt whole council elections from 2015.[11][12]
Mayoral elections
There were five mayoral elections.
| Local Authority | Previous Mayor | New Mayor | ||
|---|---|---|---|---|
| Hackney | Jules Pipe (Labour) | Jules Pipe (Labour) | ||
| Lewisham | Sir Steve Bullock (Labour) | Sir Steve Bullock (Labour) | ||
| Newham | Robin Wales (Labour) | Robin Wales (Labour) | ||
| Tower Hamlets | Lutfur Rahman (Independent) | Lutfur Rahman (Tower Hamlets First) | ||
| Watford | Dorothy Thornhill (Liberal Democrat) | Dorothy Thornhill (Liberal Democrat) | ||
Northern Ireland
These were the first elections to the 11 new 'super-councils' in Northern Ireland, following a reorganisation. These will operate in shadow form for one year, with the current 26 councils existing in parallel.[13]

Party composition of new councils
The party abbreviations in this table are explained in the total-vote table that follows it.
| # | Council | ||||||||
|---|---|---|---|---|---|---|---|---|---|
| SF | SDLP | Alliance | UUP | DUP | TUV | Ind | Others | ||
| 3 | Antrim and Newtownabbey | 3 | 4 | 4 | 12 | 15 | 2 | ||
| 6 | Armagh, Banbridge & Craigavon | 8 | 6 | 12 | 13 | 1 | 1 UKIP | ||
| 1 | Belfast City | 19 | 7 | 8 | 7 | 13 | 1 | 5 * | |
| 8 | Causeway Coast and Glens | 7 | 6 | 1 | 10 | 11 | 3 | 1 | 1 PUP |
| 10 | Derry and Strabane | 16 | 10 | 2 | 8 | 4 | |||
| 11 | Fermanagh and Omagh | 17 | 8 | 9 | 5 | 1 | |||
| 4 | Lisburn and Castlereagh | 3 | 7 | 8 | 20 | 1 | 1 NI21 | ||
| 7 | Mid and East Antrim | 3 | 1 | 3 | 9 | 16 | 5 | 2 | 1 UKIP |
| 9 | Mid-Ulster | 18 | 6 | 7 | 8 | 1 | |||
| 5 | Newry, Mourne and Down | 14 | 14 | 2 | 3 | 4 | 3 | 1 UKIP | |
| 2 | North Down and Ards | 1 | 7 | 9 | 17 | 1 | 2 | 3 GPNI | |
| Total | 105 | 66 | 32 | 88 | 130 | 13 | 15 | 13 | |
| 1 | * Belfast other: 3 Progressive Unionist, 1 Green (N.I.) & 1 People Before Profit | ||||||||
| source: BBC News, retrieved on 1 June 2014 | |||||||||
Votes cast
These elections used the Single Transferable Vote method of proportional representation. Votes and percentages for each party reflect the first preference on each ballot.
| Party | Councillors | % of councillors | First preference votes | % of FP votes | |||||||||
|---|---|---|---|---|---|---|---|---|---|---|---|---|---|
| 2011 (notional)[15] | 2014 | +/- | 2011 (notional) | 2014 | +/- | 2011[16] | 2014[17] | +/- | 2011 | 2014 | +/- | ||
| DUP | 145 | 130 | 31.4% | 28.1% | 179,436 | 144,928 | 27.2% | 23.1% | |||||
| Sinn Féin | 115 | 105 | 24.9% | 22.7% | 163,712 | 151,137 | 24.8% | 24.1% | |||||
| UUP | 77 | 88 | 16.7% | 19.0% | 100,643 | 101,385 | 15.2% | 16.1% | |||||
| SDLP | 67 | 66 | 14.5% | 14.2% | 99,325 | 85,237 | 15.0% | 13.6% | |||||
| Alliance | 34 | 32 | 7.4% | 6.9% | 48,859 | 41,769 | 7.4% | 6.7% | |||||
| TUV | 3 | 13 | 0.6% | 2.8% | 13,079 | 28,310 | 2.0% | 4.5% | |||||
| PUP | 1 | 4 | 0.2% | 0.8% | 3,858 | 12,753 | 0.6% | 2.0% | |||||
| Green (NI) | 1 | 4 | 0.2% | 0.8% | 6,317 | 5,515 | 1.0% | 0.8% | |||||
| UKIP | 1 | 3 | 0.2% | 0.6% | 2,550 | 9,311 | 0.4% | 1.4% | |||||
| NI21 | 0 | 1 | 0.0% | 0.2% | 0 | 11,495 | 0.0% | 1.8% | |||||
| People Before Profit | 0 | 1 | 0.0% | 0.2% | 1,721 | 1,923 | 0.3% | 0.3% | |||||
| NI Conservatives | 0 | 0 | 0.0% | 0.0% | 1,321 | 2,527 | 0.2% | 0.4% | |||||
| Éirígí | 0 | 0 | 0.0% | 0.0% | 2,062 | 1,756 | 0.3% | 0.3% | |||||
| Workers' Party | 0 | 0 | 0.0% | 0.0% | 760 | 985 | 0.1 | 0.2% | |||||
| Fermanagh Against Fracking | 0 | 0 | 0.0% | 0.0% | 0 | 555 | 0.0% | 0.1% | |||||
| Republican Network for Unity | 0 | 0 | 0.0% | 0.0% | 0 | 502 | 0.0% | 0.1% | |||||
| Community Partnership | 0 | 0 | 0.0% | 0.0% | 800 | 388 | 0.1 | 0.1% | |||||
| Socialist Party | 0 | 0 | 0.0% | 0.0% | 682 | 272 | 0.1% | 0.0% | |||||
| BNP | 0 | 0 | 0.0% | 0.0% | 491 | 174 | 0.1% | 0.0% | |||||
| Democracy First | 0 | 0 | 0.0% | 0.0% | 0 | 173 | 0.0% | 0.0% | |||||
| Others | 0 | 0 | 0.0% | 0.0% | 2,142 | 0 | 0.3% | 0.0% | |||||
| Independent | 18 | 15 | 3.9% | 3.2% | 32,151 | 26,682 | 4.9% | 4.2% | |||||
| Total | 462 | 462 | 100% | 100% | 660,631 | 627,777 | 100% | 100% | |||||
Electoral administration
Eligibility to vote
All registered electors (British, Irish, Commonwealth and European Union citizens) who were aged 18 or over on the day of the election were entitled to vote in the local elections. Those who were temporarily away from their ordinary address (for example, away working, on holiday, in student accommodation or in hospital) were also entitled to vote in the local elections,[18] although those who have moved abroad and registered as overseas electors cannot vote in the local elections. Those who were registered to vote at more than one address (such as a university student who has a term-time address and lives at home during holidays) were entitled to vote in the local elections at each address, as long as they were not in the same local government area.[19][20]
Enacting legislation
These elections were held on 22 May 2014 as provided by 'The Local Elections (Ordinary Day of Elections in 2014) Order 2013' (S.I. 2013/2277).[13][21][22][23]
See also
Notes
- ↑ Swing figures are between the BBC national projected vote share extrapolation from United Kingdom local elections, 2013, and the BBC equivalent vote share projection from these local elections held in different areas
- 1 2 England: 163 councillors (+161 net). Northern Ireland: 3 councillors (+2 net)
References
- ↑ "BBC Projected National Share of Vote 2014 | Elections Etc". electionsetc.com. Retrieved 30 April 2018.
- ↑ http://researchbriefings.files.parliament.uk/documents/CBP-7596/CBP-7596.pdf
- ↑ "BBC English Council Results". bbc news. 28 May 2014. Retrieved 28 May 2014.
- ↑ "Council Elections 2014". The Guardian.
- ↑ (Notional)
- ↑ (Notional)
- ↑ Vote 2011: Northern Ireland Council Elections, BBC News, 11 May 2011
- ↑ Vote 2014: Northern Ireland Council Elections, BBC News, 25 May 2014
- ↑ http://www.electionscentre.co.uk/?page_id=3755
- ↑ "Wokingham Borough election results for 22 May 2014". Wokingham Borough Council. 22 May 2014. Archived from the original (pdf) on 2014-11-29. Retrieved 16 November 2014.
- ↑ Riglar, Kirsty (3 March 2014). "District Council Elections in Purbeck". Purbeck District Council Central Services. Archived from the original on 3 March 2014. Retrieved 3 March 2014.
- ↑ "Minutes of the special meeting of the Purbeck District Council". dorsetforyou.com. 21 February 2012. Retrieved 3 March 2014.
- 1 2 "European Parliament and council polls on same day". http://www.belfasttelegraph.co.uk. Retrieved 22 August 2013. External link in
|publisher=(help) - ↑ Vote 2014 Northern Ireland Council Results, BBC News, retrieved 30 May 2014.
- ↑ Whyte, Nicholas (6 April 2014). "The 11 new district councils – projecting the 2011 votes". Slugger O'Toole. Retrieved 23 April 2014.
- ↑ Vote 2011: Northern Ireland Council Elections, BBC News, 11 May 2011
- ↑ Vote 2014: Northern Ireland Council Elections, BBC News, 25 May 2014
- ↑ "The Representation of the People (Form of Canvass) (England and Wales) Regulations 2006, Schedule Part 1". Legislation.gov.uk. 13 October 2011. Retrieved 7 December 2012.
- ↑ "Students". http://www.aboutmyvote.co.uk/. Archived from the original on 22 August 2013. Retrieved 22 August 2013. External link in
|publisher=(help) - ↑ "I have two homes. Can I register at both addresses?". The Electoral Commission. Retrieved 5 January 2011.
- ↑ "The Local Elections (Ordinary Day of Elections in 2014) Order 2013". Legislation.gov. Retrieved 19 May 2014.
- ↑ "Ukip chances of 2014 euro election win 'strengthened by polling date change'". The Daily Telegraph. 26 June 2013. Retrieved 27 June 2013.
- ↑ "England local elections 2014". Local Government Information Unit. Retrieved 12 March 2013.
| General elections |
|
|---|---|
| Local elections |
|
| European elections | |
| Referendums | |