Guildford (UK Parliament constituency)
Coordinates: 51°14′46″N 0°33′07″W / 51.246°N 0.552°W
| Guildford | |
|---|---|
|
County constituency for the House of Commons | |
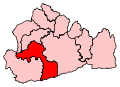 Boundary of Guildford in Surrey for the 2010 general election. | |
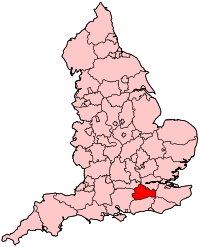 Location of Surrey within England. | |
| County | Surrey |
| Electorate | 77,517 (December 2010)[1] |
| Major settlements | Guildford, Cranleigh, Worplesdon |
| Current constituency | |
| Created | 1885 |
| Member of parliament | Anne Milton (Conservative) |
| Number of members | One |
| 1295–1885 | |
| Number of members |
1295–1868: Two 1868–1885: One |
| Type of constituency | Borough constituency |
| Overlaps | |
| European Parliament constituency | South East England |
Guildford is a constituency[n 1] in Surrey represented in the House of Commons of the UK Parliament since 2005 by Anne Milton, a Conservative.[n 2]
History
From the first Commons in the Model Parliament of 1295 Guildford was a parliamentary borough sending two members to Parliament until 1868[2][n 3] and one until 1885. In the latter years of sending two members a bloc vote system of elections was used. Until 1885 the electorate in the town of Guildford elected the member(s) of parliament,[3] which expanded in 1885 into a county division under the Redistribution of Seats Act 1885.
Early political history
The seat elected between 1868 and 2001 Conservatives. Exceptions in this period took place when the two-then-three main British parties' policies were beginning to coalesce. The first was a continuation of the centuries-old representation of Guildford by influential members of the Earl of Onslow's family, including a single member winning three widely spaced elections, before being defeated by a further member of the same family in its minor Sussex and British Indian branch, then the majority of the seat's voters were again swayed toward the Liberal landslide of the 1906 general election.
Modern political history
Successive elections in 2001 and 2005 saw marginal majorities of under 2% of the vote - in favour of a Liberal Democrat and then a Conservative. The 2015 result brought the incumbent MP a conservative majority of more than 41%, up from 14% in 2010.
Boundaries
1885-1918: The Municipal Boroughs of Guildford and Godalming, the Sessional Division of Farnham, and part of the Sessional Division of Guildford.
1918-1950: The Municipal Boroughs of Guildford and Godalming, the Urban District of Haslemere, the Rural District of Hambledon, and the Rural District of Guildford except the civil parish of Pirbright.
1950-1983: The Municipal Borough of Guildford, in the Rural District of Guildford the civil parishes of Artington, Compton, Puttenham, Shackleford, Shalford, Wanborough, and Worplesdon, and in the Rural District of Hambledon the civil parishes of Alfold, Bramley, Busbridge, Cranleigh, Dunsfold, Ewhurst, Hambledon, Hascombe, and Wonersh.
1983-1997: The Borough of Guildford wards of Christchurch, Friary and St Nicolas, Holy Trinity, Merrow and Burpham, Onslow, Pilgrims, Shalford, Stoke, Stoughton, Tongham, Westborough, and Worplesdon, and the District of Waverley wards of Blackheath and Wonersh, Bramley, Cranleigh East, Cranleigh West, Ewhurst, and Shamley Green.
1997-2010: As above less Tongham ward.
2010-present: The Borough of Guildford wards of Burpham, Christchurch, Friary and St Nicolas, Holy Trinity, Merrow, Onslow, Pilgrims, Shalford, Stoke, Stoughton, Westborough, and Worplesdon, and the Borough of Waverley wards of Alfold, Blackheath and Wonersh, Cranleigh East, Cranleigh Rural and Ellens Green, Cranleigh West, Ewhurst, and Shamley Green and Cranleigh North.
The constituency covers Guildford and a surrounding area in the county of Surrey.
Members of Parliament
MPs 1295–1640
MPs 1640–1868
prior to 1868 the constituency was jointly represented by two MPs
MPs since 1868
Elections
Elections in the 2010s

| Party | Candidate | Votes | % | ± | |
|---|---|---|---|---|---|
| Conservative | Anne Milton | 30,295 | 54.6 | -2.5 | |
| Liberal Democrat | Zoe Franklin | 13,255 | 23.9 | +8.4 | |
| Labour | Howard Smith | 10,545 | 19.0 | +6.9 | |
| Green | Mark Bray-Parry | 1,152 | 2.1 | -2.7 | |
| Peace | John Morris | 205 | 0.4 | +0.1 | |
| Independent | Semi Essessi | 57 | 0.1 | +0.1 | |
| Majority | 17,040 | 30.7 | -10.9 | ||
| Turnout | 55,509 | 74 | +3.5 | ||
| Conservative hold | Swing | -5.45 | |||
| Party | Candidate | Votes | % | ± | |
|---|---|---|---|---|---|
| Conservative | Anne Milton | 30,802 | 57.1 | +3.8 | |
| Liberal Democrat | Kelly-Marie Blundell | 8,354 | 15.5 | −23.8 | |
| Labour | Richard Wilson | 6,534 | 12.1 | +7.0 | |
| UKIP | Harry Aldridge | 4,774 | 8.8 | +7.0 | |
| Green | John Pletts | 2,558 | 4.7 | N/A | |
| Guildford Greenbelt Group | Susan Parker | 538 | 1.0 | N/A | |
| Peace | John Morris | 230 | 0.4 | −0.1 | |
| CISTA | Gerri Smyth | 196 | 0.4 | N/A | |
| Majority | 22,448 | 41.6 | +27.6 | ||
| Turnout | 53,986 | 70.5 | −1.6 | ||
| Conservative hold | Swing | 13.8 | |||
| Party | Candidate | Votes | % | ± | |
|---|---|---|---|---|---|
| Conservative | Anne Milton | 29,618 | 53.3 | +9.9 | |
| Liberal Democrat | Sue Doughty | 21,836 | 39.3 | −4.0 | |
| Labour | Tim Shand | 2,812 | 5.1 | −4.8 | |
| UKIP | Mazhar Manzoor | 1,021 | 1.8 | +0.6 | |
| Peace | John Morris | 280 | 0.5 | N/A | |
| Majority | 7,782 | 14.0 | +13.3 | ||
| Turnout | 55,567 | 72.1 | +5.0 | ||
| Conservative hold | Swing | +5.45 | |||
Elections in the 2000s
| Party | Candidate | Votes | % | ± | |
|---|---|---|---|---|---|
| Liberal Democrat | 21,884 | 43.36 | N/A | ||
| Conservative | 21,779 | 43.15 | N/A | ||
| Labour | 5,070 | 10.05 | N/A | ||
| Majority | 105 | 0.21 | N/A | ||
| Party | Candidate | Votes | % | ± | |
|---|---|---|---|---|---|
| Conservative | Anne Milton | 22,595 | 43.8 | +2.4 | |
| Liberal Democrat | Sue Doughty | 22,248 | 43.1 | +0.5 | |
| Labour | Karen Landles | 5,054 | 9.8 | −3.9 | |
| Green | John Pletts | 811 | 1.6 | N/A | |
| UKIP | Martin Haslam | 645 | 1.2 | −0.3 | |
| Peace | John Morris | 166 | 0.3 | N/A | |
| Independent | Victoria Lavin | 112 | 0.2 | N/A | |
| Majority | 347 | 0.7 | |||
| Turnout | 51,631 | 68.3 | +5.6 | ||
| Conservative gain from Liberal Democrat | Swing | +0.9 | |||
| Party | Candidate | Votes | % | ± | |
|---|---|---|---|---|---|
| Liberal Democrat | Sue Doughty | 20,358 | 42.6 | +8.4 | |
| Conservative | Nick St Aubyn | 19,820 | 41.4 | −1.1 | |
| Labour | Joyce Still | 6,558 | 13.7 | −3.8 | |
| UKIP | Sonya Porter | 736 | 1.5 | +0.8 | |
| Peace Party (UK) | John Morris | 370 | 0.8 | +0.3 | |
| Majority | 538 | 1.2 | |||
| Turnout | 47,842 | 62.7 | −11.9 | ||
| Liberal Democrat gain from Conservative | Swing | +4.7 | |||
Elections in the 1990s
| Party | Candidate | Votes | % | ± | |
|---|---|---|---|---|---|
| Conservative | Nick St Aubyn | 24,230 | 42.5 | −12.8 | |
| Liberal Democrat | Margaret Sharp | 19,439 | 34.1 | +1.3 | |
| Labour | Joseph Burns | 9,945 | 17.5 | +6.1 | |
| Referendum | James Gore | 2,650 | 4.7 | N/A | |
| UKIP | Robert McWhirter | 400 | 0.7 | N/A | |
| Peace Party (UK) | John Morris | 294 | 0.5 | N/A | |
| Majority | 4,791 | 8.4 | |||
| Turnout | 56,958 | 74.6 | |||
| Conservative hold | Swing | −7.05[n 5] | |||
This constituency underwent boundary changes between the 1992 and 1997 general elections and thus change in share of vote is based on a notional calculation.
| Party | Candidate | Votes | % | ± | |
|---|---|---|---|---|---|
| Conservative | David Howell | 33,516 | 55.3 | −0.2 | |
| Liberal Democrat | Margaret Sharp | 20,112 | 33.1 | −0.8 | |
| Labour | Howard Mann | 6,781 | 11.2 | +0.6 | |
| Natural Law | Alex Law | 234 | 0.4 | N/A | |
| Majority | 13,404 | 22.2 | +0.6 | ||
| Turnout | 60,643 | 78.5 | +3.2 | ||
| Conservative hold | Swing | +0.3 | |||
Elections in the 1980s
| Party | Candidate | Votes | % | ± | |
|---|---|---|---|---|---|
| Conservative | David Howell | 32,504 | 55.5 | +0.4 | |
| Social Democratic | Margaret Sharp | 19,897 | 33.9 | +0.5 | |
| Labour | Robert Wolverson | 6,216 | 10.6 | −0.1 | |
| Majority | 12,607 | 21.6 | |||
| Turnout | 58,617 | 75.3 | |||
| Conservative hold | Swing | −0.05[n 6] | |||
| Party | Candidate | Votes | % | ± | |
|---|---|---|---|---|---|
| Conservative | David Howell | 30,016 | 55.1 | −2.2 | |
| Social Democratic | Margaret Sharp | 18,192 | 33.4 | +12.2[n 7] | |
| Labour | Keith Chesterton | 5,853 | 10.7 | −10.5 | |
| Party of Associates with Licensees | Anthony Farrell | 425 | 0.8 | ||
| Majority | 11,824 | 21.7 | |||
| Turnout | 54,486 | 72.5 | |||
| Conservative hold | Swing | −7.2[n 8] | |||
Elections in the 1970s
| Party | Candidate | Votes | % | ± | |
|---|---|---|---|---|---|
| Conservative | David Howell | 31,595 | 57.3 | +8.1 | |
| Labour | Paul Hampden Blagbrough | 11,689 | 21.2 | −1.4 | |
| Liberal | Henry Donnelly | 11,673 | 21.2 | −7.0 | |
| Independent Rhodesian Front | Peter Gilbert Scott | 232 | 0.4 | +0.4 | |
| Majority | 19,906 | 36.1 | |||
| Turnout | 55,189 | 75.3 | |||
| Conservative hold | Swing | +4.75 | |||
| Party | Candidate | Votes | % | ± | |
|---|---|---|---|---|---|
| Conservative | David Howell | 25,564 | 49.2 | +0.3 | |
| Liberal | Christopher Jonathan Fox | 14,660 | 28.2 | −3.5 | |
| Labour | Robert William Harris | 11,727 | 22.6 | +3.2 | |
| Majority | 10,904 | 21.0 | |||
| Turnout | 51,951 | 71.9 | |||
| Conservative hold | Swing | +1.9[n 9] | |||
| Party | Candidate | Votes | % | ± | |
|---|---|---|---|---|---|
| Conservative | David Howell | 28,152 | 48.9 | −6.5 | |
| Liberal | Christopher Jonathan Fox | 18,261 | 31.7 | +13.7 | |
| Labour | Jean Elizabeth Crow | 11,175 | 19.4 | −7.3 | |
| Majority | 9,891 | 17.2 | |||
| Turnout | 57,588 | 80.4 | |||
| Conservative hold | Swing | −10.1 | |||
| Party | Candidate | Votes | % | ± | |
|---|---|---|---|---|---|
| Conservative | David Howell | 27,203 | 55.4 | +5.0 | |
| Labour | Patton B. Smith | 13,108 | 26.7 | −6.2 | |
| Liberal | Michael J. Walton | 8,822 | 18.0 | +1.3 | |
| Majority | 14,095 | 28.7 | |||
| Turnout | 49,133 | 72.0 | |||
| Conservative hold | Swing | +5.6 | |||
Elections in the 1960s
| Party | Candidate | Votes | % | ± | |
|---|---|---|---|---|---|
| Conservative | David Howell | 24,116 | 50.4 | −0.5 | |
| Labour | Cedric Thornberry | 15,771 | 32.9 | +4.9 | |
| Liberal | John R. Buchanan | 7,992 | 16.7 | −4.4 | |
| Majority | 8,345 | 17.4 | |||
| Turnout | 47,879 | 78.7 | |||
| Conservative hold | Swing | ||||
| Party | Candidate | Votes | % | ± | |
|---|---|---|---|---|---|
| Conservative | George Nugent | 24,277 | 50.9 | −6.6 | |
| Labour | Gwilym Emrys H Griffith | 13,365 | 28.0 | −1.1 | |
| Liberal | Christopher John N Martin | 10,052 | 21.1 | +7.7 | |
| Majority | 10,912 | 22.9 | |||
| Turnout | 47,694 | 78.6 | |||
| Conservative hold | Swing | −2.8 | |||
Elections in the 1950s
| Party | Candidate | Votes | % | ± | |
|---|---|---|---|---|---|
| Conservative | George Nugent | 27,198 | 57.5 | −5.7 | |
| Labour | George R Bellerby | 13,756 | 29.1 | −7.7 | |
| Liberal | Arthur Rossi Braybrooke | 6,318 | 13.4 | +13.4 | |
| Majority | 13,442 | 28.4 | |||
| Turnout | 47,272 | 80.2 | |||
| Conservative hold | Swing | +1.0[n 10] | |||
| Party | Candidate | Votes | % | ± | |
|---|---|---|---|---|---|
| Conservative | George Nugent | 27,113 | 63.203 | +0.0 | |
| Labour | George R Bellerby | 15,785 | 36.797 | +0.0 | |
| Majority | 11,328 | 26.4 | |||
| Turnout | 76.4 | ||||
| Conservative hold | Swing | +0.0 | |||
| Party | Candidate | Votes | % | ± | |
|---|---|---|---|---|---|
| Conservative | George Nugent | 27,604 | 63.207 | +7.7 | |
| Labour | Vernon George Wilkinson | 16,068 | 36.793 | +2.5 | |
| Majority | 11,536 | 26.4 | |||
| Turnout | 79.6 | ||||
| Conservative hold | Swing | +5.1 | |||
| Party | Candidate | Votes | % | ± | |
|---|---|---|---|---|---|
| Conservative | George Nugent | 24,983 | 55.5 | +5.5 | |
| Labour | Vernon George Wilkinson | 15,443 | 34.3 | +1.4 | |
| Liberal | Frederick Henry Philpott | 4,552 | 10.12 | -7.0 | |
| Majority | 9540 | 21.21 | |||
| Turnout | 84.07 | ||||
| Conservative hold | Swing | ||||
Constituency boundaries were redrawn in time for the 1950 general election. From 1918 to 1950 the west part of Surrey had been represented by three constituencies - Farnham to the west, Chertsey to the north east and Guildford to the south east. The 1950 boundary changes saw the creation of an additional constituency in the west part of Surrey, namely Woking. As a result, the constituency of Guildford significantly reduced in size, in both geographically and in population terms. To the south the areas of Godalming, Elstead, Thursley, Whitley, Haslemere and Chiddingford, all of which had previously been part of the constituency of Guildford, were transferred to the constituency of Farnham. To the east the areas of Send, Ripley, Wisley, Ockham, St Martha, Albury, Shere, Clandon and Horsley, all of which had previously been part of the constituency of Guildford, were transferred to the mid Surrey constituency of Dorking.[26]
The boundaries, which emerged in the run up to 1950 general election, namely a constituency centred on the town of Guildford plus an area southwards towards Cranleigh, became, with small changes in subsequent boundary reviews, the basic shape for the constituency of Guildford throughout the later part of the 20th century.
Elections in the 1940s
| Party | Candidate | Votes | % | ± | |
|---|---|---|---|---|---|
| Conservative | John Jarvis | 33,091 | 50.0 | -24.9 | |
| Labour | Vernon George Wilkinson | 21,789 | 32.93 | +7.87 | |
| Liberal | Joseph Gerald Curie Ruston | 11,281 | 17.1 | +17.1 | |
| Majority | 11,302 | 17.1 | |||
| Turnout | 74.9 | ||||
| Conservative hold | Swing | -16.4 | |||
Elections in the 1930s
| Party | Candidate | Votes | % | ± | |
|---|---|---|---|---|---|
| Conservative | John Jarvis | 35,384 | 74.9 | ||
| Labour | FA Campbell | 11,833 | 25.06 | ||
| Majority | 23,551 | 49.88 | |||
| Turnout | 69.27 | ||||
| Conservative hold | Swing | ||||
| Party | Candidate | Votes | % | ± | |
|---|---|---|---|---|---|
| Conservative | Charles Rhys | 39,008 | 86.21 | ||
| Labour | Sidney Peck | 6,242 | 13.79 | ||
| Majority | 32,766 | 72.41 | |||
| Turnout | 72.26 | ||||
| Conservative hold | Swing | ||||
| Party | Candidate | Votes | % | ± | |
|---|---|---|---|---|---|
| Conservative | Charles Rhys | unopposed | |||
| Conservative hold | Swing | ||||
Elections in the 1920s
| Party | Candidate | Votes | % | ± | |
|---|---|---|---|---|---|
| Unionist | Henry Buckingham | 20,550 | 48.3 | −14.0 | |
| Liberal | Somerset Stopford Brooke | 15,984 | 37.6 | +21.1 | |
| Labour | Lawrence Miles Worsnop | 5,996 | 14.1 | −7.1 | |
| Majority | 4,566 | 10.7 | −30.4 | ||
| Turnout | 42,530 | 72.1 | +0.8 | ||
| Registered electors | 58,958 | ||||
| Unionist hold | Swing | −17.6 | |||
| Party | Candidate | Votes | % | ± | |
|---|---|---|---|---|---|
| Unionist | Henry Buckingham | 18,273 | 62.3 | +10.0 | |
| Labour | Frank Markham | 6,227 | 21.2 | +1.7 | |
| Liberal | Samuel Parnell Kerr | 4,842 | 16.5 | −11.7 | |
| Majority | 12,046 | 41.1 | +17.0 | ||
| Turnout | 29,342 | 71.3 | +3.7 | ||
| Registered electors | 41,164 | ||||
| Unionist hold | Swing | +4.2 | |||
| Party | Candidate | Votes | % | ± | |
|---|---|---|---|---|---|
| Unionist | Henry Buckingham | 14,117 | 52.3 | −18.3 | |
| Liberal | Samuel Parnell Kerr | 7,601 | 28.2 | N/A | |
| Labour | William Bennett | 5,260 | 19.5 | −9.9 | |
| Majority | 6,516 | 24.1 | −17.1 | ||
| Turnout | 26,978 | 67.6 | +2.2 | ||
| Registered electors | 39,931 | ||||
| Unionist hold | Swing | −4.2 | |||
| Party | Candidate | Votes | % | ± | |
|---|---|---|---|---|---|
| Unionist | Henry Buckingham | 18,045 | 70.6 | −1.5 | |
| Labour | William Bennett | 7,514 | 29.4 | +1.5 | |
| Majority | 10,531 | 41.2 | −3.0 | ||
| Turnout | 25,559 | 65.4 | +15.4 | ||
| Registered electors | 39,087 | ||||
| Unionist hold | Swing | −1.5 | |||
Elections in the 1910s
| Party | Candidate | Votes | % | ± | |
|---|---|---|---|---|---|
| C | Unionist | Edgar Horne | 13,149 | 72.1 | +8.4 |
| Labour | William Bennett | 5,078 | 27.9 | N/A | |
| Majority | 8,071 | 44.2 | +16.9 | ||
| Turnout | 18,227 | 50.0 | −33.0 | ||
| Registered electors | 36,427 | ||||
| Unionist hold | Swing | N/A | |||
| C indicates candidate endorsed by the coalition government. | |||||
Constituency boundaries were redrawn in time for the 1918 general election. From 1885 to 1918 the west part of Surrey had been represented by two constituencies - the north part of west Surrey was the constituency of Chertsey, the south part the constituency of Guildford. Boundary changes in the run up to the 1918 general election resulted in an increase from two to three constituencies in west Surrey - Farnham to the west, Chertsey to the north east and Guildford to the south east.
As a result of these boundary changes, the constituency of Guildford lost the areas of Ash, Normandy, Seale, Frensham and Farnham, towards its west, but to the east gained the areas of Merrow, Send, Ripley, Ockham, Wisley, Clandon and Horsley; all of which had previously been part of the constituency of Chertsey.[30]
| Party | Candidate | Votes | % | ± | |
|---|---|---|---|---|---|
| Conservative | Edgar Horne | 8,463 | 63.7 | −1.1 | |
| Liberal | Arthur Jex Davey | 4,832 | 36.3 | +1.1 | |
| Majority | 3,631 | 27.3 | −2.2 | ||
| Turnout | 13,295 | 83.0 | −6.2 | ||
| Registered electors | 16,020 | ||||
| Conservative hold | Swing | −1.1 | |||

| Party | Candidate | Votes | % | ± | |
|---|---|---|---|---|---|
| Conservative | Edgar Horne | 9,264 | 64.8 | +18.1 | |
| Liberal | Algernon Methuen | 5,033 | 35.2 | −18.1 | |
| Majority | 4,231 | 29.6 | N/A | ||
| Turnout | 14,297 | 89.2 | +5.8 | ||
| Registered electors | 16,020 | ||||
| Conservative gain from Liberal | Swing | +18.1 | |||
Elections in the 1900s
| Party | Candidate | Votes | % | ± | |
|---|---|---|---|---|---|
| Liberal | Henry Cowan | 6,430 | 53.3 | +15.0 | |
| Conservative | St John Brodrick | 5,630 | 46.7 | −15.0 | |
| Majority | 800 | 6.6 | N/A | ||
| Turnout | 12,060 | 83.4 | +7.9 | ||
| Registered electors | 14,469 | ||||
| Liberal gain from Conservative | Swing | +15.0 | |||
| Party | Candidate | Votes | % | ± | |
|---|---|---|---|---|---|
| Conservative | St John Brodrick | Unopposed | |||
| Conservative hold | |||||
| Party | Candidate | Votes | % | ± | |
|---|---|---|---|---|---|
| Conservative | St John Brodrick | 5,816 | 61.7 | N/A | |
| Liberal | AW Chapman | 3,609 | 38.3 | N/A | |
| Majority | 2,207 | 23.4 | N/A | ||
| Turnout | 9,425 | 75.5 | N/A | ||
| Registered electors | 12,477 | ||||
| Conservative hold | Swing | N/A | |||
Elections in the 1890s
| Party | Candidate | Votes | % | ± | |
|---|---|---|---|---|---|
| Conservative | St John Brodrick | Unopposed | |||
| Conservative hold | |||||
| Party | Candidate | Votes | % | ± | |
|---|---|---|---|---|---|
| Conservative | St John Brodrick | 5,191 | 58.3 | N/A | |
| Liberal | George Patrick Charles Lawrence[33][34] | 3,720 | 41.7 | N/A | |
| Majority | 1,471 | 16.6 | N/A | ||
| Turnout | 8,911 | 79.2 | N/A | ||
| Registered electors | 11,248 | ||||
| Conservative hold | Swing | N/A | |||
Elections in the 1880s
| Party | Candidate | Votes | % | ± | |
|---|---|---|---|---|---|
| Conservative | St John Brodrick | Unopposed | |||
| Conservative hold | |||||
| Party | Candidate | Votes | % | ± | |
|---|---|---|---|---|---|
| Conservative | St John Brodrick | 4,485 | 54.5 | −0.8 | |
| Liberal | Ellis Duncombe Gosling | 3,750 | 45.5 | +0.8 | |
| Majority | 735 | 9.0 | −1.5 | ||
| Turnout | 8,235 | 82.5 | −8.3 | ||
| Registered electors | 9,978 | ||||
| Conservative hold | Swing | −0.8 | |||
Constituency boundaries were redrawn in time for the 1885 general election. From 1868 to 1885 the west part of Surrey had been represented by two constituencies, one known as Guildford (which consisted of the town centre of Guildford and little else) and one constituency known as Surrey Western, which comprised the rest of that part of the county of Surrey. The Guildford constituency was both geographically and in size of electorate significantly smaller than the Surrey Western constituency. The 1885 to 1918 constituency boundaries saw the area of west Surrey divided into two constituencies more equal in size of population and land area. The north part of west Surrey was given the constituency name Chertsey, the south part Guildford.[35]
| Party | Candidate | Votes | % | ± | |
|---|---|---|---|---|---|
| Conservative | Denzil Onslow | 705 | 55.3 | −5.7 | |
| Liberal | Thomas R. Kemp[37] | 571 | 44.7 | +5.7 | |
| Majority | 134 | 10.5 | −11.5 | ||
| Turnout | 1,276 | 90.8 | +6.3 | ||
| Registered electors | 1,406 | ||||
| Conservative hold | Swing | −5.7 | |||
Elections in the 1870s
| Party | Candidate | Votes | % | ± | |
|---|---|---|---|---|---|
| Conservative | Denzil Onslow | 673 | 61.0 | +12.0 | |
| Liberal | Guildford Onslow[12] | 430 | 39.0 | −12.0 | |
| Majority | 243 | 22.0 | N/A | ||
| Turnout | 1,103 | 84.5 | −1.7 | ||
| Registered electors | 1,306 | ||||
| Conservative gain from Liberal | Swing | +12.0 | |||
Elections in the 1860s
| Party | Candidate | Votes | % | ± | |
|---|---|---|---|---|---|
| Liberal | Guildford Onslow[12] | 536 | 51.0 | −12.8 | |
| Conservative | Richard Garth | 515 | 49.0 | +12.8 | |
| Majority | 21 | 2.0 | +0.3 | ||
| Turnout | 1,051 | 86.2 | −3.5 | ||
| Registered electors | 1,219 | ||||
| Liberal hold | Swing | −12.8 | |||
Constituency boundaries were redrawn in time for the 1868 election.
Prior to the 1868 general election, the constituency of Guildford was represented by two Members of Parliament. That was reduced to one from 1868 onwards.
The 1868 to 1885 constituency known as Guildford was geographically limited to an area around the current centre of Guildford town. This is in marked contrast to the various post-1885 versions of the constituency known as Guildford all of which have had a much greater geographical area. The 1868 constituency was, at its maximum, little over one mile east to west, and just over one mile north to south.[38] (Most of the area which is in the modern constituency of Guildford would in 1868 have been part of the Surrey Western Constituency, rather than the Guildford Constituency.)
| Party | Candidate | Votes | % | ± | |
|---|---|---|---|---|---|
| Conservative | Richard Garth | 339 | 53.0 | +16.8 | |
| Liberal | William Wilmer Pocock | 301 | 47.0 | −16.8 | |
| Majority | 38 | 5.9 | −4.3 | ||
| Turnout | 640 | 96.0 | +6.3 | ||
| Registered electors | 667 | ||||
| Conservative hold | Swing | +16.8 | |||
The 17 December 1866 by-election was caused by Bovill resigning as an MP following his appointment to judicial office, namely Chief Justice of the Court of Common Pleas.
| Party | Candidate | Votes | % | ± | |
|---|---|---|---|---|---|
| Conservative | William Bovill | 316 | 96.6 | +60.4 | |
| Liberal | Henry Lawes Long[39] | 11 | 3.4 | −60.4 | |
| Majority | 305 | 93.3 | +83.1 | ||
| Turnout | 327 | 49.0 | −40.7 | ||
| Registered electors | 667 | ||||
| Conservative hold | Swing | +60.4 | |||
The 11 July 1866 by-election resulted from the need of Bovill to seek re-election upon his appointment as Solicitor General for England and Wales. Long withdrew from the contest before polling.[40]
| Party | Candidate | Votes | % | ± | |
|---|---|---|---|---|---|
| Liberal | Guildford Onslow[12] | 333 | 37.9 | N/A | |
| Conservative | William Bovill | 318 | 36.2 | N/A | |
| Liberal | William Wilmer Pocock[41] | 228 | 25.9 | N/A | |
| Turnout | 599 (est) | 89.7 (est) | N/A | ||
| Registered electors | 667 | ||||
| Majority | 15 | 1.7 | N/A | ||
| Liberal hold | Swing | N/A | |||
| Majority | 90 | 10.2 | N/A | ||
| Conservative hold | Swing | N/A | |||
Elections in the 1850s
Party designations for many candidates during the 1830s, 1840s and 1850s can be problematic as party ties were not as strong as those that developed, in Britain, in the late 19th century. Therefore, for the 1830s to 1850s election results, listed below, the term Liberal includes Whigs and Radicals; and the term Conservative includes Tories and Peelites, unless otherwise specified.
| Party | Candidate | Votes | % | ± | |
|---|---|---|---|---|---|
| Liberal | Guildford Onslow[12] | Unopposed | |||
| Conservative | William Bovill | Unopposed | |||
| Registered electors | 677 | ||||
| Liberal hold | |||||
| Conservative hold | |||||
| Party | Candidate | Votes | % | ± | |
|---|---|---|---|---|---|
| Whig | Guildford Onslow[12] | 268 | 52.9 | +12.0 | |
| Conservative | William John Evelyn[42] | 239 | 47.1 | +7.5 | |
| Majority | 29 | 5.7 | +4.4 | ||
| Turnout | 507 | 76.1 | +12.0 | ||
| Registered electors | 666 | ||||
| Whig hold | Swing | +2.3 | |||
The 22 October 1858 by-election was caused by RD Mangles resigning as an MP following his appointment as Member of the Council of India.
| Party | Candidate | Votes | % | ± | |
|---|---|---|---|---|---|
| Whig | Ross Donnelly Mangles | 349 | 40.9 | −1.9 | |
| Conservative | William Bovill | 338 | 39.6 | +11.4 | |
| Radical | James Bell | 167 | 19.6 | −9.4 | |
| Turnout | 427 (est) | 64.1 (est) | −2.6 | ||
| Registered electors | 666 | ||||
| Majority | 11 | 1.3 | −12.5 | ||
| Whig hold | Swing | −3.8 | |||
| Majority | 171 | 20.0 | N/A | ||
| Conservative gain from Radical | Swing | +10.4 | |||
| Party | Candidate | Votes | % | ± | |
|---|---|---|---|---|---|
| Whig | Ross Donnelly Mangles | 370 | 42.8 | ||
| Radical | James Bell | 251 | 29.0 | ||
| Conservative | Thomas Lyon Thurlow[43] | 244 | 28.2 | ||
| Turnout | 433 (est) | 66.7 (est) | |||
| Registered electors | 648 | ||||
| Majority | 119 | 13.8 | |||
| Whig hold | Swing | ||||
| Majority | 7 | 0.8 | N/A | ||
| Radical gain from Conservative | Swing | ||||
Elections in the 1840s
| Party | Candidate | Votes | % | ± | |
|---|---|---|---|---|---|
| Conservative | Henry Currie | 366 | |||
| Liberal | Ross Donnelly Mangles | 242 | |||
| Conservative | TL Thurlow | 184 | |||
| Majority | 58 | ||||
| Conservative gain from Liberal | Swing | ||||
| Liberal hold | Swing | ||||
| Party | Candidate | Votes | % | ± | |
|---|---|---|---|---|---|
| Liberal | Ross Donnelly Mangles | 242 | |||
| Liberal | Charles Baring Wall | 221 | |||
| Conservative | James Yorke Scarlett | 177 | |||
| Conservative | Henry Currie | 161 | |||
| Majority | 44 | ||||
| Liberal gain from Conservative | Swing | ||||
| Liberal gain from Conservative | Swing | ||||
Elections in the 1830s
| Party | Candidate | Votes | % | ± | |
|---|---|---|---|---|---|
| Conservative | Charles Baring Wall | 252 | |||
| Conservative | James Yorke Scarlett | 188 | |||
| Liberal | James Mangles | 159 | |||
| Majority | 29 | ||||
| Conservative gain from Liberal | Swing | ||||
| Conservative hold | Swing | ||||
| Party | Candidate | Votes | % | ± | |
|---|---|---|---|---|---|
| Liberal | James Mangles | 299 | |||
| Conservative | Charles Baring Wall | 214 | |||
| Liberal | HAC Austen | 131 | |||
| Majority | 83 | ||||
| Liberal hold | Swing | ||||
| Conservative hold | Swing | ||||
| Party | Candidate | Votes | % | ± | |
|---|---|---|---|---|---|
| Liberal | James Mangles | 299 | |||
| Tory | Charles Baring Wall | 180 | |||
| Liberal | Charles Francis Norton | 138 | |||
| Majority | 42 | ||||
| Liberal hold | Swing | ||||
| Tory gain from Liberal | Swing | ||||
Constituency boundaries were redrawn in time for the 1832 general election.[44]
See also
Notes and references
- Notes
- ↑ A county constituency (for the purposes of election expenses and type of returning officer)
- ↑ As with all constituencies, the constituency elects one Member of Parliament (MP) by the first past the post system of election at least every five years.
- ↑ To the House of Commons of England until 1708, then to the House of Commons of Great Britain until 1801, and to the House of Commons of the United Kingdom until 1885.
- ↑ At the 1806 general election, two Tories were returned: Onslow and Sumner. However, a petition was lodged, and on 16 March 1807 Sumner's election was overturned in favour of the 3rd-placed candidate, the Whig Chapple Norton
- ↑ Due to ward changes somewhat notional (Con-Lib Dem) swing and (Con-Lab) was higher: -9.45
- ↑ Con to Lib
- ↑ Notional, based on pact kept here for Liberals to field candidates, pre-merger in forming the Liberal Democrats
- ↑ Notional Con to SDP swing, most of this swing was Lab and Lib to SDP, shown by the single party swing of -2.2%
- ↑ Again mostly an opposite sign swing caused by a larger other two-party swing. Here: Lib to Lab
- ↑ Theoretical Con-Lab swing but wiped out by gains from an additional opponent party, a Liberal
- References
- ↑ "Electorate Figures - Boundary Commission for England". 2011 Electorate Figures. Boundary Commission for England. 4 March 2011. Archived from the original on 6 November 2010. Retrieved 13 March 2011.
- ↑ Reform Act 1867: representation reduced to one seat with effect from the 1868 general election.
- ↑ Map Boundary Commission VisionofBritain
- 1 2 3 4 5 6 7 8 9 10 11 12 13 14 15 16 17 18 19 20 21 22 23 24 "History of Parliament". History of Parliament Trust. Retrieved 2011-10-29.
- 1 2 3 4 5 6 7 8 9 10 11 "History of Parliament". History of Parliament Trust. Retrieved 2011-10-29.
- 1 2 3 4 5 6 7 8 9 10 "History of Parliament". History of Parliament Trust. Retrieved 2011-10-29.
- 1 2 3 Leigh Rayment's Historical List of MPs – Constituencies beginning with "G" (part 2)
- ↑ For political affiliation see Stoke next Guildford pp57-8, 1999 edition, author Lyn Clark, publisher Phillimore.
- ↑ Kinealy, Christine (2013). "Notes". Charity and the Great Hunger in Ireland: The Kindness of Strangers. London: Bloomsbury. p. 345. ISBN 978-1-4411-7660-8. Retrieved 13 May 2018.
- 1 2 "Guildford". London Standard. July 2, 1852. p. 4. Archived from the original on 23 March 2018. Retrieved 13 May 2018.
- ↑ "Guildford Election". Exeter and Plymouth Gazette. 10 July 1852. pp. 4, 7. Retrieved 13 May 2018 – via British Newspaper Archive. (Subscription required (help)).
- 1 2 3 4 5 6 7 For political affiliation see Guildford p180, 1982 edition, author ER Chamberlin, publisher Phillimore.
- ↑ "News of the Week". Hertford Mercury and Reformer. 30 October 1858. p. 4. Retrieved 13 May 2018 – via British Newspaper Archive. (Subscription required (help)).
- ↑ "Town Talk". Usk Observer, Raglan Herald, and Monmouthshire Central Advertiser. 30 October 1858. p. 2. Retrieved 13 May 2018 – via British Newspaper Archive. (Subscription required (help)).
- ↑ "Guildford parliamentary constituency". BBC News.
- ↑ "Guildford". BBC News. Retrieved 1 April 2017.
- ↑ "Election Data 2015". Electoral Calculus. Archived from the original on 17 October 2015. Retrieved 17 October 2015.
- ↑ "Election Data 2010". Electoral Calculus. Archived from the original on 26 July 2013. Retrieved 17 October 2015.
- ↑ "Election Data 2005". Electoral Calculus. Archived from the original on 15 October 2011. Retrieved 18 October 2015.
- ↑ "Election Data 2001". Electoral Calculus. Archived from the original on 15 October 2011. Retrieved 18 October 2015.
- ↑ "Election Data 1997". Electoral Calculus. Archived from the original on 15 October 2011. Retrieved 18 October 2015.
- ↑ "Election Data 1992". Electoral Calculus. Archived from the original on 15 October 2011. Retrieved 18 October 2015.
- ↑ "Politics Resources". Election 1992. Politics Resources. 9 April 1992. Retrieved 2010-12-06.
- ↑ "Election Data 1987". Electoral Calculus. Archived from the original on 15 October 2011. Retrieved 18 October 2015.
- ↑ "Election Data 1983". Electoral Calculus. Archived from the original on 15 October 2011. Retrieved 18 October 2015.
- ↑ For 1918 to 1950 constituency see http://vision.port.ac.uk/maps/sheet/bc_reports_1917/Surrey_1917, for 1950 to 1955 constituency see http://vision.port.ac.uk/maps/sheet/bc_reports_1900s/Great_Britain_Sheet2
- ↑ http://www.politicsresources.net/area/uk/ge35/i09.htm
- ↑ http://www.politicsresources.net/area/uk/ge31/i09.htm
- ↑ 1918-1929 results see British Parliamentary Election Results 1918-1949 FWS Craig
- ↑ See http://vision.port.ac.uk/maps/sheet/bc_reports_1917/Surrey_1917 for map of constituencies used in 1918 and compare to http://vision.port.ac.uk/maps/sheet/bc_reports_1885/Surrey_1885 for map of 1885-1918 constituencies.
- ↑ 1885-1910 results see British Parliamentary Results 1885-1918 FWS Craig
- 1 2 3 4 5 6 7 8 Craig, FWS, ed. (1974). British Parliamentary Election Results: 1885-1918. London: Macmillan Press. ISBN 9781349022984.
- ↑ "Sir Horace Davey, Q.C., M.P., has consented to address a Liberal meeting at Guildford on Monday evening". The Morning Post. 27 Sep 1890. p. 5. Retrieved 22 November 2017.
- ↑ Lythgoe, Darrin. "Horace Davey". Tatham Family History. Retrieved 22 November 2017.
- ↑ For 1868 constituency boundary maps see http://vision.port.ac.uk/maps/sheet/bc_reports_1868/Guildford_1868 For 1885 to 1918 constituency boundary map see http://vision.port.ac.uk/maps/sheet/bc_reports_1885/Surrey_1885
- 1 2 3 4 5 6 7 8 9 10 Craig, F. W. S., ed. (1977). British Parliamentary Election Results 1832-1885 (e-book)
|format=requires|url=(help) (1st ed.). London: Macmillan Press. ISBN 978-1-349-02349-3. - ↑ "The Pollings". Huddersfield Chronicle. 3 Apr 1880. p. 7. Retrieved 28 November 2017 – via British Newspaper Archive. (Subscription required (help)).
- ↑ The boundary ran roughly from just west of Guildford Railway Station, to Cross Lanes in the east. See http://vision.port.ac.uk/maps/sheet/bc_reports_1868/Guildford_1868 for further details.
- ↑ "The by-elections". London Evening Standard. 12 July 1866. pp. 5–6. Retrieved 15 February 2018 – via British Newspaper Archive. (Subscription required (help)).
- ↑ "Election Intelligence". Suffolk and Essex Free Press. 19 July 1866. p. 3. Retrieved 15 February 2018 – via British Newspaper Archive. (Subscription required (help)).
- ↑ "To the Electors of the Borough of Guildford". Surrey Advertiser. 22 July 1865. p. 1. Retrieved 15 February 2018 – via British Newspaper Archive. (Subscription required (help)).
- ↑ "Guildford Election". West Surrey Times. 30 October 1858. p. 1. Retrieved 13 May 2018 – via British Newspaper Archive. (Subscription required (help)).
- ↑ Windsor and Eton Express. 24 July 1852. p. 2 https://www.britishnewspaperarchive.co.uk/viewer/bl/0000413/18520724/024/0002. Retrieved 13 May 2018 – via British Newspaper Archive. (Subscription required (help)). Missing or empty
|title=(help) - ↑ See http://vision.port.ac.uk/maps/sheet/bc_reports_1868/Guildford_1868 for 1832 constituency boundaries.
Sources
- Election result, 2015 (BBC)
- Election result, 2010 (BBC)
- Election result, 2005 (BBC)
- Election results, 1997 - 2001 (BBC)
- Election results, 1997 - 2001 (Election Demon)
- Election results, 1983 - 1992 (Election Demon)
- Election results, 1945 - 1979 (Political Resources)