Liverpool Riverside (UK Parliament constituency)
Coordinates: 53°21′18″N 2°56′49″W / 53.355°N 2.947°W
| Liverpool, Riverside | |
|---|---|
|
Borough constituency for the House of Commons | |
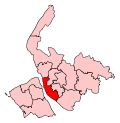 Boundary of Liverpool, Riverside in Merseyside. | |
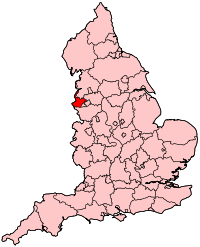 Location of Merseyside within England. | |
| County | Merseyside |
| Electorate | 73,406 (December 2010)[1] |
| Current constituency | |
| Created | 1983 |
| Member of parliament | Louise Ellman (Labour Co-op) |
| Number of members | One |
| Created from |
Liverpool Toxteth, Liverpool Scotland Exchange |
| Overlaps | |
| European Parliament constituency | North West England |
Liverpool Riverside is a constituency[n 1] represented in the House of Commons of the UK Parliament since 1997 by Louise Ellman of the Labour Party and the Co-operative Party.[n 2]
Constituency profile
Liverpool Riverside covers an urban area, many neighbourhoods and households of which are economically deprived on relative and absolute measures. The latter 20th century economic history of Liverpool cost many jobs, businesses and sources of investment to the city leading to urban blight and the return of widespread generational poverty, not seen since the 19th century. The city's 21st century economic history has been increasing prosperous, seeing growth amongst its financial sector, innovative technology businesses, tourism and entertainment gigs and events. The re-investment has been heightened by heavily used high rise buildings by leading architects, principally the Tate Liverpool and an adjoining block, and publicly funded transport and services improvements.
History
- Creation
Liverpool Riverside was created in 1983, merging most of the old Liverpool Scotland Exchange and Liverpool Toxteth constituencies. A provisional recommendation by the Boundary Commission was for the name Liverpool Abercromby, dropped during the local consultations, during which an alternate name of Liverpool Cathedrals was also proposed.[2]
- Results of the winning party
The area has been held by the Labour Party since the 1964 election (including predecessor seats); 1983—1997 by Robert Parry (ex-MP for Scotland Exchange, from 1974), and 1997—date by Louise Ellman. The 2015 result made the seat the 13th safest of Labour's 232 seats by percentage of majority.[3]
- Results of other parties
The 2005 general election saw much more than the national average swing (+8.1%) to the Liberal Democrat candidate (compared with 3.4% nationwide), however Labour's candidate won more than double that share of the vote, scoring 57%. In the same election the area was one of several urban seats in which the Green Party retained its deposit by its candidate scoring just over 5% of the vote. The last time until 2017 that the Conservatives fielded a candidate who achieved second place was in 1992. That party took third place in 2015 behind the highest polling to date for any candidate from the Green Party across Merseyside. Despite the Conservatives managing to come second in the seat in 2017, this was significantly overshadowed by the fact Labour won over 84% of the vote and a majority of 35,947 (74.8%), the biggest margin by both popular vote and percentage majority the party has ever won in the seat.
- Turnout
In the 2001 and 2005 general elections it had the lowest turnout of all constituencies of the UK. In a contest where positions of runner-up candidates greatly changed, turnout exceeded 62% in the 2015 election.[4] This slightly increased to 62.9% in 2017, which remains below the average (the 2017 election had a total turnout of 68.8%), but significantly less so than has previously been the case in the constituency.
Boundaries
1983-1997: The City of Liverpool wards of Abercromby, Arundel, Dingle, Everton, Granby, and Vauxhall.
1997-2010: The City of Liverpool wards of Abercromby, Aigburth, Arundel, Dingle, Everton, Granby, Smithdown, and Vauxhall.
2010–present: The City of Liverpool wards of Central, Greenbank, Kirkdale, Mossley Hill, Princes Park, Riverside, and St Michael's.
The constituency is one of five covering the city of Liverpool. It covers the central area of the city, including famous sights of the city such as the Royal Liver Building and Albert Dock. Neighbourhoods include Aigburth, Canning, Chinatown, Dingle, Kirkdale, Part of Mossley Hill, St Michael's Hamlet, Toxteth and Vauxhall. It contains the University of Liverpool and Liverpool John Moores University.
Members of Parliament
| Election | Member[5] | Party | |
|---|---|---|---|
| 1983 | Robert Parry | Labour | |
| 1997 | Louise Ellman | Labour Co-op | |
Elections
Elections in the 2010s
June 2017
| Party | Candidate | Votes | % | ± | |
|---|---|---|---|---|---|
| Labour Co-op | Louise Ellman | 40,599 | 84.5 | ||
| Conservative | Pamela Hall | 4,652 | 9.7 | ||
| Green | Stephanie Pitchers | 1,582 | 3.3 | ||
| Liberal Democrat | Tom Sebire | 1,187 | 2.5 | ||
| Majority | 35,947 | 74.8 | |||
| Turnout | 48,020 | 62.9 | |||
| Labour Co-op hold | Swing | ||||
May 2015
| Party | Candidate | Votes | % | ± | |
|---|---|---|---|---|---|
| Labour Co-op | Louise Ellman | 29,835 | 67.4 | +8.1 | |
| Green | Martin Dobson | 5,372 | 12.1 | +8.6 | |
| Conservative | Jackson Ng | 4,245 | 9.6 | −1.3 | |
| UKIP | Joe Chiffers | 2,510 | 5.7 | +3.9 | |
| Liberal Democrat | Paul Childs | 1,719 | 3.9 | −18.9 | |
| TUSC | Tony Mulhearn | 582 | 1.3 | +1.3 | |
| Majority | 24,463 | 55.3 | +18.8 | ||
| Turnout | 44,263 | 62.4 | +10.3 | ||
| Labour Co-op hold | Swing | −0.3 | |||
May 2010
| Party | Candidate | Votes | % | ± | |
|---|---|---|---|---|---|
| Labour Co-op | Louise Ellman | 22,998 | 59.3 | +0.0 | |
| Liberal Democrat | Richard Marbrow | 8,825 | 22.7 | −0.6 | |
| Conservative | Kegang Wu | 4,243 | 10.9 | +1.9 | |
| Green | Tom Crone | 1,355 | 3.5 | −1.7 | |
| BNP | Peter Stafford | 706 | 1.8 | +1.8 | |
| UKIP | Patricia Gaskell | 674 | 1.7 | +0.1 | |
| Majority | 14,173 | 36.5 | |||
| Turnout | 38,801 | 52.1 | +9.4 | ||
| Labour Co-op hold | Swing | +0.3 | |||
Elections in the 2000s
The turnout compared to the 2001 election had risen by 7.4% to 41.5% (an above average increase). However, this was still the lowest throughout the United Kingdom which averaged 61.3% with a 1.2% increase.
| Party | Candidate | Votes | % | ± | |
|---|---|---|---|---|---|
| Labour Co-op | Louise Ellman | 17,951 | 57.6 | −13.8 | |
| Liberal Democrat | Richard Marbrow | 7,737 | 24.8 | +8.1 | |
| Conservative | Gabrielle J.F. Howatson | 2,843 | 9.1 | +0.7 | |
| Green | Peter A.E. Cranie | 1,707 | 5.5 | N/A | |
| Socialist Labour | Beth R. Marshall | 498 | 1.6 | N/A | |
| UKIP | Ann R.F. Irving | 455 | 1.5 | N/A | |
| Majority | 10,214 | 32.7 | −17.7 | ||
| Turnout | 31,191 | 41.5 | +7.4 | ||
| Labour Co-op hold | Swing | ||||
In the 2001 election it had a turnout of 34.1% which was the lowest of the United Kingdom. The average turnout in that year was 59.2%.
| Party | Candidate | Votes | % | ± | |
|---|---|---|---|---|---|
| Labour Co-op | Louise Ellman | 18,201 | 71.4 | +1.0 | |
| Liberal Democrat | Richard Marbrow | 4,251 | 16.7 | +3.4 | |
| Conservative | Judith Edwards | 2,142 | 8.4 | −1.1 | |
| Socialist Alliance | Cathy Wilson | 909 | 3.6 | +1.6 | |
| Majority | 13,950 | 54.7 | |||
| Turnout | 25,503 | 34.1 | |||
| Labour Co-op hold | Swing | ||||
Elections in the 1990s
| Party | Candidate | Votes | % | ± | |
|---|---|---|---|---|---|
| Labour Co-op | Louise Ellman | 26,858 | 70.4 | ||
| Liberal Democrat | Beatrice L. Fraenkel | 5,059 | 13.3 | ||
| Conservative | David G. Sparrow | 3,635 | 9.5 | ||
| Socialist Alternative | Cathy Wilson | 776 | 2.0 | ||
| Liberal | David W. Green | 594 | 1.6 | ||
| Referendum | George Skelly | 586 | 1.5 | ||
| ProLife Alliance | Heather M. Neilson | 277 | 0.7 | ||
| Multi-Racial Anti-Corruption Alliance | David Braid | 179 | 0.5 | ||
| Natural Law | Geoffrey Gay | 171 | 0.5 | ||
| Majority | 21,799 | 57.2 | |||
| Turnout | 38,135 | 51.6 | |||
| Labour Co-op hold | Swing | ||||
| Party | Candidate | Votes | % | ± | |
|---|---|---|---|---|---|
| Labour | Robert Parry | 20,550 | 75.9 | +2.7 | |
| Conservative | Andrew Zsigmond | 3,113 | 11.5 | −2.3 | |
| Liberal Democrat | Mohammed Akbar Ali | 2,498 | 9.3 | −2.0 | |
| Green | Lawrence Brown | 738 | 2.7 | N/A | |
| Natural Law | John D. Collins | 169 | 0.6 | N/A | |
| Majority | 17,437 | 64.4 | +5.0 | ||
| Turnout | 27,068 | 54.6 | −4.8 | ||
| Labour hold | Swing | +2.5 | |||
Elections in the 1980s
| Party | Candidate | Votes | % | ± | |
|---|---|---|---|---|---|
| Labour | Robert Parry | 25,505 | 73.2 | +8.3 | |
| Conservative | Stephen Fitzsimmons | 4,816 | 13.8 | −6.0 | |
| Social Democratic | Baldey Singh Chahal | 3, 912 | 11.3 | −2.7 | |
| Communist | Katherine Gardner | 601 | 1.7 | +1.0 | |
| Majority | 20,689 | 59.4 | |||
| Turnout | 34,834 | 65.3 | |||
| Labour hold | Swing | +7.5 | |||
| Party | Candidate | Votes | % | ± | |
|---|---|---|---|---|---|
| Labour | Robert Parry | 24,978 | 64.9 | −2.0 | |
| Conservative | Thomas Morrison | 7,600 | 19.8 | −0.7 | |
| Social Democratic | Peter Zentner | 5,381 | 14.0 | +3.2 | |
| Communist | John Blevin | 261 | 0.7 | N/A | |
| Workers Revolutionary | David Latchford | 234 | 0.6 | N/A | |
| Majority | 17,378 | 45.2 | N/A | ||
| Turnout | 38, 454 | 62.4 | N/A | ||
| Labour win (new seat) | |||||
See also
Notes and references
- Notes
- ↑ A borough constituency (for the purposes of election expenses and type of returning officer)
- ↑ As with all constituencies, the constituency elects one Member of Parliament (MP) by the first past the post system of election at least every five years.
- References
- ↑ "Electorate Figures - Boundary Commission for England". 2011 Electorate Figures. Boundary Commission for England. 4 March 2011. Archived from the original on 6 November 2010. Retrieved 13 March 2011.
- ↑ Boundary Commission for England, Third Periodic Review, 1983
- ↑ List of Labour MPs elected in 2015 by % majority UK Political.info. Retrieved 2017-01-29
- ↑ Dawson, Katie (2010-05-05). "Can Liverpool Riverside improve its voting turnout?". BBC News. Retrieved 5 May 2010.
- ↑ Leigh Rayment's Historical List of MPs – Constituencies beginning with "R" (part 1)
- ↑ http://liverpool.gov.uk/media/1356174/sopn-nop-liverpool-riverside.docx
- ↑ "Election Data 2015". Electoral Calculus. Archived from the original on 17 October 2015. Retrieved 17 October 2015.
- ↑ "Liverpool Riverside". BBC News. Retrieved 10 May 2015.
- ↑ "Election Data 2010". Electoral Calculus. Archived from the original on 26 July 2013. Retrieved 17 October 2015.
- ↑ "Election Data 2005". Electoral Calculus. Archived from the original on 15 October 2011. Retrieved 18 October 2015.
- ↑ "Election Data 2001". Electoral Calculus. Archived from the original on 15 October 2011. Retrieved 18 October 2015.
- ↑ "Election Data 1997". Electoral Calculus. Archived from the original on 15 October 2011. Retrieved 18 October 2015.
- ↑ "'Liverpool Riverside', May 1997 -". ElectionWeb Project. Cognitive Computing Limited. Retrieved 17 May 2016.
- ↑ "Election Data 1992". Electoral Calculus. Archived from the original on 15 October 2011. Retrieved 18 October 2015.
- ↑ "UK General Election results April 1992". Richard Kimber's Political Science Resources. Politics Resources. 9 April 1992. Retrieved 2010-12-06.
- ↑ "Election Data 1987". Electoral Calculus. Archived from the original on 15 October 2011. Retrieved 18 October 2015.
- ↑ "Election Data 1983". Electoral Calculus. Archived from the original on 15 October 2011. Retrieved 18 October 2015.