Isle of Wight (UK Parliament constituency)
Coordinates: 50°41′02″N 1°19′12″W / 50.684°N 1.320°W
| Isle of Wight | |
|---|---|
|
County constituency for the House of Commons | |
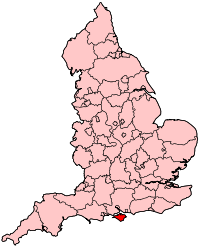 Location of Isle of Wight within England. | |
| County | Isle of Wight |
| Electorate | 105,448[1] |
| Current constituency | |
| Created | 1832 |
| Member of parliament | Robert "Bob" Seely (Conservative) |
| Number of members | One |
| Created from |
Hampshire Newtown Yarmouth |
| Overlaps | |
| European Parliament constituency | South East England |
Isle of Wight (/ˈwaɪt/[2]) is a constituency[n 1] represented in the House of Commons of the UK Parliament since 2017 by Bob Seely of the Conservative Party.
Created by the Great Reform Act for the 1832–33 general election it covers the whole of the Isle of Wight. It has the largest electorate of a constituency, since 1983.[n 2]
Boundaries
The Isle of Wight since 1832 makes up the geographic content of one seat of the House of Commons. It covers the same land as the ceremonial county of the Isle of Wight and the area administered by the unitary authority, Isle of Wight Council: a diamond-shaped island with rounded oblique corners, measuring 22.5 miles (36.2 km) by 13 miles (21 km), the Needles and similar small uninhabitable rocks of very small square surface area. The island is linked by ferry crossings from four points (five points if counting West Cowes and East Cowes separately) to three points in Hampshire: Lymington, Southampton and Portsmouth.
Its electorate of 110,924 (as of 2010)[3] is, by more than 30,000 electors, the largest in the UK, more than 50% above the English average: 71,537,[3] and five times the size of the smallest seat: Na h-Eileanan an Iar, formerly known as the Western Isles.[4]
One or two seats problem
The five (effected rather than abortive) national Boundary Commission Periodic Reports which have taken place since 1955 consulted locally on splitting the island into two seats (and included occasionally proposals for a seat crossing the Solent onto the mainland) but met an overall distaste by the independent commissioners and most consultees and consultation respondents who were not apathetic which accounted for the bulk. The consensus of varying panels of Boundary Commissioners, party-interested and neutral commentators was at the time of these five consultations, that the island would be best represented by one MP. The Commissioners did make mention perfunctorily of their duty by law to avoid such an extent of malapportionment (termed by most commissioners "leaving the island somewhat oversized") but deemed that electoral scientific detail outweighed by the "human" socio-economic factors of the convenience of having one universally acknowledged representative of the island at the national legislature. One problem the independent body cited in 2008 was a difficulty of dividing the island in two in a way that would be acceptable to (or widely accepted by) all major interests. The arbitrary division line problem is routinely encountered in those city council areas which have no rural elements or natural divides and in peninsulars and often resolves itself in dividing in alterate ways at different times to avoid any onset or perception of any bias.[5]
In the 2018 review underway, dividing the island into two separate seats (smaller rather than larger than the allowable range for mainland seats) is a requirement by law to match the other island seats.[6] The Commission's draft proposals divide the island into East and West seats.[7]
History
Before the Reform Act 1832 the island usually had three Parliamentary boroughs: Newport, Newtown, and Yarmouth each electing two MPs. In 1654 a whole island constituency existed for the First Protectorate Parliament but the island reverted to the three constituencies. Otherwise, the island was part-represented by the two MPs for Hampshire. The Reform Act abolished Newtown and Yarmouth parliamentary boroughs, and resurrected a county constituency for the whole island. The county electorate included freeholders, qualified by property, in the remaining parliamentary borough. The separate and overlapping Newport representation was abolished in 1885.
The constituency has traditionally been a battleground between the Conservatives and the Liberal Democrats and their predecessors. The seat was held by a Liberal from 1974 until 1987,[8][9][10] a Conservative until 1997, a Liberal Democrat until 2001,[10][11] and a Conservative since then.[11] At the 2015 election, the incumbent Conservative scored one of his party's largest reductions in vote in that year's election similarly to the Liberal Democrat who finished in fifth place.
In the 2017 general election, Nick Belfitt, the Liberal Democrat candidate, became the youngest ever candidate to stand for the seat at the age of 23.[12]
Members of Parliament
Pre 1832
- 1654: Lord Lisle; William Sydenham
Since 1832
Elections
Elections in the 2010s
| Party | Candidate | Votes | % | ± | |
|---|---|---|---|---|---|
| Conservative | Bob Seely | 38,190 | 51.3 | +10.6 | |
| Labour | Julian Critchley | 17,121 | 23.0 | +10.2 | |
| Green | Vix Lowthion | 12,915 | 17.3 | +4.0 | |
| Liberal Democrat | Nicholas Belfitt | 2,740 | 3.7 | -3.8 | |
| UKIP | Daryll Pitcher | 1,921 | 2.6 | -18.6 | |
| Independent | Julie Jones-Evans | 1,592 | 2.1 | N/A | |
| Majority | 21,069 | 28.3 | +8.8 | ||
| Turnout | 74,479 | 67.3 | +2.3 | ||
| Registered electors | 110,683 | ||||
| Conservative hold | Swing | +0.2 | |||
| Party | Candidate | Votes | % | ± | |
|---|---|---|---|---|---|
| Conservative | Andrew Turner[24] | 28,591 | 40.7 | -6.0 | |
| UKIP | Iain McKie[25] | 14,888 | 21.2 | +17.7 | |
| Green | Vix Lowthion[26] | 9,404 | 13.4 | +12.1 | |
| Labour | Stewart Blackmore[24] | 8,984 | 12.8 | +1.2 | |
| Liberal Democrat | David Goodall[27] | 5,235 | 7.5 | -24.2 | |
| Independent | Ian Stephens[28] | 3,198 | 4.5 | N/A | |
| Majority | 13,703 | 19.5 | +4.5 | ||
| Turnout | 70,300 | 65.0 | +1.1 | ||
| Registered electors | 108,804 | ||||
| Conservative hold | Swing | -11.8 | |||
| Party | Candidate | Votes | % | ± | |
|---|---|---|---|---|---|
| Conservative | Andrew Turner | 32,810 | 46.7 | −2.3 | |
| Liberal Democrat | Jill Wareham | 22,283 | 31.7 | +2.2 | |
| Labour | Mark Chiverton | 8,169 | 11.6 | −5.6 | |
| UKIP | Michael Tarrant | 2,435 | 3.5 | +0.1 | |
| BNP | Geoff Clynch | 1,457 | 2.1 | N/A | |
| English Democrat | Ian Dunsire | 1,233 | 1.8 | N/A | |
| Green | Bob Keats | 931 | 1.3 | N/A | |
| Middle England Party | Paul Martin | 616 | 0.9 | N/A | |
| Independent | Pete Harris | 175 | 0.2 | N/A | |
| Independent | Paul Randle-Jolliffe | 89 | 0.1 | N/A | |
| Independent | Edward Corby | 66 | 0.1 | −0.7 | |
| Majority | 10,527 | 15.0 | -4.4 | ||
| Turnout | 70,264 | 63.9 | +2.6 | ||
| Registered electors | 109,922 | ||||
| Conservative hold | Swing | -2.2 | |||
Elections in the 2000s
| Party | Candidate | Votes | % | ± | |
|---|---|---|---|---|---|
| Conservative | Andrew Turner | 32,717 | 48.9 | +9.2 | |
| Liberal Democrat | Anthony Rowlands | 19,739 | 29.5 | −5.8 | |
| Labour | Mark Chiverton | 11,484 | 17.2 | +2.0 | |
| UKIP | Michael Tarrant | 2,352 | 3.5 | +0.2 | |
| Independent | Edward Corby | 551 | 0.8 | N/A | |
| Majority | 12,978 | 19.4 | -4.4 | ||
| Turnout | 66,843 | 61.3 | +0.5 | ||
| Registered electors | 107,737 | ||||
| Conservative hold | Swing | +7.5 | |||
| Party | Candidate | Votes | % | ± | |
|---|---|---|---|---|---|
| Conservative | Andrew Turner | 25,223 | 39.7 | +5.7 | |
| Liberal Democrat | Peter Brand | 22,397 | 35.3 | −7.5 | |
| Labour | Deborah Gardiner | 9,676 | 15.2 | +2.1 | |
| UKIP | David Lott | 2,106 | 3.3 | +1.9 | |
| Independent | David Holmes | 1,423 | 2.2 | N/A | |
| Green | Paul Scivier | 1,279 | 2.0 | +1.3 | |
| Isle of Wight Party | Philip Murray | 1,164 | 1.8 | N/A | |
| Socialist Labour | James Spensley | 214 | 0.3 | N/A | |
| Majority | 2,826 | 4.4 | N/A | ||
| Turnout | 63,482 | 60.8 | −11.2 | ||
| Registered electors | 104,431 | ||||
| Conservative gain from Liberal Democrat | Swing | -6.6 | |||
Elections in the 1990s
| Party | Candidate | Votes | % | ± | |
|---|---|---|---|---|---|
| Liberal Democrat | Peter Brand | 31,274 | 42.7 | −2.9 | |
| Conservative | Andrew Turner | 24,868 | 34.0 | −13.9 | |
| Labour | Deborah Gardiner | 9,646 | 13.2 | +7.2 | |
| Referendum | Tim Bristow | 4,734 | 6.5 | N/A | |
| UKIP | Malcom Turner | 1,072 | 1.5 | N/A | |
| Independent | Harry Rees | 848 | 1.2 | N/A | |
| Green | Paul Scivier | 544 | 0.7 | N/A | |
| Natural Law | Clive Daly | 87 | 0.1 | −0.3 | |
| Rainbow Warriors | Jonathan Eveleigh | 86 | 0.1 | N/A | |
| Majority | 6,406 | 8.6 | N/A | ||
| Turnout | 74,193 | 72.0 | −7.8 | ||
| Registered electors | 101,680 | ||||
| Liberal Democrat gain from Conservative | Swing | +8.4 | |||
| Party | Candidate | Votes | % | ± | |
|---|---|---|---|---|---|
| Conservative | Barry Field | 38,163 | 47.9 | −3.3 | |
| Liberal Democrat | Peter Brand | 36,336 | 45.6 | +2.7 | |
| Labour | Ken Pearson | 4,784 | 6.0 | +0.1 | |
| Natural Law | Clive Daly | 350 | 0.4 | N/A | |
| Majority | 1,827 | 2.3 | −6.0 | ||
| Turnout | 79,633 | 79.8 | +0.2 | ||
| Registered electors | 99,839 | ||||
| Conservative hold | Swing | −3.0 | |||
Elections in the 1980s
| Party | Candidate | Votes | % | ± | |
|---|---|---|---|---|---|
| Conservative | Barry Field | 40,175 | 51.2 | +4.9 | |
| Liberal | Michael Young | 33,733 | 42.9 | −8.1 | |
| Labour | Kenn Pearson | 4,626 | 5.9 | +3.5 | |
| Majority | 6,442 | 8.3 | N/A | ||
| Turnout | 78,560 | 79.6 | -0.4 | ||
| Registered electors | 98,694 | ||||
| Conservative gain from Liberal | Swing | ||||
| Party | Candidate | Votes | % | ± | |
|---|---|---|---|---|---|
| Liberal | Stephen Ross | 38,407 | 51.0 | +2.8 | |
| Conservative | Virginia Bottomley | 34,904 | 46.3 | -1.4 | |
| Labour | Catherine Wilson | 1,828 | 2.4 | -1.6 | |
| Isle of Wight Residents Party | Thomas McDermott | 208 | 0.3 | N/A | |
| Majority | 3,503 | 4.7 | +4.2 | ||
| Turnout | 75,347 | 80.0 | -1.8 | ||
| Registered electors | 94,226 | ||||
| Liberal hold | Swing | ||||
Elections in the 1970s
| Party | Candidate | Votes | % | ± | |
|---|---|---|---|---|---|
| Liberal | Stephen Ross | 35,889 | 48.2 | +3.1 | |
| Conservative | Dudley Fishburn | 35,537 | 47.7 | +5.7 | |
| Labour | C Wilson | 3,014 | 4.0 | -9 | |
| Majority | 352 | 0.5 | -2.6 | ||
| Turnout | 74,440 | 81.8 | +5.1 | ||
| Registered electors | 90,961 | ||||
| Liberal hold | Swing | ||||
| Party | Candidate | Votes | % | ± | |
|---|---|---|---|---|---|
| Liberal | Stephen Ross | 29,697 | 45.1 | -5.1 | |
| Conservative | Dudley Fishburn | 27,657 | 42.0 | +3.0 | |
| Labour | L.D. Brooke | 8,562 | 13.0 | +2.2 | |
| Majority | 2,040 | 3.1 | -8.1 | ||
| Turnout | 65,916 | 76.7 | -4.7 | ||
| Registered electors | 85,897 | ||||
| Liberal hold | Swing | ||||
| Party | Candidate | Votes | % | ± | |
|---|---|---|---|---|---|
| Liberal | Stephen Ross | 34,808 | 50.2 | +28.0 | |
| Conservative | Mark Woodnutt | 27,042 | 39.0 | -13.4 | |
| Labour | TC Bisson | 7,495 | 10.8 | -11.8 | |
| Majority | 7,766 | 11.2 | N/A | ||
| Turnout | 69,345 | 81.4 | +9.4 | ||
| Registered electors | 85,208 | ||||
| Liberal gain from Conservative | Swing | ||||
| Party | Candidate | Votes | % | ± | |
|---|---|---|---|---|---|
| Conservative | Mark Woodnutt | 30,437 | 52.4 | +3.8 | |
| Labour | Kent Boulton | 13,111 | 22.6 | -6.4 | |
| Liberal | Stephen Ross | 12,883 | 22.2 | -0.2 | |
| Vectis National Party | Ronald W.J Cowdell | 1,607 | 2.8 | N/A | |
| Majority | 17,326 | 29.8 | +10.2 | ||
| Turnout | 58,038 | 72.0 | -3.0 | ||
| Registered electors | 80,537 | ||||
| Conservative hold | Swing | ||||
Elections in the 1960s
| Party | Candidate | Votes | % | ± | |
|---|---|---|---|---|---|
| Conservative | Mark Woodnutt | 25,862 | 48.6 | -4.9 | |
| Labour | Peter Stephenson | 15,411 | 29.0 | -2.6 | |
| Liberal | Stephen Ross | 11,915 | 22.4 | +7.5 | |
| Majority | 10,451 | 19.6 | -2.3 | ||
| Turnout | 53,188 | 75.0 | +0.7 | ||
| Registered electors | 70,877 | ||||
| Conservative hold | Swing | ||||
| Party | Candidate | Votes | % | ± | |
|---|---|---|---|---|---|
| Conservative | Mark Woodnutt | 27,497 | 53.5 | -9.4 | |
| Labour | William Mann | 16,244 | 31.6 | -5.5 | |
| Liberal | Barbara Bliss | 7,666 | 14.9 | N/A | |
| Majority | 11,253 | 21.9 | -4.0 | ||
| Turnout | 51,407 | 74.3 | +0.2 | ||
| Registered electors | 69,215 | ||||
| Conservative hold | Swing | ||||
Elections in the 1950s
| Party | Candidate | Votes | % | ± | |
|---|---|---|---|---|---|
| Conservative | Mark Woodnutt | 31,228 | 62.9 | +0.3 | |
| Labour | Edward Cecil Amey | 18,396 | 37.1 | -0.3 | |
| Majority | 12,832 | 25.9 | +0.6 | ||
| Turnout | 49,624 | 74.1 | -0.3 | ||
| Registered electors | 66,939 | ||||
| Conservative hold | Swing | ||||
| Party | Candidate | Votes | % | ± | |
|---|---|---|---|---|---|
| Conservative | Peter Macdonald | 31,335 | 62.6 | +0.8 | |
| Labour | Sydney Conbeer | 18,698 | 37.4 | -0.8 | |
| Majority | 12,637 | 25.3 | +1.7 | ||
| Turnout | 50,033 | 74.4 | -5.9 | ||
| Registered electors | 67,297 | ||||
| Conservative hold | Swing | ||||
| Party | Candidate | Votes | % | ± | |
|---|---|---|---|---|---|
| Conservative | Peter Macdonald | 33,501 | 61.8 | +1.3 | |
| Labour | Sydney Conbeer | 20,712 | 38.2 | -1.3 | |
| Majority | 12,789 | 23.6 | +2.5 | ||
| Turnout | 54,213 | 80.3 | -0.3 | ||
| Registered electors | 67,501 | ||||
| Conservative hold | Swing | ||||
| Party | Candidate | Votes | % | ± | |
|---|---|---|---|---|---|
| Conservative | Peter Macdonald | 32,984 | 60.5 | +13.9 | |
| Labour | Sydney Conbeer | 21,496 | 39.5 | -1.2 | |
| Majority | 11,488 | 21.1 | +15.2 | ||
| Turnout | 54,480 | 80.6 | +4.6 | ||
| Registered electors | 67,581 | ||||
| Conservative hold | Swing | ||||
Elections in the 1940s
| Party | Candidate | Votes | % | ± | |
|---|---|---|---|---|---|
| Conservative | Peter Macdonald | 22,036 | 46.6 | -16.58 | |
| Labour | William Miller | 19,252 | 40.7 | +3.87 | |
| Liberal | May O'Conor | 5,967 | 12.6 | +12.6 | |
| Majority | 2,784 | 5.9 | -20.47 | ||
| Turnout | 47,255 | 76.0 | +6.56 | ||
| Registered electors | 62,364 | ||||
| Conservative hold | Swing | ||||
General Election 1939/40
Another general election was required to take place before the end of 1940. The political parties had been making preparations for an election to take place from 1939 and by the end of this year, the following candidates had been selected;
- Conservative: Peter Macdonald
- Labour: Robert Arthur Lyster
- Liberal: Helen de Guerry Browne
Elections in the 1930s
| Party | Candidate | Votes | % | ± | |
|---|---|---|---|---|---|
| Conservative | Peter Macdonald | 26,748 | 63.18 | -14.07 | |
| Labour | William Miller | 15,586 | 36.83 | +14.07 | |
| Majority | 11,162 | 26.37 | -28.13 | ||
| Turnout | 42,334 | 69.44 | -1.68 | ||
| Registered electors | 60,965 | ||||
| Conservative hold | Swing | ||||
| Party | Candidate | Votes | % | ± | |
|---|---|---|---|---|---|
| Conservative | Peter Macdonald | 32,728 | 77.25 | +29.05 | |
| Labour | James Drummond | 9,639 | 22.75 | +9.05 | |
| Majority | 23,089 | 54.50 | +44.50 | ||
| Turnout | 42,367 | 71.12 | -7.88 | ||
| Registered electors | 59,574 | ||||
| Conservative hold | Swing | ||||
Elections in the 1920s
| Party | Candidate | Votes | % | ± | |
|---|---|---|---|---|---|
| Unionist | Peter Macdonald | 21,949 | 48.2 | -4.2 | |
| Liberal | St John Hutchinson | 17,383 | 38.1 | +0.3 | |
| Labour | Henry Edward Weaver | 6,256 | 13.7 | +3.9 | |
| Majority | 4,566 | 10.1 | -4.5 | ||
| Turnout | 45,588 | 79.0 | -1.1 | ||
| Registered electors | 57,693 | ||||
| Unionist hold | Swing | -2.3 | |||
| Party | Candidate | Votes | % | ± | |
|---|---|---|---|---|---|
| Unionist | Peter Macdonald | 19,346 | 52.4 | +6.1 | |
| Liberal | John Seely | 13,944 | 37.8 | -8.8 | |
| Labour | Henry Edward Weaver | 3,620 | 9.8 | +2.7 | |
| Majority | 5,402 | 14.6 | N/A | ||
| Turnout | 36,910 | 80.1 | +4.5 | ||
| Registered electors | 46,052 | ||||
| Unionist gain from Liberal | Swing | +7.5 | |||
| Party | Candidate | Votes | % | ± | |
|---|---|---|---|---|---|
| Liberal | John Seely | 16,249 | 46.6 | +10.4 | |
| Unionist | Peter Macdonald | 16,159 | 46.3 | +14.7 | |
| Labour | Emily Palmer | 2,475 | 7.1 | -4.1 | |
| Majority | 90 | 0.3 | -4.3 | ||
| Turnout | 34,883 | 76.6 | +1.2 | ||
| Registered electors | 45,530 | ||||
| Liberal hold | Swing | -2.2 | |||
| Party | Candidate | Votes | % | ± | |
|---|---|---|---|---|---|
| Liberal | Edgar Chatfeild-Clarke | 12,202 | 36.2 | -4.6 | |
| Unionist | John Perowne | 10,620 | 31.6 | -27.6 | |
| Independent Unionist | Arthur Veasey | 7,061 | 21.0 | N/A | |
| Labour | Harold Shearman | 3,756 | 11.2 | N/A | |
| Majority | 1,582 | 4.6 | N/A | ||
| Turnout | 33,639 | 75.4 | +9.9 | ||
| Registered electors | 44,637 | ||||
| Liberal gain from Unionist | Swing | +11.5 | |||
Elections in the 1910s
| Party | Candidate | Votes | % | ± | |
|---|---|---|---|---|---|
| C | Unionist | Douglas Hall | 16,274 | 59.2 | +8.4 |
| Liberal | Godfrey Baring | 11,235 | 40.8 | -8.4 | |
| Majority | 5,039 | 18.4 | +16.8 | ||
| Turnout | 27,509 | 65.5 | -23.2 | ||
| Registered electors | 42,013 | ||||
| Unionist hold | Swing | +8.4 | |||
| C indicates candidate endorsed by the coalition government. | |||||
Another General Election was required to take place before the end of 1915. The political parties had been making preparations for an election to take place and by the July 1914, the following candidates had been selected;
- Unionist: Douglas Bernard Hall
- Liberal: Sir Godfrey Baring

| Party | Candidate | Votes | % | ± | |
|---|---|---|---|---|---|
| Conservative | Douglas Hall | 7,192 | 50.8 | -0.2 | |
| Liberal | Constantine Scaramanga-Ralli | 6,969 | 49.2 | +0.2 | |
| Turnout | 14,161 | 88.7 | -2.3 | ||
| Majority | 223 | 1.6 | -0.4 | ||
| Registered electors | 15,969 | ||||
| Conservative hold | Swing | -0.2 | |||
| Party | Candidate | Votes | % | ± | |
|---|---|---|---|---|---|
| Conservative | Douglas Hall | 7,414 | 51.0 | +6.8 | |
| Liberal | Godfrey Baring | 7,123 | 49.0 | -6.8 | |
| Majority | 291 | 2.0 | N/A | ||
| Turnout | 14,537 | 91.0 | -3.2 | ||
| Registered electors | 15,969 | ||||
| Conservative gain from Liberal | Swing | +6.8 | |||
Elections in the 1900s
| Party | Candidate | Votes | % | ± | |
|---|---|---|---|---|---|
| Liberal | Godfrey Baring | 7,453 | 55.8 | N/A | |
| Conservative | Anthony Hickman Morgan | 5,892 | 44.2 | N/A | |
| Majority | 1,561 | 11.6 | N/A | ||
| Turnout | 13,345 | 87.8 | N/A | ||
| Registered electors | 15,193 | ||||
| Liberal gain from Conservative | Swing | N/A | |||

| Party | Candidate | Votes | % | ± | |
|---|---|---|---|---|---|
| Ind. Conservative | John Seely | Unopposed | |||
| Registered electors | |||||
| Ind. Conservative gain from Conservative | |||||
| Party | Candidate | Votes | % | ± | |
|---|---|---|---|---|---|
| Conservative | John Seely | Unopposed | |||
| Registered electors | 14,494 | ||||
| Conservative hold | |||||
| Party | Candidate | Votes | % | ± | |
|---|---|---|---|---|---|
| Conservative | John Seely | 6,432 | 54.5 | +2.5 | |
| Liberal | Godfrey Baring | 5,370 | 45.5 | -2.5 | |
| Majority | 1,062 | 9.0 | +5.0 | ||
| Turnout | 11,802 | 81.4 | +0.5 | ||
| Registered electors | 14,494 | ||||
| Conservative hold | Swing | +2.5 | |||
Elections in the 1890s
| Party | Candidate | Votes | % | ± | |
|---|---|---|---|---|---|
| Conservative | Richard Webster | 5,809 | 52.0 | -0.1 | |
| Liberal | Armine Wodehouse | 5,363 | 48.0 | +0.1 | |
| Majority | 446 | 4.0 | -0.2 | ||
| Turnout | 11,172 | 80.9 | -3.5 | ||
| Registered electors | 13,816 | ||||
| Conservative hold | Swing | -0.1 | |||
| Party | Candidate | Votes | % | ± | |
|---|---|---|---|---|---|
| Conservative | Richard Webster | 5,699 | 52.1 | -4.7 | |
| Liberal | Sigismund Mendl | 5,238 | 47.9 | +4.7 | |
| Majority | 461 | 4.2 | -9.4 | ||
| Turnout | 10,937 | 84.4 | +6.7 | ||
| Registered electors | 12,957 | ||||
| Conservative hold | Swing | -4.7 | |||
Elections in the 1880s
| Party | Candidate | Votes | % | ± | |
|---|---|---|---|---|---|
| Conservative | Richard Webster | Unopposed | |||
| Registered electors | 11,943 | ||||
| Conservative hold | |||||
- Caused by Webster's appointment as Attorney General of England and Wales.
| Party | Candidate | Votes | % | ± | |
|---|---|---|---|---|---|
| Conservative | Richard Webster | 5,271 | 56.8 | +4.7 | |
| Liberal | John Stuart[48] | 4,013 | 43.2 | -4.7 | |
| Majority | 1,258 | 13.6 | +9.4 | ||
| Turnout | 9,284 | 77.7 | -10.7 | ||
| Registered electors | 11,943 | ||||
| Conservative hold | Swing | +4.7 | |||
| Party | Candidate | Votes | % | ± | |
|---|---|---|---|---|---|
| Conservative | Richard Webster | 5,495 | 52.1 | +2.3 | |
| Liberal | Evelyn Ashley | 5,059 | 47.9 | -2.3 | |
| Majority | 436 | 4.2 | N/A | ||
| Turnout | 10,554 | 88.4 | +8.5 | ||
| Registered electors | 11,943 | ||||
| Conservative gain from Liberal | Swing | +2.3 | |||
| Party | Candidate | Votes | % | ± | |
|---|---|---|---|---|---|
| Liberal | Evelyn Ashley | 1,986 | 50.2 | +0.3 | |
| Conservative | Benjamin Temple Cotton[50] | 1,973 | 49.8 | -0.3 | |
| Majority | 13 | 0.3 | N/A | ||
| Turnout | 3,959 | 79.9 | +1.1 | ||
| Registered electors | 4,954 | ||||
| Liberal gain from Conservative | Swing | +0.3 | |||
Elections in the 1870s
| Party | Candidate | Votes | % | ± | |
|---|---|---|---|---|---|
| Conservative | Alexander Baillie-Cochrane | 1,614 | 50.1 | +4.9 | |
| Liberal | Evelyn Ashley | 1,605 | 49.9 | -4.9 | |
| Majority | 9 | 0.3 | N/A | ||
| Turnout | 3,219 | 78.8 | +13.9 | ||
| Registered electors | 4,084 | ||||
| Conservative gain from Liberal | Swing | +4.9 | |||
| Party | Candidate | Votes | % | ± | |
|---|---|---|---|---|---|
| Conservative | Alexander Baillie-Cochrane | 1,317 | 50.7 | +5.5 | |
| Liberal | George Moffatt[51] | 1,282 | 49.3 | -5.5 | |
| Majority | 35 | 1.3 | N/A | ||
| Turnout | 2,599 | 68.3 | +3.4 | ||
| Registered electors | 3,807 | ||||
| Conservative gain from Liberal | Swing | +5.5 | |||
- Caused by Simeon's death.
Elections in the 1860s
| Party | Candidate | Votes | % | ± | |
|---|---|---|---|---|---|
| Liberal | John Simeon | 1,353 | 54.8 | +2.3 | |
| Conservative | Alexander Baillie-Cochrane | 1,118 | 45.2 | -2.3 | |
| Majority | 235 | 9.5 | +4.4 | ||
| Turnout | 2,471 | 64.9 | +0.3 | ||
| Registered electors | 3,807 | ||||
| Liberal hold | Swing | +2.3 | |||
| Party | Candidate | Votes | % | ± | |
|---|---|---|---|---|---|
| Liberal | John Simeon | 786 | 52.5 | +0.4 | |
| Conservative | Charles Locock | 710 | 47.5 | −0.4 | |
| Majority | 76 | 5.1 | +0.8 | ||
| Turnout | 1,496 | 64.6 | −6.5 | ||
| Registered electors | 2,315 | ||||
| Liberal hold | Swing | +0.4 | |||
Elections in the 1850s
| Party | Candidate | Votes | % | ± | |
|---|---|---|---|---|---|
| Liberal | Charles Clifford | 756 | 52.1 | −2.4 | |
| Conservative | Francis Venables-Vernon-Harcourt | 694 | 47.9 | +2.4 | |
| Majority | 62 | 4.3 | −4.7 | ||
| Turnout | 1,450 | 71.1 | +2.3 | ||
| Registered electors | 2,038 | ||||
| Liberal hold | Swing | −2.4 | |||
| Party | Candidate | Votes | % | ± | |
|---|---|---|---|---|---|
| Whig | Charles Clifford | 730 | 54.5 | +8.0 | |
| Conservative | Thomas Willis Fleming | 610 | 45.5 | −8.0 | |
| Majority | 120 | 9.0 | N/A | ||
| Turnout | 1,340 | 68.8 | −8.4 | ||
| Registered electors | 1,949 | ||||
| Whig gain from Conservative | Swing | +8.0 | |||
| Party | Candidate | Votes | % | ± | |
|---|---|---|---|---|---|
| Conservative | Francis Venables-Vernon-Harcourt | 681 | 53.5 | ||
| Radical | Edward Dawes | 593 | 46.5 | ||
| Majority | 88 | 6.9 | |||
| Turnout | 1,274 | 77.2 | |||
| Registered electors | 1,650 | ||||
| Conservative gain from Whig | Swing | ||||
| Party | Candidate | Votes | % | ± | |
|---|---|---|---|---|---|
| Radical | Edward Dawes | 565 | 52.1 | ||
| Conservative | Andrew Snape Hamond[52] | 519 | 47.9 | ||
| Majority | 46 | 4.2 | |||
| Turnout | 1,084 | 65.7 | |||
| Registered electors | 1,650 | ||||
| Radical gain from Whig | Swing | ||||
- Caused by Simeon's resignation after he converted from Anglicanism to Catholicism.[53]
See also
External links
- Politics Resources (Election results from 1922 onwards)
- Electoral Calculus (Election results from 1955 onwards)
- 2017 Election House Of Commons Library 2017 Election report
- A Vision Of Britain Through Time (Constituency elector numbers)
Notes and references
- Notes
- ↑ A county constituency (for the purposes of election expenses and type of returning officer)
- ↑ As with all constituencies, the constituency elects one Member of Parliament (MP) by the first past the post system of election at least every five years
- References
- ↑ "Parliamentary Electors by Parliamentary Constituencies 2010–2015". Office for National Statistics. 24 February 2016. Retrieved 17 February 2017.
- ↑ "Wight". Oxford Dictionaries. Oxford University Press. Retrieved 2016-01-20.
- 1 2 "Electorate Figures – Boundary Commission for England". Archived from the original on 6 November 2010.
- ↑ "The Bow Group "Crossbow" – 50th Anniversary edition (page 41)" (PDF). www.bowgroup.org. Retrieved 27 October 2008.
- ↑ "Boundary Commission for England – Isle of Wight". www.statistics.gov.uk. Archived from the original on 4 July 2008. Retrieved 26 October 2008.
- ↑ "Isle of Wight 'two constituencies' by 2020 says MP". BBC News. Retrieved 29 April 2017.
- ↑ Initial Proposal South East Boundary Commission for England
- 1 2 "UK General Election results – October 1974". www.politicsresources.net. Retrieved 27 October 2008.
- 1 2 "UK General Election results – May 1979". www.politicsresources.net. Retrieved 27 October 2008.
- 1 2 3 4 5 "British Parliamentary Election Results 1983–1997". www.election.demon.co.uk. Retrieved 26 October 2008.
- 1 2 3 4 "BBC News – Results and Constituencies – Isle of Wight". www.bbc.co.uk. Retrieved 27 October 2008.
- ↑ http://www.iwcp.co.uk/news/Isle-of-Wight-Lib-Dems-put-forward-youngest-candidate-on-Island-314870.aspx
- ↑ Leigh Rayment's Historical List of MPs – Constituencies beginning with "I"
- ↑ "Illustrated London News". 31 July 1847. p. 7. Retrieved 4 August 2018 – via British Newspaper Archive. (Subscription required (help)).
- ↑ "General Election". London Evening Standard. 7 August 1847. p. 3. Retrieved 4 August 2018 – via British Newspaper Archive. (Subscription required (help)).
- ↑ "Bell's Weekly Messenger". 16 August 1847. p. 2. Retrieved 4 August 2018 – via British Newspaper Archive. (Subscription required (help)).
- ↑ "Hampshire Advertiser". 24 May 1851. p. 5. Retrieved 4 August 2018 – via British Newspaper Archive. (Subscription required (help)).
- ↑ "Isle of Wight Election". Berkshire Chronicle. 24 July 1852. p. 8. Retrieved 4 August 2018 – via British Newspaper Archive. (Subscription required (help)).
- ↑ "Election Matters". Lancaster Gazette. 24 July 1852. p. 8. Retrieved 4 August 2018 – via British Newspaper Archive. (Subscription required (help)).
- ↑ "Old Borough Members of Parliament Without Seats". Devizes and Wiltshire Gazette. 9 April 1857. p. 4. Retrieved 4 August 2018 – via British Newspaper Archive. (Subscription required (help)).
- ↑ "Isle of Wight LibDem MP hopeful one of youngest in country". 22 April 2017.
- ↑ "Isle of Wight Green Party reselects Vix Lowthion as Parliamentary Candidate". isleofwight.greenparty.org.uk.
- ↑ "Election Data 2015". Electoral Calculus. Archived from the original on 17 October 2015. Retrieved 17 October 2015.
- 1 2 "ISLE OF WIGHT 2015". electionresults.blogspot.co.uk.
- ↑ http://iainmckie.co.uk/
- ↑ "Isle of Wight Green Party announce parliamentary candidate". isleofwight.greenparty.org.uk.
- ↑ "Campaign Launch".
- ↑ "Ian Stephens to stand as Independent candidate for Isle of Wight MP". Isle of Wight News from OnTheWight. 22 January 2015.
- ↑ Statement of Persons Nominated Archived 12 June 2011 at the Wayback Machine., Isle of Wight Council
- ↑ "Island set for race to be next MP". www.iwcp.co.uk.
- ↑ "IWight – Isle of Wight General election results 2005". www.iwight.gov.uk. Archived from the original on 10 September 2009. Retrieved 27 October 2008.
- ↑ "Politics Resources". Election 1992. Politics Resources. 9 April 1992. Retrieved 6 December 2010.
- ↑ "UK General Election results – February 1974". www.politicsresources.net. Retrieved 27 October 2008.
- ↑ "UK General Election results – June 1970". www.politicsresources.net. Retrieved 27 October 2008.
- ↑ "UK General Election results – March 1966". www.politicsresources.net. Retrieved 27 October 2008.
- ↑ "UK General Election results – March 1964". www.politicsresources.net. Retrieved 27 October 2008.
- ↑ "UK General Election results – October 1959". www.politicsresources.net. Retrieved 27 October 2008.
- ↑ "UK General Election results – May 1955". www.politicsresources.net. Retrieved 27 October 2008.
- ↑ "UK General Election results – October 1951". www.politicsresources.net. Retrieved 27 October 2008.
- ↑ "UK General Election results – February 1950". www.politicsresources.net. Retrieved 27 October 2008.
- ↑ "UK General Election results – July 1945". www.politicsresources.net. Retrieved 27 October 2008.
- ↑ "UK General Election results – 1935". www.politicsresources.net. Retrieved 16 September 2011.
- ↑ British parliamentary election results 1918–1949, Craig, F.W.S.
- ↑ British parliamentary election results 1885–1918
- 1 2 3 4 5 6 7 British parliamentary election results, 1885–1918 (Craig)
- ↑ The Constitutional Year Book, 1904, published by Conservative Central Office, page 145 (169 in web page), Isle of Wight
- 1 2 3 Craig, FWS, ed. (1974). British Parliamentary Election Results: 1885-1918. London: Macmillan Press. ISBN 9781349022984.
- ↑ "Mr. John Stuart in the Isle of Wight". Hastings & St. Leonards Observer. 3 July 1886. p. 2. Retrieved 1 December 2017 – via British Newspaper Archive. (Subscription required (help)).
- 1 2 3 4 5 6 7 8 9 Craig, F. W. S., ed. (1977). British Parliamentary Election Results 1832-1885 (e-book)
|format=requires|url=(help) (1st ed.). London: Macmillan Press. ISBN 978-1-349-02349-3. - ↑ "The Isle of Wight". Hampshire Advertiser. 7 February 1880. p. 8. Retrieved 1 December 2017 – via British Newspaper Archive. (Subscription required (help)).
- ↑ "Isle of Wight". Nottinghamshire Guardian. 27 May 1870. p. 12. Retrieved 1 January 2018 – via British Newspaper Archive. (Subscription required (help)).
- ↑ "Portsmouth Times and Naval Gazette". 10 May 1851. p. 5. Retrieved 4 August 2018 – via British Newspaper Archive. (Subscription required (help)).
- ↑ "The Last Days of Sir John Simeon", The Month: A Magazine and Review new series, vol. II (XIII), July to December 1870, pp. 481-484.