Blackburn (UK Parliament constituency)
| Blackburn | |
|---|---|
|
Borough constituency for the House of Commons | |
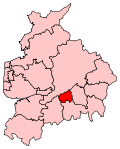 Boundary of Blackburn in Lancashire. | |
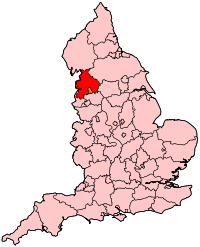 Location of Lancashire within England. | |
| County | Lancashire |
| Population | 107,246 (2011 census)[1] |
| Electorate | 72,112 (December 2010)[2] |
| Major settlements | Blackburn |
| Current constituency | |
| Created | 1955 |
| Member of parliament | Kate Hollern (Labour) |
| Number of members | One |
| Created from | Blackburn East and Blackburn West |
| 1832–1950 | |
| Number of members | Two |
| Type of constituency | Borough constituency |
| Replaced by |
Blackburn East Blackburn West |
| Created from | Lancashire |
| Overlaps | |
| European Parliament constituency | North West England |
Blackburn is a constituency[n 1] represented in the House of Commons of the UK Parliament since 2015 by Kate Hollern of the Labour Party.[n 2]
Constituency profile
It has elected Labour MPs since its re-creation in 1955.
Boundaries
The constituency encompasses the town of Blackburn in the North West of England. It borders four other constituencies: Ribble Valley to the north, Hyndburn to the east, Rossendale and Darwen to the south and Chorley to the west.
Following the review of parliamentary representation in Lancashire, including the unitary authority of Blackburn with Darwen in the run up to the United Kingdom general election, 2010 the Boundary Commission for England made minor boundary changes to the existing constituency.
The electoral wards in the Blackburn seat fought at the UK general election in 2010 were entirely within the district of Blackburn with Darwen.
- Audley, Bastwell, Beardwood and Lammack, Corporation Park, Ewood, Higher Croft, Little Harwood, Livesey with Pleasington, Meadowhead, Mill Hill, Queen's Park, Roe Lee, Shadsworth with Whitebirk, Shear Brow and Wensley Fold.
History
For more details, see the Politics section of the Blackburn article.
Blackburn was first enfranchised by the Reform Act 1832, as a two-member constituency, and was first used at the 1832–33 General Election. It was abolished for the 1950 General Election, when it was then replaced by two new single member constituencies, Blackburn East and Blackburn West.
Blackburn was re-established as a single-member constituency for the 1955 General Election, partially replacing the Blackburn East and Blackburn West constituencies which had been created only five years earlier. After its re-establishment in 1955, the constituency was initially a marginal, but Blackburn is now considered to be a Labour Party stronghold.
2005 General election
Blackburn's MP, Jack Straw, was challenged in the 2005 General Election primarily again by the Conservative Party but the former British ambassador to Uzbekistan, Craig Murray also stood for election in Blackburn. Murray said: "I've been approached by several people in the Asian community who are under huge pressure from Labour activists [talking up the BNP's chances] to apply for a postal vote rather than a ballot vote and then hand their postal vote over to the Labour party." Over 50% more people used postal votes in the 2005 General Election in Blackburn than in 2001.[3] Unlike in 1997 and 2001, the BNP had a candidate, who polled 5.4% of the vote.
2015 General Election
In August 2011, Jack Straw announced he had no plans to retire, despite hitting 65 earlier that month.[4]
On 25 October 2013, Straw announced that he would stand down as Blackburn's MP at the next election.[5] In March 2014, Kate Hollern was selected, via an all women shortlist, as the candidate for Labour for the 2015 General Election, and held the seat.
Members of Parliament
Two-member constituency (1832–1950)
Single member constituency (1955–present)
| Election | Member[6] | Party | |
|---|---|---|---|
| 1955 | constituency re-established | ||
| 1955 | Barbara Castle | Labour | |
| 1979 | Jack Straw | Labour | |
| 2015 | Independent | ||
| 2015 | Kate Hollern | Labour | |
Elections
Elections since 1955
| Election | Political result | Candidate | Party | Votes | % | ±% | ||
|---|---|---|---|---|---|---|---|---|
| General Election 2017 Turnout: 47,512 (67.2%) +7.1 | Labour hold Majority: 20,368 (42.9%) +13.9 Swing: +6.95% from Con to Lab | Kate Hollern | Labour | 33,148 | 69.8 | +13.5 | ||
| Bob Eastwood | Conservative | 12,780 | 26.9 | -0.4 | ||||
| Duncan Miller | Independent | 875 | 1.8 | N/A | ||||
| Irfan Ahmed | Liberal Democrat | 709 | 1.5 | -0.7 | ||||
| General Election 2015 [13][14] Electorate: 73,251 Turnout: 43,999 (60.1%) –1.8 | Labour hold Majority: 12,760 (29.0%) +8.3 Swing: +3.7% from Con to Lab | Kate Hollern | Labour | 24,762 | 56.3 | +8.5 | ||
| Bob Eastwood | Conservative | 12,002 | 27.3 | +1.1 | ||||
| Dayle Taylor | UKIP | 6,280 | 14.3 | +12.2 | ||||
| Gordon Lishman | Liberal Democrat | 955 | 2.2 | −13.0 | ||||
| General Election 2010 [15][16] Electorate: 72,331 Turnout: 45,499 (62.9%) +5.2 | Labour hold Majority: 9,856 (21.7%) +2.2 Swing: +1.1% from Con to Lab | Jack Straw | Labour | 21,751 | 47.8 | +5.7 | ||
| Michael Law-Riding | Conservative | 11,895 | 26.1 | +3.5 | ||||
| Paul English | Liberal Democrat | 6,918 | 15.2 | -5.4 | ||||
| Robin Evans | BNP | 2,158 | 4.7 | −0.7 | ||||
| Bushra Irfan | Independent | 1,424 | 3.1 | N/A | ||||
| Bobby Anwar | UKIP | 942 | 2.1 | −0.2 | ||||
| Grace Astley | Independent | 238 | 0.5 | N/A | ||||
| Janis Sharp | Independent | 173 | 0.4 | N/A | ||||
| General Election 2005 [17][18] Electorate: 72,707 Turnout: 41,805 (56.9%) +1.4 | Labour hold Majority: 8,009 (19.2%) −3.7 Swing: 1.9% from Lab to Con | Jack Straw | Labour | 17,562 | 42.0 | −12.1 | ||
| Imtiaz Ameen | Conservative | 9,553 | 22.9 | −8.3 | ||||
| Tony Melia | Liberal Democrat | 8,608 | 20.6 | +12.5 | ||||
| Nicholas Holt | BNP | 2,263 | 5.4 | N/A | ||||
| Craig Murray | Independent | 2,082 | 5.0 | N/A | ||||
| Dorothy Baxter | UKIP | 954 | 2.3 | −0.6 | ||||
| Graham Carter | Green | 783 | 1.9 | N/A | ||||
| General Election 2001 [19][20] Electorate: 72,611 Turnout: 40,284 (55.5%) −9.5 | Labour hold Majority: 9,249 (22.9%) −7.5 Swing: 2.9% from Lab to Con | Jack Straw | Labour | 21,808 | 54.1 | −0.9 | ||
| John Cotton | Conservative | 12,559 | 31.2 | +6.6 | ||||
| Imtiaz Patel | Liberal Democrat | 3,264 | 8.1 | −2.4 | ||||
| Dorothy Baxter | UKIP | 1,185 | 2.9 | N/A | ||||
| Terry Cullen | Socialist Labour | 559 | 1.4 | +0.1 | ||||
| Jim Nichol | Socialist Alliance | 532 | 1.3 | N/A | ||||
| Paul Morris | Independent | 377 | 0.9 | −0.1 | ||||
| General Election 1997 [20][21] Electorate: 47,501 Turnout: 47,501 (65.0%) −10.1 | Labour hold Majority: 14,445 (30.4%) +19.4 Swing: 9.7% from Con to Lab | Jack Straw | Labour | 26,141 | 55.0 | +6.6 | ||
| Sangheeta G. Kaur Sidhu | Conservative | 11,696 | 24.6 | −12.9 | ||||
| Stephen J. Fenn | Liberal Democrat | 4,990 | 10.5 | −1.0 | ||||
| David P. Bradshaw | Referendum | 1,892 | 4.0 | N/A | ||||
| Tina Wingfield | National Democrats | 671 | 1.4 | +1.4 | ||||
| Helen Drummond | Socialist Labour | 635 | 1.3 | N/A | ||||
| Robin Field | Green | 608 | 1.3 | −0.3 | ||||
| Margo Carmichael-Grimshaw | Keep Britain Free and Independent Party | 506 | 1.1 | N/A | ||||
| John Batchelor | Common Sense Sick of Politicians | 362 | 0.8 | N/A | ||||
| General Election 1992 [22][23] Electorate: 73,251 Turnout: 54,978 (75.1%) +0.2 | Labour hold Majority: 6,027 (11.0%) +0.2 Swing: 0.6% from Con to Lab | Jack Straw | Labour | 26,633 | 48.4 | −1.5 | ||
| Ross M. Coates | Conservative | 20,606 | 37.5 | −2.6 | ||||
| Derek Mann | Liberal Democrat | 6,332 | 11.5 | +1.1 | ||||
| Robin Field | Green | 878 | 1.6 | N/A | ||||
| Margo Carmichael-Grimshaw | Lodestar Party | 334 | 0.6 | N/A | ||||
| William Ayliffe | Natural Law | 195 | 0.4 | N/A | ||||
| General Election 1987 [24][25] Electorate: 74,801 Turnout: 56,035 (74.9%) −0.3 | Labour hold Majority: 5,497 (9.8%) +3.4 Swing: 2.3% from Con to Lab | Jack Straw | Labour | 27,965 | 49.9 | +5.2 | ||
| Anne Cheetham | Conservative | 22,468 | 40.1 | +0.7 | ||||
| Mohammed Ali | Social Democratic | 5,602 | 10.0 | −4.4 | ||||
| General Election 1983 [26][27] Electorate: 76,078 Turnout: 56,784 (74.6%) +0.5 | Labour hold Majority: 3,055 (5.4%) −8.8 Swing: 4.4% from Lab to Con | Jack Straw | Labour | 25,400 | 44.7 | −6.0 | ||
| Graham C.S. Mather | Conservative | 22,345 | 39.4 | +2.8 | ||||
| Eric B. Fairbrother | Social Democratic | 8,174 | 14.4 | +2.7 | ||||
| David A. Riley | National Front | 864 | 1.5 | 0.0 | ||||
| General Election 1979 [28] Electorate: 52,479 Turnout: 38,813 (73.96%) +1.03 | Labour hold Majority: 5,490 (14.15%) −5.2 Swing: 2.6% from Lab to Con | Jack Straw | Labour | 19,683 | 50.71 | −0.75 | ||
| Ian D. McGaw | Conservative | 14,193 | 36.57 | +4.5 | ||||
| Frank J. Beetham | Liberal | 4,371 | 11.26 | −0.7 | ||||
| Edward Adamson | National Front | 565 | 1.46 | −3.0 | ||||
| General Election October 1974 [29] Electorate: 54,213 Turnout: 39,537 (72.93%) −6.3 | Labour hold Majority: 7,652 (19.36%) +4.4 Swing: 0.9% from Con to Lab | Barbara Castle | Labour | 20,344 | 51.46 | +3.1 | ||
| Ian D. McGaw | Conservative | 12,692 | 32.10 | −1.3 | ||||
| Frank J. Beetham | Liberal | 4,741 | 11.99 | −2.0 | ||||
| John Kingsley Read | National Front | 1,758 | 4.45 | +.04 | ||||
| General Election February 1974 [30] Electorate: 53,767 Turnout: 42,049 (78.21%) +2.7 | Labour hold Majority: 6,300 (14.98%) +8.5 Swing: 4.3% from Con to Lab | Barbara Castle | Labour | 20,340 | 48.37 | −4.9 | ||
| Ian D. McGaw | Conservative | 14,040 | 33.39 | −13.4 | ||||
| Frank J. Beetham | Liberal | 5,891 | 14.01 | N/A | ||||
| John Kingsley Read | National Front | 1,778 | 4.23 | N/A | ||||
| General Election 1970 [31] Electorate: 55,875 Turnout: 42,210 (75.54%) −3.8 | Labour hold Majority: 2,736 (6.48%) −10.1 Swing: 6.1% from Lab to Con | Barbara Castle | Labour | 22,473 | 53.24 | −6.1 | ||
| Trixie Gardner | Conservative | 19,737 | 46.76 | +6.1 | ||||
| General election, 1966 [32] Electorate: 54,911 Turnout: 43,514 (79.2%) −1.8 | Labour hold Majority: 7,248 (16.6%) +1.6 Swing: 1.6% from Con to Lab | Barbara Castle | Labour | 25,381 | 58.3 | +1.6 | ||
| Thomas Marsden | Conservative | 18,133 | 41.7 | −1.6 | ||||
| General election, 1964 [33] Electorate: 57,034 Turnout: 46,193 (81.0%) | Labour hold Majority: 6,893 (15.0%) +9.4 Swing: 4.7% from Con to Lab | Barbara Castle | Labour | 26,543 | 57.5 | +4.7 | ||
| John Maurice Armstrong Yerburgh | Conservative | 19,650 | 42.5 | −4.7 | ||||
| General election, 1959 [34] Electorate: 60,362 Turnout: 51,846 (85.89%) +2.8 | Labour hold Majority: 2,866 (5.6%) +4.6 Swing: 2.3% from Con to Lab | Barbara Castle | Labour | 27,356 | 52.8 | +2.3 | ||
| John Maurice Armstrong Yerburgh | Conservative | 24,490 | 47.2 | −2.3 | ||||
| General Election 1955 [35] Electorate: 62,548 Turnout: 51,993 (83.1%) | Labour win Majority: 489 (1.0%) | Barbara Castle | Labour | 26,241 | 50.5 | N/A | ||
| Thomas Marsden | Conservative | 25,752 | 49.5 | N/A | ||||
Elections in the 1940s
General Election 1939/40: Another General Election was required to take place before the end of 1940. The political parties had been making preparations for an election to take place from 1939 and by the end of this year, the following candidates had been selected;
- Conservative: W. D. Smiles, George Elliston
- Labour: James Bell, William John Tout
| Party | Candidate | Votes | % | ± | |
|---|---|---|---|---|---|
| Labour | John Edwards | 35,182 | 26.0 | ||
| Labour | Barbara Castle | 35,145 | 26.0 | ||
| Conservative | Douglas Glover | 26,325 | 19.5 | ||
| Conservative | Robert Goulborne Parker | 25,807 | 19.1 | ||
| Liberal | Robert Shackleton | 6,587 | 4.9 | ||
| Liberal | Marjorie Annie Macinerney | 6,096 | 4.5 | ||
| Turnout | 82.6 | ||||
| Majority | |||||
| Labour gain from Conservative | Swing | ||||
| Majority | 8,820 | 6.9 | |||
| Labour gain from Conservative | Swing | ||||
Elections in the 1930s
| Party | Candidate | Votes | % | ± | |
|---|---|---|---|---|---|
| Conservative | George Elliston | 37,932 | 26.2 | ||
| Conservative | W. D. Smiles | 37,769 | 26.1 | ||
| Labour | James Bell | 34,571 | 23.9 | ||
| Labour | G Harry Walker | 34,423 | 23.8 | ||
| Turnout | 144,695 | 84.9 | |||
| Majority | |||||
| Conservative hold | Swing | ||||
| Majority | 3,198 | 2.2 | |||
| Conservative hold | Swing | ||||
| Party | Candidate | Votes | % | ± | |
|---|---|---|---|---|---|
| Conservative | W. D. Smiles | 50,105 | 33.2 | ||
| Conservative | George Elliston | 49,953 | 33.1 | ||
| Labour | Mary Hamilton | 25,643 | 17.0 | ||
| Labour | Thomas Gill | 25,030 | 16.6 | ||
| Turnout | 150,731 | 87.4 | |||
| Majority | |||||
| Conservative gain from Labour | Swing | ||||
| Majority | 24,310 | 16.1 | |||
| Conservative gain from Labour | Swing | ||||
Elections in the 1920s
| Party | Candidate | Votes | % | ± | |
|---|---|---|---|---|---|
| Labour | Mary Hamilton | 37,256 | 26.1 | +4.3 | |
| Labour | Thomas Gill | 35,723 | 25.0 | +3.2 | |
| Unionist | Sydney Henn | 35,249 | 24.7 | -3.4 | |
| Liberal | Gerald Isaacs | 34,504 | 24.2 | -4.1 | |
| Turnout | 87.8 | -0.4 | |||
| Majority | 474 | 0.3 | |||
| Labour gain from Unionist | Swing | ||||
| Labour gain from Liberal | Swing | ||||
| Party | Candidate | Votes | % | ± | |
|---|---|---|---|---|---|
| Liberal | John Duckworth | 31,612 | 28.3 | ||
| Conservative | Sydney Henn | 31,347 | 28.1 | ||
| Labour | Mary Hamilton | 24,330 | 21.8 | ||
| Labour | Thomas Gill | 24,317 | 21.8 | ||
| Turnout | 111,606 | 88.2 | |||
| Majority | 7,017 | 6.3 | |||
| Unionist hold | Swing | ||||
| Majority | 7,282 | 6.5 | |||
| Liberal hold | Swing | ||||
| Party | Candidate | Votes | % | ± | |
|---|---|---|---|---|---|
| Liberal | John Duckworth | 31,117 | 29.1 | n/a | |
| Unionist | Sydney Henn | 28,505 | 26.6 | +1.1 | |
| Labour | John Davies | 25,428 | 23.8 | +2.1 | |
| Labour | Edward Porter | 21,903 | 20.5 | -0.6 | |
| Turnout | 85.0 | -3.4 | |||
| Majority | 3,077 | 2.8 | +0.1 | ||
| Unionist hold | Swing | ||||
| Majority | 5,689 | 5.3 | |||
| Liberal hold | Swing | n/a | |||
| Party | Candidate | Votes | % | ± | |
|---|---|---|---|---|---|
| Unionist | Sydney Henn | 28,280 | 25.5 | ||
| National Liberal | Henry Norman | 27,071 | 24.4 | ||
| Labour | John Davies | 24,049 | 21.7 | ||
| Labour | Edward Porter | 23,402 | 21.1 | ||
| Liberal | Thomas Meech | 8,141 | 7.3 | ||
| Turnout | 88.4 | ||||
| Majority | 3,022 | 2.7 | |||
| Unionist hold | Swing | ||||
| Majority | 4,231 | 3.8 | |||
| National Liberal hold | Swing | ||||
Elections in the 1910s

| Party | Candidate | Votes | % | ± | |
|---|---|---|---|---|---|
| C | Liberal | Henry Norman | 32,078 | 41.4 | +15.1 |
| C | Unionist | Percy Dean | 30,158 | 38.9 | −8.4 |
| Labour | Philip Snowden | 15,274 | 19.7 | −6.7 | |
| Turnout | 74.8 | −17.6 | |||
| Majority | 14,884 | 19.2 | |||
| Unionist gain from Labour | Swing | −0.9 | |||
| Majority | 16,802 | 21.7 | |||
| Liberal hold | Swing | +11.8 | |||
| C indicates candidate endorsed by the coalition government. | |||||
| Party | Candidate | Votes | % | ± | |
|---|---|---|---|---|---|
| Labour | Philip Snowden | 10,762 | 26.4 | −1.7 | |
| Liberal | Henry Norman | 10,754 | 26.3 | −2.1 | |
| Conservative | W.B. Boyd-Carpenter | 9,814 | 24.0 | +2.0 | |
| Conservative | H.L. Riley | 9,500 | 23.3 | +1.8 | |
| Turnout | 92.4 | −3.6 | |||
| Registered electors | 22,572 | ||||
| Majority | 948 | 2.4 | −3.7 | ||
| Labour hold | Swing | −1.9 | |||
| Majority | 940 | 2.3 | −4.1 | ||
| Liberal hold | Swing | −2.1 | |||
| Party | Candidate | Votes | % | ± | |
|---|---|---|---|---|---|
| Liberal | Henry Norman | 12,064 | 28.4 | +4.9 | |
| Labour | Philip Snowden | 11,916 | 28.1 | +1.4 | |
| Conservative | Robert Cecil | 9,307 | 22.0 | −4.8 | |
| Conservative | G.F.S. Bowles | 9,112 | 21.5 | −1.8 | |
| Turnout | 96.0 | +0.6 | |||
| Registered electors | 22,572 | ||||
| Majority | 2,757 | 6.4 | N/A | ||
| Liberal gain from Conservative | Swing | +4.9 | |||
| Majority | 2,609 | 6.1 | +2.7 | ||
| Labour hold | Swing | +1.6 | |||
Elections in the 1900s
| Party | Candidate | Votes | % | ± | |
|---|---|---|---|---|---|
| Conservative | Harry Hornby | 10,291 | 26.8 | −13.7 | |
| Labour Repr. Cmte. | Philip Snowden | 10,282 | 26.7 | +2.1 | |
| Conservative | Geoffrey Drage | 8,932 | 23.3 | −10.6 | |
| Liberal | E. Hamer | 8,892 | 23.2 | N/A | |
| Turnout | 95.4 | +9.6 | |||
| Registered electors | 21,127 | ||||
| Majority | 1,399 | 3.6 | −7.9 | ||
| Conservative hold | Swing | +4.9 | |||
| Majority | 1,350 | 3.4 | N/A | ||
| Labour Repr. Cmte. gain from Conservative | Swing | +6.4 | |||
| Party | Candidate | Votes | % | ± | |
|---|---|---|---|---|---|
| Conservative | Harry Hornby | 11,247 | 40.5 | +3.1 | |
| Conservative | William Coddington | 9,415 | 33.9 | −1.9 | |
| Labour Repr. Cmte. | Philip Snowden | 7,096 | 25.6 | N/A | |
| Turnout | 85.8 | −1.8 | |||
| Registered electors | 19,496 | ||||
| Majority | 2,319 | 8.3 | −0.7 | ||
| Conservative hold | Swing | N/A | |||
| Conservative hold | Swing | N/A | |||
Elections in the 1890s
| Party | Candidate | Votes | % | ± | |
|---|---|---|---|---|---|
| Conservative | Harry Hornby | 9,553 | 37.4 | +8.6 | |
| Conservative | William Coddington | 9,150 | 35.8 | +7.8 | |
| Liberal | Thomas Ritzema | 6,840 | 26.8 | −16.4 | |
| Turnout | 87.6 | −4.5 | |||
| Registered electors | 18,275 | ||||
| Majority | 2,310 | 9.0 | +3.5 | ||
| Conservative hold | Swing | +12.5 | |||
| Conservative hold | Swing | +12.1 | |||
| Party | Candidate | Votes | % | ± | |
|---|---|---|---|---|---|
| Conservative | Harry Hornby | 9,265 | 28.8 | N/A | |
| Conservative | William Coddington | 9,046 | 28.0 | N/A | |
| Liberal | W. Taylor | 7,272 | 22.5 | N/A | |
| Liberal | Eli Heyworth[37] | 6,694 | 20.7 | N/A | |
| Turnout | 92.1 | N/A | |||
| Registered electors | 17,661 | ||||
| Majority | 1,774 | 5.5 | N/A | ||
| Conservative hold | Swing | N/A | |||
| Conservative hold | Swing | N/A | |||
Elections in the 1880s
| Party | Candidate | Votes | % | ± | |
|---|---|---|---|---|---|
| Conservative | William Coddington | Unopposed | |||
| Conservative | Harry Hornby | Unopposed | |||
| Conservative hold | |||||
| Conservative hold | |||||


| Party | Candidate | Votes | % | ± | |
|---|---|---|---|---|---|
| Conservative | William Coddington | 9,168 | 30.9 | +5.5 | |
| Conservative | Robert Peel | 8,425 | 28.4 | +3.5 | |
| Liberal | William Edward Briggs | 6,740 | 22.7 | −3.3 | |
| Liberal | James Nuttall Boothman[41] | 5,341 | 18.0 | −5.6 | |
| Majority | 1,685 | 5.7 | +3.9 | ||
| Turnout | 15,656 | 95.9 | +2.5 (est) | ||
| Registered electors | 16,329 | ||||
| Conservative hold | Swing | +5.6 | |||
| Conservative gain from Liberal | Swing | +3.4 | |||
| Party | Candidate | Votes | % | ± | |
|---|---|---|---|---|---|
| Liberal | William Edward Briggs | 6,349 | 26.0 | +0.6 | |
| Conservative | William Coddington | 6,207 | 25.4 | −0.9 | |
| Conservative | Daniel Thwaites | 6,088 | 24.9 | −0.4 | |
| Liberal | George Molesworth | 5,760 | 23.6 | +0.5 | |
| Turnout | 12,202 (est) | 93.4 (est) | −0.6 | ||
| Registered electors | 13,062 | ||||
| Majority | 261 | 1.1 | +1.0 | ||
| Liberal hold | Swing | +0.5 | |||
| Majority | 447 | 1.8 | +0.9 | ||
| Conservative hold | Swing | −0.7 | |||
Elections in the 1870s
| Party | Candidate | Votes | % | ± | |
|---|---|---|---|---|---|
| Conservative | Daniel Thwaites | 5,792 | 54.5 | +2.9 | |
| Liberal | J. T. Hibbert[44] | 4,832 | 45.5 | −3.0 | |
| Majority | 960 | 9.0 | +8.1 | ||
| Turnout | 10,624 | 90.6 | −3.4 | ||
| Registered electors | 11,721 | ||||
| Conservative hold | Swing | +3.0 | |||
- Caused by Feilden's death.
| Party | Candidate | Votes | % | ± | |
|---|---|---|---|---|---|
| Conservative | Henry Feilden | 5,532 | 26.3 | −0.1 | |
| Liberal | William Edward Briggs | 5,338 | 25.4 | +1.4 | |
| Conservative | Daniel Thwaites | 5,323 | 25.3 | −1.5 | |
| Liberal | Richard Shackleton[45] | 4,851 | 23.1 | +0.3 | |
| Turnout | 10,522 (est) | 94.0 (est) | −5.6 | ||
| Registered electors | 11,195 | ||||
| Majority | 194 | 0.9 | −1.4 | ||
| Conservative hold | Swing | −0.2 | |||
| Majority | 15 | 0.1 | N/A | ||
| Liberal gain from Conservative | Swing | +1.5 | |||
Elections in the 1860s
| Party | Candidate | Votes | % | ± | |
|---|---|---|---|---|---|
| Conservative | Edward Hornby | 4,738 | 27.5 | +0.7 | |
| Conservative | Henry Feilden | 4,697 | 27.3 | +0.9 | |
| Liberal | John Gerald Potter | 3,964 | 23.0 | −1.0 | |
| Liberal | John Morley | 3,804 | 22.1 | −0.7 | |
| Majority | 733 | 4.3 | +2.0 | ||
| Turnout | 8,602 (est) | 93.7 (est) | −5.9 | ||
| Registered electors | 9,183 | ||||
| Conservative hold | Swing | +0.9 | |||
| Conservative hold | Swing | +0.8 | |||
- Caused by the 1868 election being declared void on petition after "undue influence by those who held the position of agents in the canvass".[47]
| Party | Candidate | Votes | % | ± | |
|---|---|---|---|---|---|
| Conservative | William Hornby | 4,907 | 26.8 | −5.0 | |
| Conservative | Joseph Feilden | 4,826 | 26.4 | −1.9 | |
| Liberal | John Gerald Potter | 4,399 | 24.0 | +6.6 | |
| Liberal | Montague Joseph Feilden | 4,164 | 22.8 | +0.3 | |
| Majority | 427 | 2.3 | −3.6 | ||
| Turnout | 9,148 (est) | 99.6 (est) | +12.2 | ||
| Registered electors | 9,183 | ||||
| Conservative hold | Swing | −5.8 | |||
| Conservative hold | Swing | −1.1 | |||
| Party | Candidate | Votes | % | ± | |
|---|---|---|---|---|---|
| Conservative | William Hornby | 1,053 | 31.8 | ||
| Conservative | Joseph Feilden | 938 | 28.3 | ||
| Liberal | James Pilkington | 744 | 22.5 | ||
| Liberal | John Gerald Potter | 577 | 17.4 | ||
| Majority | 194 | 5.9 | |||
| Turnout | 1,656 (est) | 87.4 (est) | |||
| Registered electors | 1,894 | ||||
| Conservative hold | Swing | ||||
| Conservative gain from Liberal | Swing | ||||
Elections in the 1850s
| Party | Candidate | Votes | % | ± | |
|---|---|---|---|---|---|
| Conservative | William Hornby | 832 | 38.7 | N/A | |
| Liberal | James Pilkington | 750 | 34.9 | N/A | |
| Liberal | John Patrick Murrough[48] | 567 | 26.4 | N/A | |
| Majority | 82 | 3.8 | N/A | ||
| Turnout | 1,491 (est) | 92.2 (est) | N/A | ||
| Registered electors | 1,617 | ||||
| Conservative hold | Swing | N/A | |||
| Liberal hold | Swing | N/A | |||
| Party | Candidate | Votes | % | ± | |
|---|---|---|---|---|---|
| Conservative | William Hornby | Unopposed | |||
| Whig | James Pilkington | Unopposed | |||
| Registered electors | 1,518 | ||||
| Conservative gain from Radical | |||||
| Whig hold | |||||
| Party | Candidate | Votes | % | ± | |
|---|---|---|---|---|---|
| Whig | Montague Joseph Feilden | 631 | 52.4 | ||
| Conservative | William Hornby | 574 | 47.6 | ||
| Majority | 57 | 4.7 | |||
| Turnout | 1,205 | 90.9 | |||
| Registered electors | 1,325 | ||||
| Whig gain from Radical | Swing | ||||
- Caused by Eccles' election being declared void on petition, due to bribery.[49]
| Party | Candidate | Votes | % | ± | |
|---|---|---|---|---|---|
| Whig | James Pilkington | 846 | 43.7 | ||
| Radical | William Eccles | 580 | 30.0 | ||
| Conservative | John Hornby | 509 | 26.3 | ||
| Turnout | 968 (est) | 76.9 (est) | N/A | ||
| Registered electors | 1,258 | ||||
| Majority | 266 | 13.7 | |||
| Whig hold | Swing | ||||
| Majority | 71 | 3.7 | |||
| Radical gain from Conservative | Swing | ||||
See also
Notes and references
- Notes
- ↑ A borough constituency (for the purposes of election expenses and type of returning officer)
- ↑ As with all constituencies, the constituency elects one Member of Parliament (MP) by the first past the post system of election at least every five years.
- References
- ↑ "Blackburn: Usual Resident Population, 2011". Neighbourhood Statistics. Office for National Statistics. Retrieved 31 January 2015.
- ↑ "Electorate Figures – Boundary Commission for England". 2011 Electorate Figures. Boundary Commission for England. 4 March 2011. Archived from the original on 6 November 2010. Retrieved 13 March 2011.
- ↑ Could the election be won by fraud?, Robert Winnett and Abul Taher, The Sunday Times, 10 April 2005
- ↑ "Jack Straw has no plans to retire despite hitting 65". Lancashire Telegraph. 14 August 2011. Retrieved 5 August 2016.
- ↑ "Jack Straw to step down as Labour MP for Blackburn". BBC News. 25 October 2013. Retrieved 25 October 2013.
- 1 2 3 Leigh Rayment's Historical List of MPs – Constituencies beginning with "B" (part 3)
- ↑ Craig, F. W. S. (1989) [1977]. British parliamentary election results 1832–1885 (2nd ed.). Chichester: Parliamentary Research Services. pp. 49–50. ISBN 0-900178-26-4.
- ↑ Craig, F. W. S. (1989) [1974]. British parliamentary election results 1885–1918 (2nd ed.). Chichester: Parliamentary Research Services. p. 76. ISBN 0-900178-27-2.
- ↑ Craig, F. W. S. (1983) [1969]. British parliamentary election results 1918–1949 (3rd ed.). Chichester: Parliamentary Research Services. p. 92. ISBN 0-900178-06-X.
- 1 2 3 Pink, William Dumcombe; Beavan, Alfred B. (1889). The Parliamentary Representation of Lancashire (County and Borough) 1258-1885 with Biographical and Genealogical Notices of the Members. London: Henry Gray. p. 317. Retrieved 14 April 2018.
- ↑ "The General Election". The Spectator. 31 July 1847. p. 2. Retrieved 14 April 2018.
- ↑ "The Diary of Charles TIplady". Cotton Town. Retrieved 14 April 2018.
- ↑ "Election Data 2015". Electoral Calculus. Archived from the original on 17 October 2015. Retrieved 17 October 2015.
- ↑ "Blackburn". BBC News. Retrieved 8 May 2015.
- ↑ "Election Data 2010". Electoral Calculus. Archived from the original on 26 July 2013. Retrieved 17 October 2015.
- ↑ "UK General Election results May 2010". Richard Kimber's Political Science Resources. Retrieved 15 December 2010.
- ↑ "Election Data 2005". Electoral Calculus. Archived from the original on 15 October 2011. Retrieved 18 October 2015.
- ↑ "UK General Election results May 2005". Richard Kimber's Political Science Resources. Retrieved 15 December 2010.
- ↑ "Election Data 2001". Electoral Calculus. Archived from the original on 15 October 2011. Retrieved 18 October 2015.
- 1 2 "UK General Election results May 1997 and June 2001: Blackburn". Richard Kimber's Political Science Resources. Retrieved 15 December 2010.
- ↑ "Election Data 1997". Electoral Calculus. Archived from the original on 15 October 2011. Retrieved 18 October 2015.
- ↑ "Election Data 1992". Electoral Calculus. Archived from the original on 15 October 2011. Retrieved 18 October 2015.
- ↑ "UK General Election results April 1992". Richard Kimber's Political Science Resources. Retrieved 15 December 2010.
- ↑ "Election Data 1987". Electoral Calculus. Archived from the original on 15 October 2011. Retrieved 18 October 2015.
- ↑ "UK General Election results June 1987". Richard Kimber's Political Science Resources. Retrieved 15 December 2010.
- ↑ "Election Data 1983". Electoral Calculus. Archived from the original on 15 October 2011. Retrieved 18 October 2015.
- ↑ "UK General Election results June 1983". Richard Kimber's Political Science Resources. Retrieved 15 December 2010.
- ↑ "UK General Election results May 1979". Richard Kimber's Political Science Resources. Retrieved 15 December 2010.
- ↑ "UK General Election results October 1974". Richard Kimber's Political Science Resources. Retrieved 15 December 2010.
- ↑ "UK General Election results February 1974". Richard Kimber's Political Science Resources. Retrieved 15 December 2010.
- ↑ "UK General Election results 1970". Richard Kimber's Political Science Resources. Retrieved 15 December 2010.
- ↑ "UK General Election results March 1966". Richard Kimber's Political Science Resources. Retrieved 15 December 2010.
- ↑ "UK General Election results October 1964". Richard Kimber's Political Science Resources. Retrieved 15 December 2010.
- ↑ "UK General Election results October 1959". Richard Kimber's Political Science Resources. Retrieved 15 December 2010.
- ↑ "UK General Election results May 1955". Richard Kimber's Political Science Resources. Retrieved 15 December 2010.
- 1 2 3 4 5 6 Craig, FWS, ed. (1974). British Parliamentary Election Results: 1885-1918. London: Macmillan Press. ISBN 9781349022984.
- ↑ "Late 19th Century". Cotton Town. Blackburn with Darwen Council. Retrieved 21 November 2017.
- 1 2 British Parliamentary Election Results 1885-1918, FWS Craig
- ↑ The Liberal Year Book, 1907
- ↑ Debrett's House of Commons & Judicial Bench, 1886
- ↑ "Blackburn". Preston Herald. 2 Jan 1886. p. 3. Retrieved 24 November 2017.
- 1 2 3 4 5 6 7 8 9 10 Craig, F. W. S., ed. (1977). British Parliamentary Election Results 1832-1885 (e-book)
|format=requires|url=(help) (1st ed.). London: Macmillan Press. ISBN 978-1-349-02349-3. - ↑ "Blackburn Election". Jersey Independent and Daily Telegraph. 2 October 1875 – via British Newspaper Archive. (Subscription required (help)).
- ↑ "Election of Blackburn". Preston Herald. 25 September 1875. p. 3. Retrieved 27 December 2017 – via British Newspaper Archive. (Subscription required (help)).
- ↑ "The General Election". Western Daily Mercury. 28 January 1874. p. 3. Retrieved 27 December 2017 – via British Newspaper Archive. (Subscription required (help)).
- ↑ "Election Intelligence. Blackburn". The Times. London. 31 March 1869. p. 4, col F.
|access-date=requires|url=(help) - ↑ "Blackburn Election Petition". Preston Chronicle. 20 March 1869. p. 2. Retrieved 28 January 2018 – via British Newspaper Archive. (Subscription required (help)).
- ↑ "Representation of Blackburn". Preston Chronicle. 23 April 1859. p. 5. Retrieved 14 April 2018 – via British Newspaper Archive. (Subscription required (help)).
- ↑ "Blackburn Election". Manchester Courier and Lancashire General Advertiser. 26 March 1853. p. 5. Retrieved 14 April 2018 – via British Newspaper Archive. (Subscription required (help)).