Stroud (UK Parliament constituency)
| Stroud | |
|---|---|
|
County constituency for the House of Commons | |
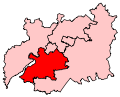 Boundary of Stroud in Gloucestershire. | |
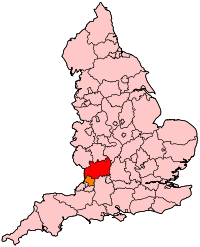 Location of Gloucestershire within England. | |
| County | Gloucestershire |
| Electorate | 79,135 (December 2010)[1] |
| Major settlements | Stroud, Dursley and Stonehouse |
| Current constituency | |
| Created | 1955 |
| Member of parliament | David Drew (Labour Co-op) |
| Number of members | One |
| Created from | Stroud & Thornbury |
| 1885–1950 | |
| Number of members | One |
| Type of constituency | County constituency |
| Replaced by | Stroud & Thornbury |
| 1832–1885 | |
| Number of members | Two |
| Type of constituency | Borough constituency |
| Created from | Gloucestershire |
| Overlaps | |
| European Parliament constituency | South West England |
Stroud is a constituency[n 1] represented in the House of Commons of the UK Parliament since 2017 by David Drew of the Labour Party.[n 2]
Stroud is the only seat (held or gained) by a Labour Party candidate in 2017 from a total of six covering its county. Drew's 2017 win was one of 30 net gains the Labour Party made at that year's snap general election. Stroud has been relative to others a very marginal seat since 1992 as well as a swing seat; as the winning candidate's majority has not exceeded 9.1% of the vote since the 19.2% majority won at that year's election. The seat has changed hands three times since then.
History
A previous parliamentary borough form of constituency of the same name was created by the First Reform Act for the 1832–33 general election. It elected two MPs using the bloc vote system until it was transformed in the Redistribution of Seats Act 1885 for that year's general election, the name being transferred to a single-seat county division which covered a wider geographical area.
This was abolished at the 1950 general election, partially replaced with a new Stroud and Thornbury county constituency. That was in turn abolished at the 1955 general election, when the present entity was created. Since this recreation the seat has had boundary changes.[2]
Boundaries
1955-1974: The Urban Districts of Nailsworth and Stroud, the Rural Districts of Dursley, Stroud, and Tetbury, and part of the Rural District of Gloucester.
1974-1983: The Urban Districts of Nailsworth and Stroud, the Rural Districts of Dursley, Stroud, and Tetbury, and in the Rural District of Gloucester the parishes of Arlingham, Brookthorpe with Whaddon, Eastington, Elmore, Frampton on Severn, Fretherne with Saul, Frocester, Hardwicke, Harescombe, Haresfield, Longney, Moreton Valence, Quedgeley, Standish, Upton St Leonards, and Whitminster.
1983-1997: The District of Stroud wards of Berkeley, Bisley, Cainscross, Cam, Cambridge, Central, Chalford, Dursley, Eastington, Hinton, King's Stanley, Leonard Stanley, Minchinhampton, Nailsworth, Nibley, Painswick, Parklands, Randwick, Rodborough, Severn, Stonehouse, Thrupp, Trinity, Uley, Uplands, Vale, Whiteshill, Woodfield, and Wotton and Kingswood, and the District of Cotswold wards of Avening, Grumbold's Ash, and Tetbury.
1997-2010: All the wards of the District of Stroud except the Wotton and Kingswood ward.
2010–present: The District of Stroud wards of Amberley and Woodchester, Berkeley, Bisley, Cainscross, Cam East, Cam West, Central, Chalford, Coaley and Uley, Dursley, Eastington and Standish, Farmhill and Paganhill, Hardwicke, Nailsworth, Over Stroud, Painswick, Rodborough, Severn, Slade, Stonehouse, The Stanleys, Thrupp, Trinity, Uplands, Upton St Leonards, Vale, and Valley.
The extent of the constituency is almost all of the Stroud district (it also provides three wards to The Cotswolds seat). As such, the north-west boundary of the constituency is the River Severn, which meanders from Gloucester towards the River's estuary.
Constituency profile
Stroud lies south of Gloucester, between the two larger Gloucestershire rural constituencies of The Cotswolds and Forest of Dean. Though partially situated in the Cotswold Hills, Stroud is both smaller in area and more industrialised than these neighbours.
Much of the constituency is rural in character. Through the sparsely populated bulk, is a belt across the middle of the constituency that has a group of small but more urbanised villages, including Caincross, Cam and Rodborough.
The major market towns include Stroud itself, Dursley in the south of the constituency, and the smaller towns of Berkeley (which in fact has a smaller elctorate than Chalford, but more facilities), Stonehouse and Nailsworth.
Workless claimants, registered jobseekers, were in November 2012 significantly lower than the national average of 3.8%, at 2.1% of the population based on a statistical compilation by The Guardian.[3]
Members of Parliament
Stroud parliamentary borough
MPs 1832–1885
| Election | Member[4] | Party | Member[4] | Party | ||
|---|---|---|---|---|---|---|
| 1832 | David Ricardo | Liberal | William Henry Hyett | Liberal | ||
| 1833 by-election | George Poulett Scrope | Whig[5][6][7] | ||||
| 1835 | Charles Richard Fox | Liberal | ||||
| May 1835 by-election | Lord John Russell | Liberal | ||||
| 1841 | William Henry Stanton | Whig[8][9][10][6][7] | ||||
| 1852 | Lord Moreton | Whig[11] | ||||
| 1853 by-election | Edward Horsman | Whig[5][12][13][14] | ||||
| 1859 | Liberal | Liberal | ||||
| 1867 by-election | Henry Winterbotham | Liberal | ||||
| 1868 | Sebastian Dickinson | Liberal | ||||
| Jan. 1874 by-election | John Dorington | Conservative | ||||
| 1874[15] | Walter John Stanton | Liberal | ||||
| May 1874 by-election[16] | John Dorington | Conservative | Alfred John Stanton | Liberal | ||
| July 1874 by-election[17] | Henry Brand | Liberal | ||||
| 1875 by-election[18] | Samuel Marling | Liberal | ||||
| 1880 | Walter John Stanton | Liberal | Henry Brand | Liberal | ||
| 1880 | Parliamentary borough abolished. Name transferred to a new county division | |||||
Stroud division of Gloucestershire
MPs 1885–1950
Stroud County Constituency
MPs since 1955
| Election | Member[4] | Party | |
|---|---|---|---|
| 1955 | Sir Anthony Kershaw | Conservative | |
| 1987 | Roger Knapman | Conservative | |
| 1997 | David Drew | Labour Co-operative | |
| 2010 | Neil Carmichael | Conservative | |
| 2017 | David Drew | Labour Co-operative | |
Elections
Elections in the 2010s
}}
| Party | Candidate | Votes | % | ± | |
|---|---|---|---|---|---|
| Labour | David Drew | ||||
| Conservative | Siobhan Baillie | ||||
| UKIP | Glenville Gogerly | ||||
| Majority | |||||
| Turnout | |||||
| Registered electors | |||||
| Party | Candidate | Votes | % | ± | |
|---|---|---|---|---|---|
| Labour Co-op | David Drew | 29,994 | 47.0 | +9.3 | |
| Conservative | Neil Carmichael | 29,307 | 45.9 | +0.2 | |
| Liberal Democrat | Max Wilkinson | 2,053 | 3.2 | −0.2 | |
| Green | Sarah Lunnon | 1,423 | 2.2 | −2.3 | |
| UKIP | Glenville Gogerly | 1,039 | 1.6 | −6.3 | |
| Majority | 687 | 1.1 | N/A | ||
| Turnout | 63,816 | 77.0 | +1.5 | ||
| Registered electors | 82,839 | ||||
| Labour Co-op gain from Conservative | Swing | +4.5 | |||
| Party | Candidate | Votes | % | ± | |
|---|---|---|---|---|---|
| Conservative | Neil Carmichael | 27,813 | 45.7 | +4.9 | |
| Labour Co-op | David Drew | 22,947 | 37.7 | −0.9 | |
| UKIP | Caroline Stephens[23] | 4,848 | 8.0 | +5.7 | |
| Green | Sarah Lunnon | 2,779 | 4.6 | +1.9 | |
| Liberal Democrat | Adrian Walker-Smith | 2,086 | 3.4 | −12.0 | |
| Independent | Richard Wilson | 246 | 0.4 | - | |
| Free Public Transport | David Michael | 100 | 0.2 | - | |
| Majority | 4,866 | 8.0 | +5.8 | ||
| Turnout | 60,819 | 75.5 | +1.5 | ||
| Registered electors | 80,544 | ||||
| Conservative hold | Swing | +2.9 | |||
| Party | Candidate | Votes | % | ± | |
|---|---|---|---|---|---|
| Conservative | Neil Carmichael | 23,679 | 40.8 | +2.5 | |
| Labour Co-op | David Drew | 22,380 | 38.6 | −1.5 | |
| Liberal Democrat | Dennis Andrewartha | 8,955 | 15.4 | +1.5 | |
| Green | Martin Whiteside | 1,542 | 2.7 | −3.0 | |
| UKIP | Steve Parker | 1,301 | 2.2 | +0.3 | |
| Independent | Alan Lomas | 116 | 0.2 | - | |
| Majority | 1,299 | 2.2 | +0.4 | ||
| Turnout | 57,973 | 74.1 | +3.9 | ||
| Registered electors | 78,286 | ||||
| Conservative gain from Labour Co-op | Swing | +2.0 | |||
Elections in the 2000s
| Party | Candidate | Votes | % | ± | |
|---|---|---|---|---|---|
| Labour Co-op | David Drew | 22,527 | 39.6 | −6.9 | |
| Conservative | Neil Carmichael | 22,177 | 39.0 | +1.6 | |
| Liberal Democrat | Peter Hirst | 8,026 | 14.1 | +3.2 | |
| Green | Martin Whiteside | 3,056 | 5.4 | +1.9 | |
| UKIP | Edward Noble | 1,089 | 1.9 | +0.3 | |
| Majority | 350 | 0.6 | −8.5 | ||
| Turnout | 56875 | 71.3 | +1.4 | ||
| Registered electors | 79,757 | ||||
| Labour Co-op hold | Swing | −4.3 | |||
| Party | Candidate | Votes | % | ± | |
|---|---|---|---|---|---|
| Labour Co-op | David Drew | 25,685 | 46.6 | +3.9 | |
| Conservative | Neil Carmichael | 20,646 | 37.4 | −0.5 | |
| Liberal Democrat | Janice Beasley | 6,036 | 10.9 | −4.5 | |
| Green | Kevin Cranston | 1,913 | 3.5 | −0.5 | |
| UKIP | Adrian Blake | 895 | 1.6 | - | |
| Majority | 5,039 | 9.1 | +4.4 | ||
| Turnout | 55,175 | 69.9 | −9.2 | ||
| Registered electors | 78,878 | ||||
| Labour Co-op hold | Swing | +2.2 | |||
Elections in the 1990s
| Party | Candidate | Votes | % | ± | |
|---|---|---|---|---|---|
| Labour Co-op | David Drew | 26,170 | 42.7 | +13.3 | |
| Conservative | Roger Knapman | 23,260 | 37.9 | −8.3 | |
| Liberal Democrat | Paul Hodgkinson | 9,502 | 15.5 | −6.1 | |
| Green | John Marjoram | 2,415 | 3.9 | +1.2 | |
| Majority | 2,910 | 4.7 | −12.1 | ||
| Turnout | 61,347 | 79.2 | −4.3 | ||
| Registered electors | 77,494 | ||||
| Labour Co-op gain from Conservative | Swing | +10.8 | |||
| Party | Candidate | Votes | % | ± | |
|---|---|---|---|---|---|
| Conservative | Roger Knapman | 32,201 | 46.2 | −4.0 | |
| Labour | David Drew | 18,796 | 26.9 | +8.4 | |
| Liberal Democrat | Myles P. Robinson | 16,751 | 24.0 | −7.3 | |
| Green | Sue M Atkinson | 2,005 | 2.9 | - | |
| Majority | 13,405 | 19.2 | +0.3 | ||
| Turnout | 69,753 | 84.5 | +3.9 | ||
| Registered electors | 82,553 | ||||
| Conservative hold | Swing | −6.2 | |||
Elections in the 1980s
| Party | Candidate | Votes | % | ± | |
|---|---|---|---|---|---|
| Conservative | Roger Knapman | 32,883 | 50.2 | −1.1 | |
| Liberal | Adrian Walker-Smith | 20,508 | 31.3 | −0.6 | |
| Labour | Tom Levitt | 12,145 | 18.5 | +1.7 | |
| Majority | 12,375 | 18.9 | −0.6 | ||
| Turnout | 65,553 | 80.6 | +3.0 | ||
| Registered electors | 81,275 | ||||
| Conservative hold | Swing | −0.3 | |||
| Party | Candidate | Votes | % | ± | |
|---|---|---|---|---|---|
| Conservative | Anthony Kershaw | 30,896 | 51.3 | −1.2 | |
| Liberal | G. Fallon | 19,182 | 31.9 | +4.2 | |
| Labour | D.R. Parsons | 10,141 | 16.8 | −3.0 | |
| Majority | 11,714 | 19.5 | −5.5 | ||
| Turnout | 60,219 | 77.7 | −8.3 | ||
| Registered electors | 77,528 | ||||
| Conservative hold | Swing | −2.7 | |||
Elections in the 1970s
| Party | Candidate | Votes | % | ± | |
|---|---|---|---|---|---|
| Conservative | Anthony Kershaw | 32,534 | 52.6 | +8.8 | |
| Labour | B.J. Marshall | 17,037 | 27.5 | −3.6 | |
| Liberal | James Heppell | 12,314 | 19.9 | −4.8 | |
| Majority | 15,497 | 25.0 | +12.4 | ||
| Turnout | 61,885 | 81.3 | +0.9 | ||
| Registered electors | 76,137 | ||||
| Conservative hold | Swing | +6.2 | |||
| Party | Candidate | Votes | % | ± | |
|---|---|---|---|---|---|
| Conservative | Anthony Kershaw | 24,406 | 43.8 | +0.2 | |
| Labour | W.H. Maddocks | 17,352 | 31.1 | +1.9 | |
| Liberal | S.A. Ritchie | 13,756 | 24.7 | −1.7 | |
| United Democratic Party | J.S. Churchill | 241 | 0.4 | −0.4 | |
| Majority | 7,054 | 12.7 | −1.8 | ||
| Turnout | 55,755 | 80.4 | −5.0 | ||
| Registered electors | 69,381 | ||||
| Conservative hold | Swing | +6.2 | |||
| Party | Candidate | Votes | % | ± | |
|---|---|---|---|---|---|
| Conservative | Anthony Kershaw | 25,619 | 43.6 | −7.5 | |
| Labour | W.H. Maddocks | 17,148 | 29.2 | −6.9 | |
| Liberal | S.A. Ritchie | 15,521 | 26.4 | +13.6 | |
| Powell Conservative | J.S. Churchill | 470 | 0.8 | N/A | |
| Majority | 8,471 | 14.4 | −0.6 | ||
| Turnout | 58,758 | 85.4 | N/A | ||
| Registered electors | 68,805 | ||||
| Conservative hold | |||||
| Party | Candidate | Votes | % | ± | |
|---|---|---|---|---|---|
| Conservative | Anthony Kershaw | 27,089 | 51.1 | +7.9 | |
| Labour | R. Derek Wheatley | 19,158 | 36.1 | −4.0 | |
| Liberal | David M. Davies | 6,799 | 12.8 | −3.8 | |
| Majority | 7,931 | 15.0 | +11.9 | ||
| Turnout | 53,046 | 80.3 | −5.6 | ||
| Registered electors | 66,072 | ||||
| Conservative hold | Swing | +5.9 | |||
Elections in the 1960s
| Party | Candidate | Votes | % | ± | |
|---|---|---|---|---|---|
| Conservative | Anthony Kershaw | 21,804 | 43.2 | −0.9 | |
| Labour | Tom Cox | 20,259 | 40.1 | +1.9 | |
| Liberal | John V. Smith | 8,397 | 16.6 | −1.1 | |
| Majority | 1,545 | 3.1 | −2.8 | ||
| Turnout | 50,460 | 85.0 | +0.5 | ||
| Registered electors | 58,779 | ||||
| Conservative hold | Swing | −1.4 | |||
| Party | Candidate | Votes | % | ± | |
|---|---|---|---|---|---|
| Conservative | Anthony Kershaw | 21,802 | 44.1 | −4.0 | |
| Labour | Dennis V. Hunt | 18,889 | 38.2 | +0.6 | |
| Liberal | Iain P. Crawford | 8,747 | 17.7 | +3.4 | |
| Majority | 2,913 | 5.9 | −4.6 | ||
| Turnout | 49,438 | 85.4 | +0.1 | ||
| Registered electors | 57,906 | ||||
| Conservative hold | Swing | −2.3 | |||
Elections in the 1950s
| Party | Candidate | Votes | % | ± | |
|---|---|---|---|---|---|
| Conservative | Anthony Kershaw | 23,448 | 48.1 | −1.3 | |
| Labour | Alfred Evans | 18,336 | 37.6 | −3.5 | |
| Liberal | Clement McNair | 6,988 | 14.3 | +4.8 | |
| Majority | 5,112 | 10.5 | +2.1 | ||
| Turnout | 48,772 | 85.2 | +0.9 | ||
| Registered electors | 57,220 | ||||
| Conservative hold | Swing | +1.1 | |||
| Party | Candidate | Votes | % | ± | |
|---|---|---|---|---|---|
| Conservative | Anthony Kershaw | 23,318 | 49.4 | N/A | |
| Labour | Richard W. Evely | 19,375 | 41.1 | N/A | |
| Liberal | Eric Barnett Ayliffe | 4,489 | 9.5 | N/A | |
| Majority | 3,943 | 8.4 | N/A | ||
| Turnout | 47,182 | 84.3 | N/A | ||
| Registered electors | 55,962 | ||||
| Conservative win (new seat) | |||||
Election in the 1940s
| Party | Candidate | Votes | % | ± | |
|---|---|---|---|---|---|
| Labour | Ben Parkin | 22,495 | 40.8 | +4.0 | |
| Conservative | Walter Perkins | 21,546 | 39.0 | −24.2 | |
| Liberal | Peter Cadbury | 11,141 | 20.2 | - | |
| Majority | 949 | 1.7 | −24.7 | ||
| Turnout | 55,182 | 72.6 | +1.7 | ||
| Registered electors | 75,987 | ||||
| Labour gain from Conservative | Swing | +14.1 | |||
General Election 1939/40:
Another general election was required to take place before the end of 1940. The political parties had been making preparations for an election to take place from 1939 and by the end of this year, the following candidates had been selected;
- Conservative: Walter Perkins
Elections in the 1930s
| Party | Candidate | Votes | % | ± | |
|---|---|---|---|---|---|
| Conservative | Walter Perkins | 24,282 | 63.2 | −8.2 | |
| Labour | Constance Elizabeth Maude Borrett | 14,133 | 36.8 | +8.2 | |
| Majority | 10,149 | 26.4 | −16.5 | ||
| Turnout | 38,415 | 71.0 | −5.5 | ||
| Registered electors | 54,140 | ||||
| Conservative hold | Swing | −8.2 | |||
| Party | Candidate | Votes | % | ± | |
|---|---|---|---|---|---|
| Conservative | Walter Perkins | 27,612 | 71.4 | +21.9 | |
| Labour | F W Davies | 11,039 | 28.6 | −1.5 | |
| Majority | 16,573 | 42.8 | +23.3 | ||
| Turnout | 38,651 | 76.5 | +5.1 | ||
| Registered electors | 50,534 | ||||
| Conservative hold | Swing | +11.7 | |||
| Party | Candidate | Votes | % | ± | |
|---|---|---|---|---|---|
| Unionist | Walter Perkins | 17,641 | 49.6 | +5.1 | |
| Labour | Herbert John Maynard | 10,688 | 30.0 | +3.9 | |
| Liberal | Arthur William Stanton | 7,267 | 20.4 | −9.0 | |
| Majority | 6,953 | 19.6 | +4.5 | ||
| Turnout | 35,596 | 71.4 | −10.3 | ||
| Registered electors | 49,874 | ||||
| Unionist hold | Swing | +6.5 | |||
Elections in the 1920s
| Party | Candidate | Votes | % | ± | |
|---|---|---|---|---|---|
| Unionist | Frank Nelson | 17,700 | 44.5 | −9.8 | |
| Liberal | Arthur William Stanton | 11,728 | 29.5 | +8.9 | |
| Labour | F.E. White | 10,384 | 26.1 | +0.9 | |
| Majority | 5,972 | 15.0 | −14.1 | ||
| Turnout | 39,812 | 81.6 | +2.7 | ||
| Registered electors | 48,776 | ||||
| Unionist hold | Swing | +4.0 | |||
| Party | Candidate | Votes | % | ± | |
|---|---|---|---|---|---|
| Unionist | Frank Nelson | 15,973 | 54.2 | +7.4 | |
| Labour | Edith Picton-Turbervill | 7,418 | 25.2 | n/a | |
| Liberal | Arthur William Stanton | 6,057 | 20.6 | −32.6 | |
| Majority | 8,555 | 29.0 | 29.1 | ||
| Turnout | 29,448 | 78.9 | +0.7 | ||
| Registered electors | 37,336 | ||||
| Unionist gain from Liberal | Swing | +16.8 | |||
| Party | Candidate | Votes | % | ± | |
|---|---|---|---|---|---|
| Liberal | Frederick Guest | 15,179 | 53.2 | +21.9 | |
| Unionist | Stanley Tubbs | 13,355 | 46.8 | −4.2 | |
| Majority | 1,824 | 6.4 | −13.3 | ||
| Turnout | 28,534 | 78.2 | −1.7 | ||
| Registered electors | 36,504 | ||||
| Liberal gain from Unionist | Swing | +13.0 | |||
| Party | Candidate | Votes | % | ± | |
|---|---|---|---|---|---|
| Unionist | Stanley Tubbs | 14,723 | 51.0 | - | |
| Liberal | Charles Allen | 9,041 | 31.3 | −28.6 | |
| Labour | Samuel Edward Walters | 5,081 | 17.6 | −22.5 | |
| Majority | 5,682 | 19.7 | −0.1 | ||
| Turnout | 28845 | 79.9 | +18.6 | ||
| Registered electors | 36,094 | ||||
| Unionist gain from Liberal | |||||
Elections 1832 to 1918
Elections in the 1910s
| Party | Candidate | Votes | % | ± | |
|---|---|---|---|---|---|
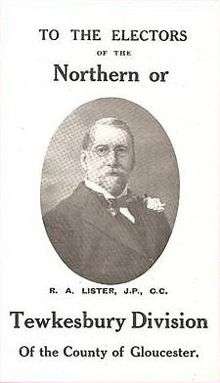
| C | Liberal | Ashton Lister | 12,734 | 59.9 | N/A |
| Labour | Charles Wye Kendall | 8,522 | 40.1 | N/A | |
| Majority | 4,212 | 19.8 | N/A | ||
| Turnout | 21,256 | 61.3 | N/A | ||
| Registered electors | 34,685 | ||||
| Liberal hold | |||||
| C indicates candidate endorsed by the coalition government. | |||||
General Election 1914/15:
Another General Election was required to take place before the end of 1915. The political parties had been making preparations for an election to take place and by the July 1914, the following candidates had been selected;
- Liberal: George Hardy
- Unionist: Cecil Edwin Fitch
| Party | Candidate | Votes | % | ± | |
|---|---|---|---|---|---|
| Liberal | Charles Allen | 5,051 | 51.0 | -0.6 | |
| Conservative | Cecil Edwin Fitch[32] | 4,849 | 49.0 | +0.6 | |
| Majority | 202 | 2.0 | -1.1 | ||
| Turnout | 9,900 | 90.1 | -3.2 | ||
| Registered electors | 10,992 | ||||
| Liberal hold | Swing | −0.6 | |||
| Party | Candidate | Votes | % | ± | |
|---|---|---|---|---|---|
| Liberal | Charles Allen | 5,285 | 51.6 | −4.6 | |
| Conservative | Arthur William Clifford | 4,962 | 48.4 | +4.6 | |
| Majority | 323 | 3.2 | −9.1 | ||
| Turnout | 10,247 | 93.2 | +2.6 | ||
| Registered electors | 10,992 | ||||
| Liberal hold | Swing | −4.6 | |||
Elections in the 1900s
| Party | Candidate | Votes | % | ± | |
|---|---|---|---|---|---|
| Liberal | Charles Allen | 5,401 | 56.1 | +4.4 | |
| Conservative | William Burton Stewart[33] | 4,221 | 43.9 | −4.4 | |
| Majority | 1,180 | 12.3 | +8.8 | ||
| Turnout | 9,622 | 90.6 | +4.0 | ||
| Registered electors | 10,620 | ||||
| Liberal hold | Swing | +4.4 | |||
| Party | Candidate | Votes | % | ± | |
|---|---|---|---|---|---|
| Liberal | Charles Allen | 4,692 | 51.7 | +5.1 | |
| Conservative | Charles Cripps | 4,379 | 48.3 | −5.1 | |
| Majority | 313 | +3.5 | −3.4 | ||
| Turnout | 9,071 | 86.6 | +3.0 | ||
| Registered electors | 10,474 | ||||
| Liberal gain from Conservative | Swing | +5.1 | |||
Elections in the 1890s
| Party | Candidate | Votes | % | ± | |
|---|---|---|---|---|---|
| Conservative | Charles Cripps | 5,175 | 53.4 | +4.5 | |
| Liberal | Charles Allen | 4,514 | 46.6 | −4.5 | |
| Majority | 661 | 6.8 | +4.6 | ||
| Turnout | 9,689 | 83.6 | +2.1 | ||
| Registered electors | 11,588 | ||||
| Conservative gain from Liberal | Swing | +4.5 | |||
| Party | Candidate | Votes | % | ± | |
|---|---|---|---|---|---|
| Liberal | David Brynmor Jones | 4,611 | 51.1 | +5.3 | |
| Conservative | George Holloway | 4,410 | 48.9 | −5.3 | |
| Majority | 201 | 2.2 | −6.1 | ||
| Turnout | 9,021 | 81.5 | −0.8 | ||
| Registered electors | 11,069 | ||||
| Liberal gain from Conservative | Swing | +5.3 | |||
Elections in the 1880s
| Party | Candidate | Votes | % | ± | |
|---|---|---|---|---|---|
| Conservative | George Holloway | 4,620 | 54.2 | +5.9 | |
| Liberal | Walter John Stanton | 3,911 | 45.8 | −5.9 | |
| Majority | 709 | 8.3 | N/A | ||
| Turnout | 8,531 | 82.3 | −4.3 | ||
| Registered electors | 10,371 | ||||
| Conservative gain from Liberal | Swing | +5.9 | |||

| Party | Candidate | Votes | % | ± | |
|---|---|---|---|---|---|
| Liberal | Henry Brand | 4,646 | 51.7 | −1.1 | |
| Conservative | George Holloway | 4,333 | 48.3 | +1.1 | |
| Majority | 313 | 3.5 | +1.2 | ||
| Turnout | 8,979 | 86.6 | −5.2 (est) | ||
| Registered electors | 10,371 | ||||
| Liberal win (new seat) | |||||
| Party | Candidate | Votes | % | ± | |
|---|---|---|---|---|---|
| Liberal | Walter John Stanton | 3,098 | 26.5 | +0.6 | |
| Liberal | Henry Brand | 3,081 | 26.3 | +0.5 | |
| Conservative | George Holloway | 2,810 | 24.0 | +1.2 | |
| Conservative | John Dorington | 2,722 | 23.2 | −2.3 | |
| Majority | 271 | 2.3 | +2.0 | ||
| Turnout | 5,856 (est) | 91.8 (est) | +0.7 | ||
| Registered electors | 6,376 | ||||
| Liberal hold | Swing | −0.3 | |||
| Liberal hold | Swing | +1.4 | |||
Elections in the 1870s
| Party | Candidate | Votes | % | ± | |
|---|---|---|---|---|---|
| Liberal | Samuel Marling | 2,783 | 51.9 | +0.2 | |
| Conservative | William Keppel | 2,577 | 48.1 | −0.2 | |
| Majority | 206 | 3.8 | +3.5 | ||
| Turnout | 5,360 | 88.7 | −2.4 | ||
| Registered electors | 6,046 | ||||
| Liberal hold | Swing | +0.2 | |||
- Caused by the previous by-election being declared void on petition.
| Party | Candidate | Votes | % | ± | |
|---|---|---|---|---|---|
| Liberal | Henry Brand | 2,695 | 50.8 | −0.9 | |
| Conservative | James Thomas Stanton[35] | 2,613 | 49.2 | +0.9 | |
| Majority | 82 | 1.5 | +1.2 | ||
| Turnout | 5,308 | 89.3 | −1.8 | ||
| Registered electors | 5,942 | ||||
| Liberal hold | Swing | −0.9 | |||
- Caused by Dorington's election being declared void on petition, due to "bribery, treating, and undue influence".[36]
| Party | Candidate | Votes | % | ± | |
|---|---|---|---|---|---|
| Conservative | John Dorington | 2,796 | 25.9 | +0.4 | |
| Liberal | Alfred John Stanton | 2,722 | 25.3 | −0.6 | |
| Liberal | Henry Brand | 2,677 | 24.8 | −1.0 | |
| Conservative | George Holloway | 2,582 | 24.0 | +1.2 | |
| Majority | 74 | 0.7 | N/A | ||
| Majority | 140 | 1.3 | +1.0 | ||
| Turnout | 5,389 (est) | 90.7 (est) | −0.4 | ||
| Registered electors | 5,942 | ||||
| Conservative gain from Liberal | Swing | +0.7 | |||
| Liberal hold | Swing | −0.9 | |||
- Caused by the election being declared void on petition on "account of treating, but the treating was not with knowledge of the candidates".[37]
| Party | Candidate | Votes | % | ± | |
|---|---|---|---|---|---|
| Liberal | Walter John Stanton | 2,798 | 25.9 | −10.0 | |
| Liberal | Sebastian Dickinson | 2,794 | 25.8 | −11.4 | |
| Conservative | John Dorington | 2,763 | 25.5 | +12.1 | |
| Conservative | George Holloway | 2,467 | 22.8 | +9.4 | |
| Majority | 31 | 0.3 | −8.8 | ||
| Turnout | 5,411 (est) | 91.1 (est) | +3.3 | ||
| Registered electors | 5,942 | ||||
| Liberal hold | Swing | −10.4 | |||
| Liberal hold | Swing | −11.1 | |||
| Party | Candidate | Votes | % | ± | |
|---|---|---|---|---|---|
| Conservative | John Dorington | 2,817 | 53.7 | +26.9 | |
| Liberal | Henry Allan | 2,426 | 46.3 | −26.8 | |
| Majority | 391 | 7.5 | N/A | ||
| Turnout | 5,243 | 88.2 | +0.4 | ||
| Registered electors | 5,942 | ||||
| Conservative gain from Liberal | Swing | +26.8 | |||
- Caused by Winterbotham's death.
Elections in the 1860s
| Party | Candidate | Votes | % | ± | |
|---|---|---|---|---|---|
| Liberal | Sebastian Dickinson | 2,907 | 37.2 | N/A | |
| Liberal | Henry Winterbotham | 2,805 | 35.9 | N/A | |
| Conservative | John Dorington | 2,096 | 26.8 | N/A | |
| Majority | 709 | 9.1 | −14.9 | ||
| Turnout | 4,952 (est) | 87.8 (est) | +16.0 | ||
| Registered electors | 5,642 | ||||
| Liberal hold | |||||
| Liberal hold | |||||
| Party | Candidate | Votes | % | ± | |
|---|---|---|---|---|---|
| Liberal | Henry Winterbotham | 580 | 53.3 | N/A | |
| Conservative | John Dorington | 508 | 46.7 | N/A | |
| Majority | 72 | 6.6 | −17.4 | ||
| Turnout | 1,088 | 80.2 | +8.4 | ||
| Registered electors | 1,356 | ||||
| Liberal hold | |||||
- Caused by Scrope's resignation.
| Party | Candidate | Votes | % | ± | |
|---|---|---|---|---|---|
| Liberal | Edward Horsman | 687 | 41.4 | N/A | |
| Liberal | George Scrope | 685 | 41.3 | N/A | |
| Liberal | Ashley Ponsonby[38] | 287 | 17.3 | N/A | |
| Majority | 398 | 24.0 | N/A | ||
| Turnout | 973 (est) | 71.8 (est) | N/A | ||
| Registered electors | 1,356 | ||||
| Liberal hold | |||||
| Liberal hold | |||||
Elections in the 1850s
| Party | Candidate | Votes | % | ± | |
|---|---|---|---|---|---|
| Liberal | Edward Horsman | Unopposed | |||
| Liberal | George Scrope | Unopposed | |||
| Registered electors | 1,320 | ||||
| Liberal hold | |||||
| Liberal hold | |||||
| Party | Candidate | Votes | % | ± | |
|---|---|---|---|---|---|
| Whig | Edward Horsman | Unopposed | |||
| Whig | George Scrope | Unopposed | |||
| Registered electors | 1,287 | ||||
| Whig hold | |||||
| Whig hold | |||||
| Party | Candidate | Votes | % | ± | |
|---|---|---|---|---|---|
| Whig | Edward Horsman | Unopposed | |||
| Whig hold | |||||
- Caused by the appointment of Horsman as Chief Secretary to the Lord Lieutenant of Ireland
| Party | Candidate | Votes | % | ± | |
|---|---|---|---|---|---|
| Whig | Edward Horsman | Unopposed | |||
| Whig hold | |||||
- Caused by Reynolds-Moreton's elevation to the peerage, becoming 3rd Earl Ducie
| Party | Candidate | Votes | % | ± | |
|---|---|---|---|---|---|
| Whig | George Scrope | 565 | 29.8 | ||
| Whig | Henry Reynolds-Moreton | 528 | 27.8 | ||
| Conservative | Samuel Baker[39] | 488 | 25.7 | ||
| Radical | John Norton[40][41][42] | 316 | 16.7 | ||
| Majority | 40 | 2.1 | |||
| Turnout | 949 (est) | 71.4 (est) | |||
| Registered electors | 1,328 | ||||
| Whig hold | Swing | ||||
| Whig hold | Swing | ||||
Elections in the 1840s
| Party | Candidate | Votes | % | ± | |
|---|---|---|---|---|---|
| Liberal | William Henry Stanton | 563 | 46.5 | -2.0 | |
| Liberal | George Julius Poulett Scrope | 541 | 44.2 | +1.7 | |
| Liberal | M.M. Turner | 176 | 14.5 | ||
| Majority | |||||
| Turnout | |||||
| Registered electors | 1,210 | ||||
| Liberal hold | |||||
| Liberal hold | |||||
| Party | Candidate | Votes | % | ± | |
|---|---|---|---|---|---|
| Liberal | William Henry Stanton | 594 | 48.5 | ||
| Liberal | George Julius Poulett Scrope | 527 | 43.1 | -9.0 | |
| Conservative | William Wraxhall | 377 | 30.1 | ||
| Majority | |||||
| Turnout | |||||
| Registered electors | 1,224 | ||||
| Liberal hold | |||||
| Liberal hold | |||||
Elections in the 1830s
| Party | Candidate | Votes | % | ± | |
|---|---|---|---|---|---|
| Liberal | George Julius Poulett Scrope | 698 | |||
| Liberal | John Russell | 681 | |||
| Conservative | J. Adams | 297 | |||
| Majority | |||||
| Turnout | |||||
| Registered electors | 1,340 | ||||
| Liberal hold | |||||
| Liberal hold | |||||
| Party | Candidate | Votes | % | ± | |
|---|---|---|---|---|---|
| Liberal | John Russell | Unopposed | |||
| Registered electors | |||||
| Liberal hold | Swing | ||||
- Resignation of Fox
| Party | Candidate | Votes | % | ± | |
|---|---|---|---|---|---|
| Liberal | George Julius Poulett Scrope | 866 | |||
| Liberal | Charles Richard Fox | 708 | |||
| Liberal | J.C. Symons | 187 | |||
| Majority | |||||
| Turnout | |||||
| Registered electors | 1,305 | ||||
| Liberal hold | |||||
| Liberal hold | |||||
| Party | Candidate | Votes | % | ± | |
|---|---|---|---|---|---|
| Liberal | George Julius Poulett Scrope | Unopposed | |||
| Registered electors | |||||
| Liberal hold | |||||
- Resignation of Ricardo
| Party | Candidate | Votes | % | ± | |
|---|---|---|---|---|---|
| Liberal | William Henry Hyett | 985 | |||
| Liberal | David Ricardo | 585 | |||
| Liberal | George Julius Poulett Scrope | 562 | |||
| Majority | |||||
| Turnout | |||||
| Registered electors | 1,305 | ||||
| Liberal win (new seat) | |||||
| Liberal win (new seat) | |||||
See also
Notes
- ↑ A county constituency (for the purposes of election expenses and type of returning officer)
- ↑ As with all constituencies, the constituency elects one Member of Parliament (MP) by the first past the post system of election at least every five years.
References
Craig, F. W. S. (1983). British parliamentary election results 1918-1949 (3 ed.). Chichester: Parliamentary Research Services. ISBN 0-900178-06-X.
- ↑ "Electorate Figures - Boundary Commission for England". 2011 Electorate Figures. Boundary Commission for England. 4 March 2011. Archived from the original on 6 November 2010. Retrieved 13 March 2011.
- ↑ 2010 post-revision map non-metropolitan areas and unitary authorities of England
- ↑ Unemployment claimants by constituency The Guardian
- 1 2 3 4 Leigh Rayment's Historical List of MPs – Constituencies beginning with "S" (part 5)
- 1 2 Mosse, Richard Bartholomew (1838). The Parliamentary Guide: a concise history of the Members of both Houses, etc. pp. 179, 214. Retrieved 3 May 2018.
- 1 2 "Election Movements". Lancaster Gazette. 26 June 1841. p. 2. Retrieved 14 July 2018 – via British Newspaper Archive. (Subscription required (help)).
- 1 2 "General Election". Morning Post. 2 July 1841. p. 7. Retrieved 14 July 2018 – via British Newspaper Archive. (Subscription required (help)).
- ↑ Dod, Charles Roger; Dod, Robert Phipps (1847). Dod's Parliamentary Companion, Volume 15. Dod's Parliamentary Companion. p. 239. Retrieved 14 July 2018 – via Google Books.
- ↑ "Coventry Standard". 25 June 1841. p. 3. Retrieved 14 July 2018 – via British Newspaper Archive. (Subscription required (help)).
- ↑ "Globe". 23 June 1841. pp. 1–2. Retrieved 14 July 2018 – via British Newspaper Archive. (Subscription required (help)).
- ↑ "Wilts and Gloucestershire Standard". 10 July 1852. p. 8. Retrieved 14 July 2018 – via British Newspaper Archive. (Subscription required (help)).
- ↑ Cragg, David (2016). "Chapter 8 — Joseph Cragg (1803–1878) and Hannah Grave (1803–1878)". Cragg Family Origins: Great Britain 1770–1859. David Cragg. p. 98. ISBN 9780994519207. Retrieved 3 May 2018.
- ↑ Churton, Edward (1836). The Assembled Commons or Parliamentary Biographer: 1836. pp. vii, 3.
- ↑ Coohill, Joseph, ed. (17 October 2011). "Free Trade Agendas: The Construction of an Article of Faith, 1837–50". Texts & Studies 5: Ideas of the Liberal Party: Perceptions, Agendas and Liberal Politics in the House of Commons, 1832–52. 30 (s2): 170–203. doi:10.1111/j.1750-0206.2011.00262.x. Retrieved 3 May 2018.
- ↑ The February 1874 general election in Stroud was declared void after a petition
- ↑ The May 1874 by-election was held two elect two members, after results of the general election had been declared void. Two MPs were elected, but the election of Dorington was overturned on petition
- ↑ The July 1874 by-election was held to elect a replacement for Dorington, whose victory at the May 1874 by-election had been declared void on petition
- ↑ The February 1875 by-election was held to elect a replacement for Brand, whose victory at the July 1874 by-election had been declared void on petition.
- ↑ "Stroud parliamentary constituency". BBC News.
- ↑ "Stroud parliamentary constituency". BBC News.
- ↑ "Election Data 2015". Electoral Calculus. Archived from the original on 17 October 2015. Retrieved 17 October 2015.
- ↑ "Archived copy" (PDF). Archived from the original (PDF) on 2015-07-09. Retrieved 2015-07-08. 19 June 2015
- ↑ http://ukpollingreport.co.uk/2015guide/stroud/
- ↑ "Election Data 2010". Electoral Calculus. Archived from the original on 26 July 2013. Retrieved 17 October 2015.
- ↑ "Stroud District Elections Result". Stroud District Council. 2010. Retrieved 8 May 2010.
- ↑ Percentage change and swing for 2010 is calculated relative to the PA (Rallings and Thrasher) 2005 notional result, not actual 2005 result "Press Association Elections". Press Association. Retrieved 17 July 2017.
- ↑ Percentage change and swing for 1997 is calculated relative to the Rallings and Thrasher 1992 notional constituency result, not actual 1992 result. See C. Rallings & M. Thrasher, The Media Guide to the New Parliamentary Constituencies (Plymouth: LGC Elections Centre, 1995)
- ↑ "Politics Resources". Election 1992. Politics Resources. 9 April 1992. Retrieved 2010-12-06.
- ↑ Percentage change and swing for 1983 is calculated relative to the BBC/ITN 1979 notional constituency result, not actual 1979 result. See British Broadcasting Corporation; Independent Television News. The BBC/ITN Guide to the New Parliamentary Constituencies (Chichester: Parliamentary Research Services 1983)
- ↑ British parliamentary election results 1918-1949, craig
- 1 2 3 4 5 6 7 8 Craig, F. W. S., ed. (1974). British Parliamentary Election Results: 1885-1918. London: Macmillan Press. p. 285. ISBN 9781349022984.
- ↑ FITCH, Sir Cecil Edwin’, Who Was Who, A & C Black, an imprint of Bloomsbury Publishing plc, 1920–2016; online edn, Oxford University Press, 2014 ; online edn, April 2014 accessed 22 Sept 2017
- ↑ ‘STEWART, Lt-Col William Burton’, Who Was Who, A & C Black, an imprint of Bloomsbury Publishing plc, 1920–2016; online edn, Oxford University Press, 2014 ; online edn, April 2014 accessed 22 Sept 2017
- 1 2 3 4 5 6 7 8 9 10 11 12 13 14 15 16 17 18 19 20 Craig, F. W. S., ed. (1977). British Parliamentary Election Results 1832-1885 (e-book)
|format=requires|url=(help) (1st ed.). London: Macmillan Press. pp. 292–293. ISBN 978-1-349-02349-3. - ↑ "Stroud". Western Daily Mercury. 24 July 1874. p. 2. Retrieved 21 January 2018 – via British Newspaper Archive. (Subscription required (help)).
- ↑ "Stroud Election Petition". Birmingham Daily Post. 3 July 1874. p. 6. Retrieved 21 January 2018 – via British Newspaper Archive. (Subscription required (help)).
- ↑ "Election Petitions". Irish Times. 5 May 1874. p. 2. Retrieved 21 January 2018 – via British Newspaper Archive. (Subscription required (help)).
- ↑ "Electioneering Speeches". Illustrated Times. 15 July 1865. pp. 2–3. Retrieved 18 March 2018 – via British Newspaper Archive. (Subscription required (help)).
- ↑ "The Borough of Stroud". Gloucester Journal. 10 July 1852. p. 4. Retrieved 14 July 2018 – via British Newspaper Archive. (Subscription required (help)).
- ↑ "Stroud". Bristol Times and Mirror. 10 July 1852. p. 2. Retrieved 14 July 2018 – via British Newspaper Archive. (Subscription required (help)).
- ↑ "Elections in Gloucestershire". Cheltenham Looker-On. 3 July 1852. p. 10 https://www.britishnewspaperarchive.co.uk/viewer/bl/0000226/18520703/007/0010. Retrieved 14 July 2018.
- ↑ "Election Proceedings". Cheltenham Chronicle. 8 July 1852. p. 3. Retrieved 14 July 2018 – via British Newspaper Archive. (Subscription required (help)).
- ↑ Gloucester Journal 3 July 1841 British Newspaper Archive
- ↑ Gloucester Journal 24 June 1841
- ↑ Gloucester Journal 26 June 1841