Jarrow (UK Parliament constituency)
Coordinates: 54°58′37″N 1°27′00″W / 54.977°N 1.450°W
| Jarrow | |
|---|---|
|
Borough constituency for the House of Commons | |
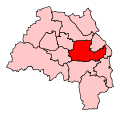 Boundary of Jarrow in Tyne and Wear. | |
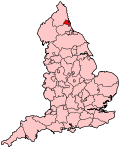 Location of Tyne and Wear within England. | |
| County | Tyne and Wear |
| Electorate | 83,260 (2011)[1] |
| Major settlements | Jarrow |
| Current constituency | |
| Created | 1885 |
| Member of parliament | Stephen Hepburn (Labour) |
| Number of members | One |
| Created from | South Durham |
| Overlaps | |
| European Parliament constituency | North East England |
Jarrow is a constituency[n 1] ESE of and adjoining Newcastle upon Tyne. The constituency has been represented in the House of Commons by Stephen Hepburn of the Labour Party since 1997.[n 2]
History
The seat was created in the Redistribution of Seats Act 1885. The last Liberal to serve the seat lost his seat at the 1922 general election and the last Conservative to serve the seat held it from 1931-1935, since which it has been served by MPs from the Labour Party.
Since 1935, just four people have served as MP for Jarrow; the first, Ellen Wilkinson, served as Labour's first Minister of Education during the first Attlee government. While the seat has been loyally Labour by comfortable margins since 1935, it has seen unusual swings a number of times; in the 1983 Conservative landslide, incumbent MP Don Dixon actually increased his majority; in the close 1992 election his majority fell somewhat despite the general swing to Labour; and in 2001 his successor Stephen Hepburn managed to increase his majority to 51.1% (incidentally the biggest any candidate has ever held in the seat).
Boundaries
1885-1918: The Municipal Boroughs of Jarrow and South Shields, the Sessional Division of South Shields, and part of the civil parish of Heworth.
1918-1950: The Municipal Borough of Jarrow, and the Urban Districts of Felling and Hebburn.
1950-1955: The Municipal Borough of Jarrow, and the Urban Districts of Boldon, Felling, and Hebburn.
1955-1983: The Municipal Borough of Jarrow, and the Urban Districts of Boldon and Hebburn.
1983-1997: The Borough of South Tyneside wards of Bede, Biddick Hall, Boldon Colliery, Cleadon and East Boldon, Fellgate and Hedworth, Hebburn Quay, Hebburn South, Monkton, Primrose, and Whitburn and Marsden.
1997-2010: The Borough of South Tyneside wards of Bede, Boldon Colliery, Cleadon and East Boldon, Fellgate and Hedworth, Hebburn Quay, Hebburn South, Monkton, Primrose, and Whitburn and Marsden, and the Borough of Gateshead ward of Wrekendyke.
2010–present: The Borough of South Tyneside wards of Bede, Boldon Colliery, Cleadon and East Boldon, Fellgate and Hedworth, Hebburn North, Hebburn South, Monkton, and Primrose, and the Borough of Gateshead wards of Pelaw and Heworth, and Wardley and Leam Lane.
Following boundary changes taking effect at the 2010 general election, the constituency consists of part of the metropolitan district of South Tyneside, including the settlements of Jarrow, Boldon, Cleadon and Hebburn, as well as two wards from the adjacent Metropolitan Borough of Gateshead, covering Pelaw and Wardley.[2]
Constituency profile
In 2005 The Guardian described the constituency as:
'[A] former shipbuilding town south of Newcastle famous for its march against unemployment in the 1930s.'
Members of Parliament
Elections
Elections in the 2010s
| Party | Candidate | Votes | % | ± | |
|---|---|---|---|---|---|
| Labour | Stephen Hepburn | 28,020 | 65.1 | +9.5 | |
| Conservative | Robin Gwynn | 10,757 | 25.0 | +7.9 | |
| UKIP | James Askwith | 2,338 | 5.4 | -14.2 | |
| Liberal Democrat | Peter Maughan | 1,163 | 2.7 | -0.5 | |
| Green | David Herbert | 745 | 1.7 | -1.7 | |
| Majority | 17,263 | 40.1 | +4.1 | ||
| Turnout | 43,023 | 60.4 | +0.1 | ||
| Labour hold | Swing | +0.8 | |||
| Party | Candidate | Votes | % | ± | |
|---|---|---|---|---|---|
| Labour | Stephen Hepburn | 21,464 | 55.7 | +1.7 | |
| UKIP | Steve Harrison[6] | 7,583 | 19.7 | +19.7 | |
| Conservative | Nick Mason | 6,584 | 17.1 | -3.6 | |
| Green | David Herbert[7] | 1,310 | 3.4 | +3.4 | |
| Liberal Democrat | Stan Collins[8] | 1,238 | 3.2 | -15.3 | |
| TUSC | Norman Hall[9] | 385 | 1.0 | +1.0 | |
| Majority | 13,881 | 36.0 | +2.7 | ||
| Turnout | 38,564 | 66.4 | +6.0 | ||
| Labour hold | Swing | -9.0 | |||
| Party | Candidate | Votes | % | ± | |
|---|---|---|---|---|---|
| Labour | Stephen Hepburn | 20,910 | 53.9 | −4.9 | |
| Conservative | Jeff Milburn | 8,002 | 20.6 | +7.8 | |
| Liberal Democrat | Tom Appleby | 7,163 | 18.5 | −4.0 | |
| BNP | Andy Swaddle | 2,709 | 7.0 | +7.0 | |
| Majority | 12,908 | 33.3 | |||
| Turnout | 38,784 | 60.3 | +5.5 | ||
| Labour hold | Swing | −6.4 | |||
Elections in the 2000s
| Party | Candidate | Votes | % | ± | |
|---|---|---|---|---|---|
| Labour | Stephen Hepburn | 20,554 | 60.5 | −5.6 | |
| Liberal Democrat | Bill Schardt | 6,650 | 19.6 | +4.6 | |
| Conservative | Linkson A.S. Jack | 4,807 | 14.1 | −0.6 | |
| UKIP | Alan Badger | 1,567 | 4.6 | +2.5 | |
| Safeguard the National Health Service | Roger Nettleship | 400 | 1.2 | N/A | |
| Majority | 13,904 | 40.9 | |||
| Turnout | 33,978 | 55.0 | −0.1 | ||
| Labour hold | Swing | −5.1 | |||
| Party | Candidate | Votes | % | ± | |
|---|---|---|---|---|---|
| Labour | Stephen Hepburn | 22,777 | 66.1 | +1.2 | |
| Liberal Democrat | James Selby | 5,182 | 15.0 | +4.0 | |
| Conservative | Donald Wood | 5,056 | 14.7 | −0.3 | |
| UKIP | Alan Badger | 716 | 2.1 | N/A | |
| Independent | Alan J. Le Blond | 391 | 1.1 | N/A | |
| Socialist (GB) | John Bissett | 357 | 1.0 | +0.0 | |
| Majority | 17,595 | 51.1 | |||
| Turnout | 34,479 | 55.1 | −13.6 | ||
| Labour hold | Swing | ||||
Elections in the 1990s
| Party | Candidate | Votes | % | ± | |
|---|---|---|---|---|---|
| Labour | Stephen Hepburn | 28,497 | 64.9 | +2.8 | |
| Conservative | Mark C. Allatt | 6,564 | 14.9 | −8.8 | |
| Liberal Democrat | Tim N. Stone | 4,865 | 11.1 | −3.1 | |
| Independent Labour | Alan J. Le Blond | 2,538 | 5.8 | N/A | |
| Referendum | Peter W. Mailer | 1,034 | 2.4 | N/A | |
| Socialist (GB) | John Bissett | 444 | 1.0 | N/A | |
| Majority | 21,933 | 49.9 | |||
| Turnout | 43,942 | 68.7 | |||
| Labour hold | Swing | ||||
| Party | Candidate | Votes | % | ± | |
|---|---|---|---|---|---|
| Labour | Don Dixon | 28,956 | 62.1 | −1.3 | |
| Conservative | Terence F. Ward | 11,049 | 23.7 | +0.5 | |
| Liberal Democrat | Keith Orrell | 6,608 | 14.2 | +0.8 | |
| Majority | 17,907 | 38.4 | −1.8 | ||
| Turnout | 46,613 | 74.4 | +0.1 | ||
| Labour hold | Swing | −0.9 | |||
Elections in the 1980s
| Party | Candidate | Votes | % | ± | |
|---|---|---|---|---|---|
| Labour | Don Dixon | 29,651 | 63.4 | +7.9 | |
| Conservative | Paul Yeoman | 10,856 | 23.2 | −1.6 | |
| Liberal | Peter Freitag | 6,230 | 13.3 | −6.7 | |
| Majority | 18,795 | 40.2 | |||
| Turnout | 46,737 | 74.4 | |||
| Labour hold | Swing | ||||
| Party | Candidate | Votes | % | ± | |
|---|---|---|---|---|---|
| Labour | Don Dixon | 25,151 | 55.3 | ||
| Conservative | S. Copland | 11,274 | 24.8 | ||
| Liberal | John A. Lennox | 9,094 | 20.0 | ||
| Majority | 13,877 | 30.5 | |||
| Turnout | 45,519 | 71.4 | |||
| Labour hold | Swing | ||||
Elections in the 1970s
| Party | Candidate | Votes | % | ± | |
|---|---|---|---|---|---|
| Labour | Don Dixon | 24,057 | 55.8 | −7.0 | |
| Conservative | D. Auld | 12,529 | 29.1 | +6.8 | |
| Liberal | A. McDonnell | 3,907 | 9.1 | −5.8 | |
| Independent Labour | H. Downey | 2,247 | 5.2 | N/A | |
| Independent | N. Brown | 374 | 0.9 | N/A | |
| Majority | 11,528 | 26.7 | |||
| Turnout | 43,114 | 77.5 | |||
| Labour hold | Swing | ||||
| Party | Candidate | Votes | % | ± | |
|---|---|---|---|---|---|
| Labour | Ernest Fernyhough | 24,558 | 62.8 | −3.9 | |
| Conservative | B. Bolam | 8,707 | 22.3 | −10.0 | |
| Liberal | L. Ormston | 5,818 | 14.9 | N/A | |
| Majority | 15,851 | 40.6 | |||
| Turnout | 39,083 | 71.4 | |||
| Labour hold | Swing | ||||
| Party | Candidate | Votes | % | ± | |
|---|---|---|---|---|---|
| Labour | Ernest Fernyhough | 27,740 | 66.7 | ||
| Conservative | B. Bolam | 13,848 | 33.3 | ||
| Majority | 13,892 | 33.4 | |||
| Turnout | 41,588 | 86.8 | |||
| Labour hold | Swing | ||||
| Party | Candidate | Votes | % | ± | |
|---|---|---|---|---|---|
| Labour | Ernest Fernyhough | 25,861 | 63.5 | ||
| Conservative | Derrick Robson | 14,847 | 36.5 | ||
| Majority | 11,014 | 27.1 | |||
| Turnout | 40,708 | 74.4 | |||
| Labour hold | Swing | ||||
Elections in the 1960s
| Party | Candidate | Votes | % | ± | |
|---|---|---|---|---|---|
| Labour | Ernest Fernyhough | 26,006 | 67.6 | ||
| Conservative | Derrick Robson | 12,449 | 32.4 | ||
| Majority | 13,557 | 35.3 | |||
| Turnout | 38,455 | 76.7 | |||
| Labour hold | Swing | ||||
| Party | Candidate | Votes | % | ± | |
|---|---|---|---|---|---|
| Labour | Ernest Fernyhough | 26,053 | 64.2 | ||
| Conservative | Tommy T Hubble | 14,503 | 35.8 | ||
| Majority | 11,550 | 28.5 | |||
| Turnout | 40,556 | 80.0 | |||
| Labour hold | Swing | ||||
Elections in the 1950s
| Party | Candidate | Votes | % | ± | |
|---|---|---|---|---|---|
| Labour | Ernest Fernyhough | 25,638 | 62.7 | ||
| Conservative | Tommy T Hubble | 15,286 | 37.4 | ||
| Majority | 10,352 | 25.3 | |||
| Turnout | 40,924 | 80.3 | |||
| Labour hold | Swing | ||||
| Party | Candidate | Votes | % | ± | |
|---|---|---|---|---|---|
| Labour | Ernest Fernyhough | 24,706 | 63.3 | ||
| Conservative | Marjorie Dickinson | 14,304 | 36.4 | ||
| Majority | 10,402 | 26.7 | |||
| Turnout | 39,010 | 79.1 | |||
| Labour hold | Swing | ||||
| Party | Candidate | Votes | % | ± | |
|---|---|---|---|---|---|
| Labour | Ernest Fernyhough | 35,963 | 66.2 | ||
| Conservative | John Cox | 19,217 | 34.8 | ||
| Majority | 16,746 | 30.4 | |||
| Turnout | 55,180 | 84.6 | |||
| Labour hold | Swing | ||||
| Party | Candidate | Votes | % | ± | |
|---|---|---|---|---|---|
| Labour | Ernest Fernyhough | 33,751 | 63.0 | ||
| Conservative | John L. Cox | 16,895 | 31.5 | ||
| Liberal | Edward Glover Stephen Chalkley | 2,940 | 5.5 | ||
| Majority | 16,856 | 31.5 | |||
| Turnout | 53,586 | 82.8 | |||
| Labour hold | Swing | ||||
Elections in the 1940s
| Party | Candidate | Votes | % | ± | |
|---|---|---|---|---|---|
| Labour | Ernest Fernyhough | 20,694 | 59.3 | -6.7 | |
| Conservative | William Scott | 13,078 | 37.5 | N/A | |
| Ind. Labour Party | W. Moody | 1,114 | 3.2 | N/A | |
| Majority | 7,616 | 21.8 | -10.3 | ||
| Turnout | 34,886 | ||||
| Labour hold | Swing | N/A | |||
| Party | Candidate | Votes | % | ± | |
|---|---|---|---|---|---|
| Labour | Ellen Wilkinson | 22,656 | 66.0 | ||
| Liberal National | Stanley Holmes | 11,649 | 34.0 | ||
| Majority | 11,007 | 32.1 | |||
| Turnout | 34,305 | 82.4 | |||
| Labour hold | Swing | ||||
Elections in the 1930s
| Party | Candidate | Votes | % | ± | |
|---|---|---|---|---|---|
| Labour | Ellen Wilkinson | 20,324 | 53.1 | +7.2 | |
| Conservative | William George Pearson | 17,974 | 46.9 | −7.2 | |
| Majority | 2,350 | 6.1 | |||
| Turnout | 38,298 | 80.8 | |||
| Labour gain from Conservative | Swing | ||||
| Party | Candidate | Votes | % | ± | |
|---|---|---|---|---|---|
| Conservative | William George Pearson | 21,263 | 54.1 | ||
| Labour | Robert Wilson | 18,071 | 45.9 | ||
| Majority | 3,192 | 8.1 | |||
| Turnout | 39,334 | 80.5 | |||
| Conservative gain from Labour | Swing | ||||
Elections in the 1920s
| Party | Candidate | Votes | % | ± | |
|---|---|---|---|---|---|
| Labour | Robert Wilson | 22,751 | 62.5 | +5.1 | |
| Unionist | Longinus Vivian Rogers | 13,638 | 37.5 | −5.1 | |
| Majority | 9,113 | 25.0 | +10.2 | ||
| Turnout | 36,389 | 75.3 | −5.6 | ||
| Registered electors | 48,313 | ||||
| Labour hold | Swing | +5.1 | |||
| Party | Candidate | Votes | % | ± | |
|---|---|---|---|---|---|
| Labour | Robert Wilson | 18,203 | 57.4 | −6.5 | |
| Unionist | Albert Baucher | 13,527 | 42.6 | +6.5 | |
| Majority | 4,676 | 14.8 | −13.0 | ||
| Turnout | 31,730 | 80.9 | +13.7 | ||
| Registered electors | 39,237 | ||||
| Labour hold | Swing | −6.5 | |||
| Party | Candidate | Votes | % | ± | |
|---|---|---|---|---|---|
| Labour | Robert Wilson | 16,570 | 63.9 | +10.0 | |
| Unionist | John Lindsley | 9,348 | 36.1 | +4.2 | |
| Majority | 7,222 | 27.8 | +5.8 | ||
| Turnout | 25,918 | 67.2 | −15.0 | ||
| Registered electors | 38,548 | ||||
| Labour hold | Swing | +2.9 | |||
| Party | Candidate | Votes | % | ± | |
|---|---|---|---|---|---|
| Labour | Robert Wilson | 17,208 | 53.9 | +14.9 | |
| Unionist | Charles Harrie Innes-Hopkins | 10,166 | 31.9 | N/A | |
| Liberal | Ernest Young | 4,522 | 14.2 | −46.8 | |
| Majority | 7,042 | 22.0 | N/A | ||
| Turnout | 31,896 | 82.2 | +27.2 | ||
| Registered electors | 38,808 | ||||
| Labour gain from Liberal | Swing | +30.9 | |||
Elections in the 1910s
| Party | Candidate | Votes | % | ± | |
|---|---|---|---|---|---|
| C | Liberal | Godfrey Palmer | 12,544 | 61.0 | +27.0 |
| Labour | John Hill | 8,034 | 39.0 | +5.7 | |
| Majority | 4,510 | 22.0 | +21.3 | ||
| Turnout | 20,578 | 55.0 | −26.9 | ||
| Registered electors | 37,389 | ||||
| Liberal hold | Swing | +10.7 | |||
| C indicates candidate endorsed by the coalition government. | |||||
| Party | Candidate | Votes | % | ± | |
|---|---|---|---|---|---|
| Liberal | Godfrey Palmer | 5,097 | 34.0 | +0.0 | |
| Conservative | James Kirkley | 4,986 | 33.3 | +0.8 | |
| Labour | Alexander Gordon Cameron | 4,892 | 32.7 | −0.8 | |
| Majority | 111 | 0.7 | +0.2 | ||
| Turnout | 14,975 | 81.9 | +3.3 | ||
| Registered electors | 18,292 | ||||
| Liberal hold | Swing | +0.1 | |||
| Party | Candidate | Votes | % | ± | |
|---|---|---|---|---|---|
| Liberal | Godfrey Palmer | 4,885 | 34.0 | −27.2 | |
| Labour | Peter Francis Curran | 4,818 | 33.5 | −5.3 | |
| Conservative | James Kirkley | 4,668 | 32.5 | N/A | |
| Majority | 67 | 0.5 | −21.9 | ||
| Turnout | 14,371 | 78.6 | +1.4 | ||
| Registered electors | 18,292 | ||||
| Liberal hold | Swing | −11.0 | |||
Elections in the 1900s
| Party | Candidate | Votes | % | ± | |
|---|---|---|---|---|---|
| Labour | Pete Curran | 4,698 | 33.1 | −5.7 | |
| Conservative | Patrick Rose-Innes | 3,930 | 27.6 | N/A | |
| Liberal | Spencer Leigh Hughes | 3,474 | 24.4 | −36.8 | |
| Irish Nationalist | John O'Hanlon | 2,122 | 14.9 | N/A | |
| Majority | 768 | 5.5 | N/A | ||
| Turnout | 14,224 | 82.7 | +5.5 | ||
| Registered electors | 17,195 | ||||
| Labour gain from Liberal | Swing | +15.6 | |||

| Party | Candidate | Votes | % | ± | |
|---|---|---|---|---|---|
| Liberal | Charles Palmer | 8,047 | 61.2 | N/A | |
| Labour Repr. Cmte. | Pete Curran | 5,093 | 38.8 | N/A | |
| Majority | 2,954 | 22.4 | N/A | ||
| Turnout | 13,140 | 77.2 | N/A | ||
| Registered electors | 17,023 | ||||
| Liberal hold | Swing | N/A | |||
| Party | Candidate | Votes | % | ± | |
|---|---|---|---|---|---|
| Liberal | Charles Palmer | Unopposed | |||
| Liberal hold | |||||
Elections in the 1890s
| Party | Candidate | Votes | % | ± | |
|---|---|---|---|---|---|
| Liberal | Charles Palmer | Unopposed | |||
| Liberal hold | |||||
| Party | Candidate | Votes | % | ± | |
|---|---|---|---|---|---|
| Liberal | Charles Palmer | 7,343 | 75.2 | N/A | |
| Independent Labour | Edward Dillon Lewis[29][30] | 2,416 | 24.8 | N/A | |
| Majority | 4,927 | 50.4 | N/A | ||
| Turnout | 9,759 | 68.6 | N/A | ||
| Registered electors | 14,231 | ||||
| Liberal hold | Swing | N/A | |||
Elections in the 1880s
= N/A
| Party | Candidate | Votes | % | ± | |
|---|---|---|---|---|---|
| Liberal | Charles Palmer | Unopposed | |||
| Liberal hold | |||||
| Party | Candidate | Votes | % | ± | |
|---|---|---|---|---|---|
| Liberal | Charles Palmer | 5,702 | 76.6 | N/A | |
| Jarrow Radical and Labour Representation League | James Johnston | 1,731 | 23.3 | N/A | |
| Majority | 3,971 | 53.4 | N/A | ||
| Turnout | 7,433 | 57.6 | N/A | ||
| Registered electors | 12,897 | ||||
| Liberal win (new seat) | |||||
See also
Notes and references
- Notes
- ↑ A borough constituency (for the purposes of election expenses and type of returning officer)
- ↑ As with all constituencies, the constituency elects one Member of Parliament (MP) by the first past the post system of election at least every five years.
- References
- ↑ "Parliament constituency population 2011". Retrieved 6 July 2015.
- ↑ "Final Recommendations for Parliamentary Constituencies in Tyne and Wear". Boundary Commission for England. 2006-05-10. Archived from the original on 2009-11-02. Retrieved 2010-04-23.
- ↑ Leigh Rayment's Historical List of MPs – Constituencies beginning with "J"
- ↑ "Election Data 2017". Retrieved 12 June 2017.
- ↑ "Election Data 2015". Electoral Calculus. Archived from the original on 17 October 2015. Retrieved 17 October 2015.
- ↑ https://yournextmp.com/person/5445/steve-harrison
- ↑ http://southtyneside.greenparty.org.uk/news/2014/11/18/news-item-one/
- ↑ http://northeastlibdems.org.uk/en/article/2015/1021524/stan-s-the-man-for-jarrow/%5Bpermanent+dead+link%5D
- ↑ http://www.tusc.org.uk/txt/320.pdf
- ↑ "Election Data 2010". Electoral Calculus. Archived from the original on 26 July 2013. Retrieved 17 October 2015.
- ↑ "Election Data 2005". Electoral Calculus. Archived from the original on 15 October 2011. Retrieved 18 October 2015.
- ↑ "Election Data 2001". Electoral Calculus. Archived from the original on 15 October 2011. Retrieved 18 October 2015.
- ↑ "Election Data 1997". Electoral Calculus. Archived from the original on 15 October 2011. Retrieved 18 October 2015.
- ↑ "Election Data 1992". Electoral Calculus. Archived from the original on 15 October 2011. Retrieved 18 October 2015.
- ↑ "Politics Resources". Election 1992. Politics Resources. 9 April 1992. Retrieved 2010-12-06.
- ↑ "Election Data 1987". Electoral Calculus. Archived from the original on 15 October 2011. Retrieved 18 October 2015.
- ↑ "Election Data 1983". Electoral Calculus. Archived from the original on 15 October 2011. Retrieved 18 October 2015.
- ↑ The Times' Guide to the House of Commons. 1970.
- ↑ The Times' Guide to the House of Commons. 1966.
- ↑ The Times' Guide to the House of Commons. 1964.
- ↑ The Times' Guide to the House of Commons. 1959.
- ↑ The Times' Guide to the House of Commons. 1955.
- ↑ The Times' Guide to the House of Commons. 1951.
- ↑ The Liberal Magazine, vols.55-56, p.269
- ↑ British Parliamentary Election Results 1918-1949, FWS Craig
- ↑ British Parliamentary Election Results 1918-1949, FWS Craig
- 1 2 3 4 5 6 7 8 9 Craig, FWS, ed. (1974). British Parliamentary Election Results: 1885-1918. London: Macmillan Press. ISBN 9781349022984.
- ↑ Times House of Commons, 1910; Politico’s Publishing, 2004 p62
- ↑ "Commercial Items". The Globe. 24 Jun 1892. p. 5. Retrieved 22 November 2017.
- ↑ "The Jarrow Election". Shields Daily Gazette. 18 Apr 1893. p. 4. Retrieved 22 November 2017.