United Kingdom local elections, 2016
|
| |||||||||||||||||||||||||||||||||||||||||||||||||||||||||||||||||
| |||||||||||||||||||||||||||||||||||||||||||||||||||||||||||||||||
124 councils in England 4 directly elected mayors 40 Police and Crime Commissioners [1] | |||||||||||||||||||||||||||||||||||||||||||||||||||||||||||||||||
|---|---|---|---|---|---|---|---|---|---|---|---|---|---|---|---|---|---|---|---|---|---|---|---|---|---|---|---|---|---|---|---|---|---|---|---|---|---|---|---|---|---|---|---|---|---|---|---|---|---|---|---|---|---|---|---|---|---|---|---|---|---|---|---|---|---|
| |||||||||||||||||||||||||||||||||||||||||||||||||||||||||||||||||
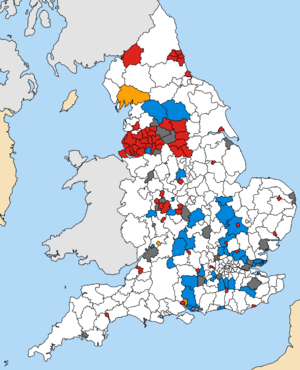 Council control following the 2016 local elections in England.
No election in 2016 | |||||||||||||||||||||||||||||||||||||||||||||||||||||||||||||||||
.jpg)
.jpg)
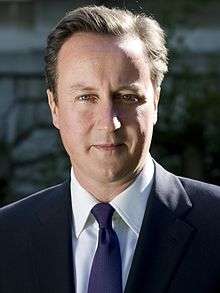
The 2016 United Kingdom local elections were held on Thursday 5 May 2016 were a series of local elections which were held in 124 local councils and also saw 4 mayoral elections in England which also coincided with elections to the Scottish Parliament, the Welsh Assembly, the Northern Ireland Assembly, the London Assembly, the London mayoral election and the England and Wales Police and crime commissioners.[6][7] By-elections for the Westminster seats of Ogmore and Sheffield Brightside and Hillsborough were also held. These proved to be David Cameron's last local elections as leader of the Conservative Party and Prime Minister as he resigned two months later following the defeat of Remain in the referendum on Britain's continuing membership of the European Union which was held seven weeks later.
Results
Full results as reported by BBC News.[8]
| Party | Councils | Councillors | |||
|---|---|---|---|---|---|
| Number | Change | Number | Change | ||
| Labour | 58 | 1,326 | |||
| Conservative | 38 | 842 | |||
| Liberal Democrat | 4 | 378 | |||
| Independent | 0 | 77 | |||
| UKIP | 0 | 58 | |||
| Green | 0 | 45 | |||
| Residents | 0 | 39 | |||
| Liberal | 0 | 4 | |||
| Respect | 0 | 0 | |||
| No overall control | 24 | n/a | n/a | ||
As these local elections were held in 124 English councils, out of 418 in the whole of the UK, the BBC calculated a Projected National Vote Share (PNV), which aims to assess what the council results indicate the UK-wide vote would be "if the results were repeated at a general election".[9]
The BBC's Projected National Vote Share was 31% for Labour, 30% for the Conservatives, 15% for the Liberal Democrats and 12% for UKIP.[10] These results are included in the infobox for this article. Longstanding elections analysts Colin Rallings and Michael Thrasher of Plymouth University estimate a National Equivalent Vote (NEV) share, and in 2016 put Labour on 33%, the Conservatives on 31%, the Liberal Democrats on 14% and UKIP on 12%.[11]
Metropolitan boroughs
Whole metropolitan council
Three of 36 metropolitan boroughs had all of their seats up for election.[12]
| Council | Previous control | Result | Details | ||
|---|---|---|---|---|---|
| Knowsley | Labour | Labour | Details | ||
| Rotherham [13] | Labour | Labour | Details | ||
| Sheffield | Labour | Labour | Details | ||
One-third of metropolitan council
32 of 36 metropolitan boroughs had one-third of their seats up for election.[12]
Unitary authorities
Whole unitary council
3 unitary authorities had all of their seats up for election.[12]
| Council | Previous control | Result | Details | |||
|---|---|---|---|---|---|---|
| Bristol | No overall control (Labour minority) |
Labour | Details | |||
| Peterborough | No overall control (Con minority) |
Conservative | Details | |||
| Warrington | Labour | Labour | Details | |||
One-third of unitary council
16 unitary authorities had one-third of their seats up for election.[12]
| Council | Previous control | Result | Details | |||
|---|---|---|---|---|---|---|
| Blackburn with Darwen | Labour | Labour | Details | |||
| Derby | Labour | Labour | Details | |||
| Halton | Labour | Labour | Details | |||
| Hartlepool | Labour | Labour | Details | |||
| Kingston upon Hull | Labour | Labour | Details | |||
| Milton Keynes | No overall control (Lab minority) |
No overall control (Lab-LibDem Coalition) |
Details | |||
| North East Lincolnshire | No overall control (Lab minority) |
No overall control (Lab minority) |
Details | |||
| Plymouth | No overall control (Lab–Con coalition) |
No overall control
(Con-UKIP coalition) |
Details | |||
| Portsmouth | No overall control (Con with UKIP support) |
No overall control (Con minority) |
Details | |||
| Reading | Labour | Labour | Details | |||
| Slough | Labour | Labour | Details | |||
| Southampton | Labour | Labour | Details | |||
| Southend-on-Sea | No overall control (Ind–Lab–Lib Dem coalition) |
No overall control (Con minority) |
Details | |||
| Swindon | Conservative | Conservative | Details | |||
| Thurrock | No overall control (Lab minority) |
No overall control (Con minority) |
Details | |||
| Wokingham | Conservative | Conservative | Details | |||
District Councils
Whole district councils
12 District Councils had all of their seats up for election.[12]
| Council | Previous control | Result | Details | |||
|---|---|---|---|---|---|---|
| Cherwell | Conservative | Conservative | Details | |||
| Colchester | No overall control (Lib Dem–Lab–Ind coalition) |
No overall control (Lib Dem-Lab-Ind coalition) |
Details | |||
| Elmbridge | Conservative | No overall control (Residents-Lib Dem coalition) |
Details | |||
| Exeter | Labour | Labour | Details | |||
| Gloucester | Conservative | Conservative | Details | |||
| Lincoln | Labour | Labour | Details | |||
| Rochford | Conservative | Conservative | Details | |||
| Stroud | No overall control (Lab–Green–Lib Dem coalition) |
No overall control (Lab-Green-Lib Dem coalition) |
Details | |||
| Watford | No overall control (Lib Dem minority) |
Liberal Democrat | Details | |||
| Welwyn Hatfield | Conservative | Conservative | Details | |||
| Winchester | Conservative | Conservative | Details | |||
| Woking | Conservative | Conservative | Details | |||
Half of councils
7 non-metropolitan district councils had half of their seats up for election.[12]
| Council | Previous control | Result | Details | |||
|---|---|---|---|---|---|---|
| Adur | Conservative | Conservative | Details | |||
| Cheltenham | Liberal Democrat | Liberal Democrat | Details | |||
| Fareham | Conservative | Conservative | Details | |||
| Gosport | Conservative | Conservative | Details | |||
| Hastings | Labour | Labour | Details | |||
| Nuneaton and Bedworth | Labour | Labour | Details | |||
| Oxford | Labour | Labour | Details | |||
One-third of district councils
51 non-metropolitan district councils had one-third of their seats up for election.[12]
Mayoral elections
Four direct mayoral elections were held.[12]
| Local Authority | Previous Mayor | Mayor-elect | Details | |||
|---|---|---|---|---|---|---|
| London | Boris Johnson (Conservative) | Sadiq Khan (Labour) | Details | |||
| Bristol | George Ferguson (Bristol 1st) | Marvin Rees (Labour) | Details | |||
| Liverpool | Joe Anderson (Labour) | Joe Anderson (Labour) | Details | |||
| Salford | Ian Stewart (Labour) | Paul Dennett (Labour) | Details | |||
Police and Crime Commissioner elections
36 elections for Police and Crime Commissioners were held.
Results - English PCC Elections
| Party | Votes[14] | % | PCCs | % | |
|---|---|---|---|---|---|
| Labour | 2,719,315 | 34.3% | 15 | 32.4% | |
| Conservative | 2,390,678 | 30.2% | 20 | 58.8% | |
| UKIP | 1,169,314 | 14.8% | 0 | 0% | |
| Liberal Democrat | 721,148 | 9.1% | 0 | 0% | |
| Independent | 618,688 | 7.8% | 3 | 8.8% | |
| Zero Tolerance Policing | 120,720 | 1.5% | 0 | 0% | |
| Green | 113,957 | 1.4% | 0 | 0% | |
| English Democrat | 54,680 | 0.7% | 0 | 0% | |
| Lincolnshire Independent | 18,497 | 0.2% | 0 | 0% | |
Results Breakdown
Wales
Police and Crime Commissioner elections
Four elections for Police and Crime Commissioners were held.
Results - Welsh PCC Elections
| Party | Votes[14] | % | PCCs | |
|---|---|---|---|---|
| Labour | 328,113 | 34.1% | 2 | |
| Plaid Cymru | 228,334 | 23.7% | 2 | |
| Conservative | 210,882 | 21.9% | 0 | |
| Independent | 102,502 | 10.7% | 0 | |
| UKIP | 46,813 | 4.9% | 0 | |
| Liberal Democrat | 45,163 | 4.7% | 0 | |
Results Breakdown
| Police Force Area | Previous Commissioner | Commissioner-elect | ||
|---|---|---|---|---|
| Dyfed-Powys | Christopher Salmon (Conservative) | Dafydd Llywelyn (Plaid Cymru) | ||
| Gwent | Ian Johnston (Independent) | Jeffrey Cuthbert (Labour) | ||
| North Wales | Winston Roddick (Independent) | Arfon Jones (Plaid Cymru) | ||
| South Wales | Alun Michael (Labour) | Alun Michael (Labour) | ||
See also
Other elections being held in the UK on the same day
External links
References
- ↑ http://www.tusc.org.uk/txt/340.pdf
- ↑ The projected national vote share, "Key points of 2016 elections: At-a-glance summary". BBC News. 9 May 2016.
- ↑ https://electionsetc.com/2016/05/04/calculating-the-local-elections-projected-national-share-pns-in-2015-and-2016/
- ↑ The projected national vote share, "Key points of 2016 elections: At-a-glance summary". BBC News. 9 May 2016.
- ↑ https://electionsetc.com/2016/05/04/calculating-the-local-elections-projected-national-share-pns-in-2015-and-2016/
- ↑ "The Electoral Commission".
- ↑ "Representation of the People Act 1983, Section 37".
- ↑ "Local Election Results 2016 - BBC News". bbc.co.uk.
- ↑ "Key points of 2016 elections: At-a-glance summary". BBC News. Retrieved 23 August 2016.
- ↑ "Key points of 2016 elections: At-a-glance summary". BBC News. Retrieved 23 August 2016.
- ↑ Rallings, Colin; Thrasher, Michael (8 May 2016). "Labour won't govern based on these results". The Sunday Times. Retrieved 1 May 2017.
- 1 2 3 4 5 6 7 8 "Guide to May 2016 elections in Scotland, Wales, England and London". BBC News. Retrieved 21 April 2016.
- ↑ "Local Government report into Rotherham Council".
- 1 2 The Police and Crime Commissioner elections operate under a system called the Supplementary Vote, where voters can cast a first and second preference. First preference votes are the 'popular vote' recorded here
| General elections |
|
|---|---|
| Local elections |
|
| European elections | |
| Referendums | |