Greater Boston
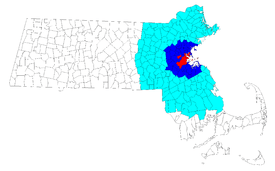
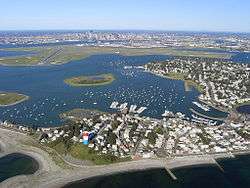
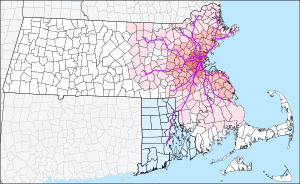
Greater Boston is the metropolitan region of New England encompassing the municipality of Boston, the capital of the U.S. state of Massachusetts and the most populous city in New England, as well as its surrounding areas. The region forms the northern arc of the US northeast megalopolis and as such, Greater Boston can be described either as a metropolitan statistical area (MSA), or as a broader combined statistical area (CSA). The MSA consists of most of the eastern third of Massachusetts, excluding the South Coast region and Cape Cod; while the CSA additionally includes the municipalities of Providence, Rhode Island, Manchester (the largest city in the U.S. state of New Hampshire), Worcester, Massachusetts (the second largest city in New England), as well as the South Coast region and Cape Cod in Massachusetts. While the small footprint of the city of Boston itself only contains an estimated 685,094, the urbanization has extended well into surrounding areas; the CSA is one of two in Massachusetts, the only other being Greater Springfield. Greater Boston is the only CSA-form statistical area in New England which crosses into three states (Massachusetts, New Hampshire and Rhode Island).
Boston Combined Statistical Area Boston–Worcester–Providence | |
|---|---|
_(19806818856).jpg) | |
| Coordinates: 42.35817°N 71.06369°W | |
| Country | |
| State(s) |
|
| Principal cities | |
| Population (2018) | |
| • Total | 8,285,407(CSA) 4,875,390(MSA) |
| • Rank |
|
| Time zone | EST |
| Area code(s) | 617, 781, 857, 339, 978, 508, 351, 774, 603, 401 |
Some of Greater Boston's most well-known contributions involve the region's higher education and medical institutions. Greater Boston has been influential upon American history and industry. The region and the state of Massachusetts are global leaders in biotechnology, engineering, higher education, finance, and maritime trade.[1]
Over 80% of Massachusetts' population lives in the Greater Boston metropolitan region. Greater Boston is ranked tenth in population among US metropolitan statistical areas, home to 4,875,390 people as of the 2018 US Census estimate, and sixth among combined statistical areas, with a population of 8,285,407.[2] The area has hosted many people and sites significant to American culture and history, particularly American literature,[3] politics, and the American Revolution.
Plymouth was the site of the first colony in New England, founded in 1620 by the Pilgrims, passengers of the Mayflower. In 1692, the town of Salem and surrounding areas experienced one of America's most infamous cases of mass hysteria, the Salem witch trials.[4] In the late 18th century, Boston became known as the "Cradle of Liberty"[5] for the agitation there that led to the American Revolution.
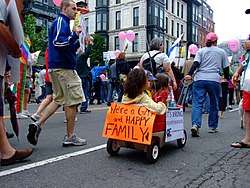
The Greater Boston region has played a powerful scientific, commercial, and cultural role in the history of the United States. Before the American Civil War, the region was a center for the abolitionist, temperance,[6] and transcendentalist[7] movements.[8] In 2004, Massachusetts became the first U.S. state to legally recognize same-sex marriage as a result of the decision of the Massachusetts Supreme Judicial Court in Boston.[9] Many prominent American political dynasties have hailed from the Boston region, including the Adams and Kennedy families.
Harvard University in Cambridge is the oldest institution of higher learning in the United States,[10] with the largest financial endowment of any university,[11] and whose Law School has spawned a contemporaneous majority of United States Supreme Court Justices.[12] Kendall Square in Cambridge has been called "the most innovative square mile on the planet", in reference to the high concentration of entrepreneurial start-ups and quality of innovation which have emerged in the vicinity of the square since 2010.[13][14] Both Harvard University and the Massachusetts Institute of Technology, also in Cambridge, have been ranked among the most highly regarded academic institutions in the world.[15]
Definitions
Metropolitan Area Planning Council (MAPC)
The most restrictive definition of the Greater Boston area is the region administered by the Metropolitan Area Planning Council.[16] The MAPC is a regional planning organization created by the Massachusetts legislature to oversee transportation infrastructure and economic development concerns in the Boston area. The MAPC includes 101 cities and towns that are grouped into eight subregions. These include most of the area within the region's outer circumferential highway, I-495. In 2013, the population of the MAPC district was 3.2 million, which was 48% of the total population of Massachusetts,[17] in an area of 1,422 square miles (3,680 km2),[16] of which 39% is forested and an additional 11% is water, wetland, or other open space.[18]
The eight subregions and their principal towns are: Inner Core (Boston), Minuteman (Route 2 corridor), MetroWest (Framingham), North Shore (Lynn), North Suburban (Woburn), South Shore (Route 3 corridor), SouthWest (Franklin), and Three Rivers (Norwood).
Notably excluded from the MAPC and its partner planning body, the Boston Region Metropolitan Planning Organization, are the Merrimack Valley cities of Lowell, Lawrence, and Haverhill, much of Plymouth County, and all of Bristol County; these areas have their own regional planning bodies. Bristol County is part of the Greater Boston CSA, as part of the Providence MSA.
New England City and Town Area (NECTA)
The urbanized area surrounding Boston serves as the core of a definition used by the US Census Bureau known as the New England city and town area (NECTA). The set of towns containing the core urbanized area, along with surrounding towns with strong social and economic ties to the core area, is defined as the Boston–Cambridge–Nashua, MA–NH Metropolitan NECTA.[19] The Boston NECTA is further subdivided into several NECTA divisions, which are listed below. The Boston, Framingham, and Peabody NECTA divisions together correspond roughly to the MAPC area. The total population of the Boston NECTA was 4,540,941 (as of 2000).
- Boston–Cambridge–Newton, MA NECTA Division (92 towns)
- Framingham, MA NECTA Division (12 towns)
- Peabody–Salem–Beverly, MA NECTA Division (4 towns)
- Brockton–Bridgewater–Easton, MA NECTA Division (Old Colony region) (8 towns)
- Haverhill–Newburyport–Amesbury, MA–NH NECTA Division (Merrimack Valley region) (21 towns)
- Lawrence–Methuen–Salem, MA–NH NECTA Division (part of Merrimack Valley region) (4 towns)
- Lowell–Billerica–Chelmsford, MA–NH NECTA Division (Northern Middlesex region) (15 towns)
- Nashua, NH–MA NECTA Division (21 towns)
- Taunton–Middleborough–Norton, MA NECTA Division (part of Southeastern region) (9 towns)
- Lynn–Saugus–Marblehead, MA NECTA Division (5 towns)
Metropolitan Statistical Area (MSA)
| Historical population | |||
|---|---|---|---|
| Census | Pop. | %± | |
| 1850 | 650,357 | — | |
| 1860 | 830,998 | 27.8% | |
| 1870 | 978,346 | 17.7% | |
| 1880 | 1,205,439 | 23.2% | |
| 1890 | 1,515,684 | 25.7% | |
| 1900 | 1,890,122 | 24.7% | |
| 1910 | 2,260,762 | 19.6% | |
| 1920 | 2,563,123 | 13.4% | |
| 1930 | 2,866,567 | 11.8% | |
| 1940 | 2,926,650 | 2.1% | |
| 1950 | 3,186,970 | 8.9% | |
| 1960 | 3,516,435 | 10.3% | |
| 1970 | 3,918,092 | 11.4% | |
| 1980 | 3,938,585 | 0.5% | |
| 1990 | 4,133,895 | 5.0% | |
| 2000 | 4,391,344 | 6.2% | |
| 2010 | 4,552,402 | 3.7% | |
| Est. 2019 | 4,873,019 | 7.0% | |
| US Decennial Census | |||
An alternative definition defined by the United States Office of Management and Budget, using counties as building blocks instead of towns, is the Boston–Cambridge–Newton, MA–NH Metropolitan Statistical Area, which is further subdivided into three metropolitan divisions. The metropolitan statistical area had a total population of approximately 4,875,390 as of 2018 and is the tenth-largest in the United States. The components of the metropolitan area with their estimated 2018 populations are listed below.
- Boston–Cambridge–Newton, MA–NH Metropolitan Statistical Area (4,875,390)
- Boston, MA Metropolitan Division (2,030,772)
- Norfolk County, Massachusetts (705,388)
- Plymouth County, Massachusetts (518,132)
- Suffolk County, Massachusetts (807,252)
- Cambridge–Newton–Framingham, MA Metropolitan Division (2,405,352)
- Essex County, Massachusetts (790,638)
- Middlesex County, Massachusetts (1,614,714)
- Rockingham County–Strafford County, NH Metropolitan Division (439,266)
- Rockingham County, New Hampshire (309,176)
- Strafford County, New Hampshire (130,090)
- Boston, MA Metropolitan Division (2,030,772)
Combined Statistical Area (CSA)
A wider functional metropolitan area based on commuting patterns is also defined by the Office of Management and Budget as the Boston–Worcester–Providence combined statistical area. This area consists of the metropolitan areas of Manchester, Worcester, Providence, as well as Cape Cod, in addition to greater Boston. The total population as of 2018 for the extended region was estimated at 8,285,417. The following areas, along with the above MSA, are included in the combined statistical area, with their estimated 2018 populations:
- Providence–Warwick, RI–MA Metropolitan Statistical Area (1,621,337)
- Bristol County, Massachusetts (564,022)
- Bristol County, Rhode Island (48,649)
- Kent County, Rhode Island (163,861)
- Newport County, Rhode Island (82,542)
- Providence County, Rhode Island (636,084)
- Washington County, Rhode Island (126,179)
- Worcester, MA–CT Metropolitan Statistical Area (947,876)
- Worcester County, Massachusetts (830,839)
- Windham County, Connecticut (117,027)
- Manchester–Nashua, NH Metropolitan Statistical Area (415,247)
- Hillsborough County, New Hampshire (415,247)
- Barnstable Town, MA Metropolitan Statistical Area (213,413)
- Barnstable County, Massachusetts (213,413)
- Concord, NH Micropolitan Statistical Area (151,132)
- Merrimack County, New Hampshire (151,132)
- Laconia, NH Micropolitan Statistical Area (61,022)
- Belknap County, New Hampshire (61,022)
Principal cities and towns
- Cities and towns
- Andover
- Arlington
- Attleboro
- Auburn
- Avon
- Ayer
- Barnstable
- Barre
- Bedford
- Bellingham
- Belmont
- Beverly
- Billerica
- Blackstone
- Boston
- Boylston
- Braintree
- Bridgewater
- Brockton
- Brookfield
- Brookline
- Burlington
- Cambridge
- Canton
- Chelsea
- Dedham
- Dighton
- Duxbury
- East Brookfield
- Easton
- Edgartown
- Everett
- Fall River
- Fitchburg
- Foxborough
- Framingham
- Franklin
- Gardner
- Grafton
- Haverhill
- Hingham
- Holbrook
- Holden
- Hopedale
- Hopkinton
- Ipswich
- Kingston
- Lancaster
- Lawrence
- Leicester
- Leominster
- Lexington
- Lowell
- Lynn
- Lynnfield
- Malden
- Mansfield
- Medfield
- Medford
- Medway
- Melrose
- Mendon
- Methuen
- Milford
- Millbury
- Millis
- Millville
- Milton
- Nahant
- Nantucket
- Natick
- Needham
- New Bedford
- New Braintree
- Newton
- Northborough
- Northbridge
- North Andover
- North Reading
- Norwood
- Peabody
- Pembroke
- Petersham
- Plymouth
- Provincetown
- Quincy
- Randolph
- Raynham
- Reading
- Rehoboth
- Revere
- Salem
- Saugus
- Scituate
- Seekonk
- Sharon
- Shirley
- Shrewsbury
- Somerset
- Somerville
- Stoneham
- Stoughton
- Southborough
- Southbridge
- Spencer
- Swampscott
- Swansea
- Taunton
- Tewksbury
- Townsend
- Tyngsborough
- Upton
- Uxbridge
- Wakefield
- Walpole
- Waltham
- Watertown
- Wayland
- Webster
- Wellesley
- West Brookfield
- West Tisbury
- Westborough
- Weston
- Weymouth
- Wilmington
- Winchester
- Winthrop
- Woburn
- Worcester
Boston metropolitan area
The Census Bureau defines the following as principal cities in the Boston NECTA[19] using criteria developed for what the Office of Management and Budget calls a Core Based Statistical Area:[20]
Largest cities and towns
Cities and towns in the Boston CSA with at least 50,000 residents:
| Rank | City | 2000 population |
2010 population |
2014 population[21] |
% change (2010 to 2014) |
|---|---|---|---|---|---|
| 1 | Boston | 589,141 | 617,594 | 655,884 | +6.20% |
| 2 | Worcester | 172,648 | 181,045 | 183,016 | +1.09% |
| 3 | Providence | 173,618 | 178,042 | 179,154 | +0.62% |
| 4 | Manchester | 107,006 | 109,565 | 110,448 | +0.81% |
| 5 | Lowell | 105,167 | 106,519 | 109,945 | +3.22% |
| 6 | Cambridge | 101,355 | 105,162 | 109,694 | +4.31% |
| 7 | New Bedford | 93,768 | 95,072 | 94,845 | −0.24% |
| 8 | Brockton | 94,304 | 93,810 | 94,779 | +1.03% |
| 9 | Quincy | 88,025 | 92,271 | 93,397 | +1.22% |
| 10 | Lynn | 89,050 | 90,329 | 92,137 | +2.00% |
| 11 | Fall River | 91,938 | 88,857 | 88,712 | −0.16% |
| 12 | Newton | 83,829 | 85,146 | 88,287 | +3.69% |
| 13 | Nashua | 86,605 | 86,494 | 87,259 | +0.88% |
| 14 | Warwick | 85,808 | 82,672 | 81,963 | −0.86% |
| 15 | Cranston | 79,269 | 80,387 | 81,037 | +0.81% |
| 16 | Somerville | 77,478 | 75,754 | 78,901 | +4.15% |
| 17 | Lawrence | 72,043 | 76,377 | 78,197 | +2.38% |
| 18 | Pawtucket | 72,958 | 71,148 | 71,499 | +0.49% |
| 19 | Framingham | 66,910 | 68,318 | 70,068 | +2.56% |
| 20 | Waltham | 59,226 | 60,632 | 63,014 | +3.93% |
| 21 | Haverhill | 58,969 | 60,879 | 62,488 | +2.64% |
| 22 | Malden | 56,340 | 59,450 | 60,859 | +2.37% |
| 23 | Brookline | 57,107 | 58,732 | 59,115 | +0.65% |
| 24 | Plymouth | 51,701 | 56,468 | 57,463 | +1.76% |
| 25 | Medford | 55,765 | 56,173 | 57,437 | +2.25% |
| 26 | Taunton | 55,976 | 55,874 | 56,544 | +1.20% |
| 27 | Weymouth | 53,988 | 53,743 | 55,643 | +3.54% |
| 28 | Revere | 47,283 | 51,755 | 54,157 | +4.64% |
| 29 | Peabody | 48,129 | 51,251 | 52,376 | +2.20% |
| 30 | Methuen | 43,789 | 47,255 | 52,044 | +10.13% |
Demographics
Population density
The most densely populated census tracts in the Boston CSA (2010):[23]
| Rank | City or neighborhood | Census tract | Population | Population density | |
|---|---|---|---|---|---|
| /sq mi | /km2 | ||||
| 1 | Fenway–Kenmore | 10404 | 5,817 | 110,108 | 285,180 |
| 2 | Fenway–Kenmore | 10403 | 3,003 | 87,828 | 227,470 |
| 3 | Fenway–Kenmore | 10408 | 1,426 | 85,137 | 220,500 |
| 4 | Beacon Hill | 202 | 3,649 | 80,851 | 209,400 |
| 5 | North End | 301 | 1,954 | 66,288 | 171,690 |
| 6 | North End | 302 | 1,665 | 64,642 | 167,420 |
| 7 | North End | 304 | 2,451 | 58,435 | 151,350 |
| 8 | Cambridge | 3539 | 7,090 | 56,819 | 147,160 |
| 9 | Back Bay | 10801 | 2,783 | 56,534 | 146,420 |
| 10 | East Boston | 502 | 5,231 | 55,692 | 144,240 |
Race and ethnicity
The 40 most diverse Census tracts in the Boston CSA:[23]
| Rank | City or neighborhood | Census tract | Population | % White | % Black | % Hispanic | % Asian | % multiracial or other |
|---|---|---|---|---|---|---|---|---|
| 1 | Dorchester | 916 | 3,138 | 12 | 32 | 15 | 26 | 14 |
| 2 | Pawtucket | 161 | 4,607 | 28 | 24 | 28 | 1 | 18 |
| 3 | Pawtucket | 151 | 4,472 | 24 | 24 | 29 | 1 | 23 |
| 4 | Pawtucket | 164 | 4,938 | 29 | 26 | 21 | 2 | 20 |
| 5 | Dorchester | 912 | 3,234 | 30 | 24 | 22 | 6 | 18 |
| 6 | Dorchester | 92101 | 6,451 | 30 | 22 | 11 | 31 | 6 |
| 7 | Brockton | 5115 | 4,308 | 21 | 32 | 13 | 2 | 32 |
| 8 | Brockton | 511 | 3,040 | 28 | 33 | 15 | 1 | 24 |
| 9 | New Bedford | 6519 | 1,942 | 26 | 11 | 33 | 1 | 29 |
| 10 | Mission Hill | 80801 | 3,885 | 32 | 20 | 35 | 10 | 2 |
| 11 | Pawtucket | 154 | 2,258 | 35 | 20 | 35 | 0 | 11 |
| 12 | Brockton | 5114 | 3,716 | 24 | 36 | 14 | 2 | 23 |
| 13 | Brockton | 5109 | 2,531 | 24 | 36 | 16 | 1 | 24 |
| 14 | Brockton | 5103 | 3,798 | 23 | 38 | 15 | 2 | 24 |
| 15 | Brockton | 5104 | 3,706 | 19 | 38 | 15 | 2 | 25 |
| 16 | Dorchester | 90901 | 3,730 | 38 | 18 | 21 | 20 | 4 |
| 17 | Worcester | 733 | 3,762 | 38 | 10 | 37 | 12 | 4 |
| 18 | Providence | 26 | 3,098 | 23 | 22 | 39 | 10 | 6 |
| 19 | Malden | 3415 | 4,780 | 39 | 23 | 14 | 19 | 5 |
| 20 | Cambridge | 3524 | 2,126 | 27 | 39 | 16 | 12 | 5 |
| 21 | South End | 71202 | 3,131 | 39 | 19 | 24 | 15 | 3 |
| 22 | Brockton | 511301 | 5,334 | 39 | 31 | 11 | 2 | 17 |
| 23 | Providence | 15 | 2,994 | 28 | 13 | 41 | 14 | 4 |
| 24 | South Boston | 61 | 3,098 | 41 | 15 | 29 | 11 | 4 |
| 25 | Lynn | 2072 | 2,939 | 30 | 12 | 42 | 13 | 2 |
| 26 | Cambridge | 3549 | 6,058 | 35 | 30 | 9 | 20 | 5 |
| 27 | South Boston | 61101 | 2,232 | 20 | 21 | 42 | 14 | 2 |
| 28 | Brockton | 5116 | 7,211 | 42 | 29 | 10 | 2 | 16 |
| 29 | Roxbury | 801 | 3,350 | 15 | 43 | 28 | 1 | 11 |
| 30 | Lowell | 3114 | 5,986 | 44 | 11 | 14 | 26 | 5 |
| 31 | Brockton | 5108 | 6,339 | 18 | 44 | 12 | 2 | 22 |
| 32 | Mission Hill | 81001 | 4,890 | 45 | 14 | 19 | 19 | 2 |
| 33 | Malden | 3418 | 6,554 | 46 | 20 | 13 | 16 | 5 |
| 34 | South Boston | 607 | 1,893 | 19 | 20 | 46 | 10 | 5 |
| 35 | Brockton | 5107 | 5,656 | 46 | 31 | 8 | 4 | 11 |
| 36 | Brockton | 5112 | 4,849 | 47 | 26 | 11 | 1 | 13 |
| 37 | Somerville | 351404 | 4,289 | 47 | 7 | 22 | 13 | 11 |
| 38 | Lynn | 2071 | 3,513 | 18 | 11 | 48 | 19 | 3 |
| 39 | Framingham | 383101 | 4,923 | 23 | 10 | 48 | 1 | 18 |
| 40 | Mission Hill | 811 | 4,091 | 48 | 21 | 15 | 13 | 2 |
The 40 census tracts in the Boston CSA with the highest percentage of residents who identify as Hispanic or Latino:[23]
| Rank | City or Neighborhood | Census Tract | Population | % Hispanic or Latino |
|---|---|---|---|---|
| 1 | Lawrence | 2525 | 3,810 | 94 |
| 2 | Lawrence | 2509 | 2,193 | 93 |
| 3 | Lawrence | 2504 | 3,858 | 90 |
| 4 | Lawrence | 2503 | 2,101 | 89 |
| 5 | Lawrence | 2513 | 3,721 | 89 |
| 6 | Lawrence | 2512 | 1,356 | 86 |
| 7 | Lawrence | 2507 | 4,756 | 86 |
| 8 | Lawrence | 251 | 1,782 | 85 |
| 9 | Chelsea | 1602 | 4,043 | 83 |
| 10 | Lawrence | 2506 | 5,599 | 83 |
| 11 | Lawrence | 2514 | 5,053 | 77 |
| 12 | Chelsea | 160101 | 7,551 | 76 |
| 13 | Lawrence | 2501 | 2,329 | 75 |
| 14 | Lawrence | 2516 | 5,977 | 74 |
| 15 | Lawrence | 2511 | 2,937 | 73 |
| 16 | Lawrence | 2502 | 5,524 | 72 |
| 17 | Chelsea | 1604 | 2,716 | 71 |
| 18 | Chelsea | 160501 | 5,604 | 71 |
| 19 | Providence | 16 | 8,540 | 70 |
| 20 | Lawrence | 2515 | 6,149 | 70 |
| 21 | Worcester | 732001 | 3,327 | 67 |
| 22 | East Boston | 506 | 2,063 | 67 |
| 23 | East Boston | 502 | 5,231 | 66 |
| 24 | East Boston | 507 | 4,504 | 65 |
| 25 | East Boston | 50901 | 4,165 | 65 |
| 26 | Providence | 2 | 6,452 | 64 |
| 27 | Providence | 4 | 3,761 | 64 |
| 28 | Providence | 14 | 6,693 | 63 |
| 29 | Providence | 5 | 3,040 | 63 |
| 30 | Central Falls | 11 | 5,534 | 63 |
| 31 | Lawrence | 2508 | 6,932 | 63 |
| 32 | Chelsea | 160502 | 4,460 | 62 |
| 33 | Methuen | 2524 | 4,175 | 62 |
| 34 | Providence | 17 | 3,744 | 62 |
| 35 | Providence | 18 | 7,114 | 61 |
| 36 | Central Falls | 111 | 4,176 | 61 |
| 37 | East Boston | 50101 | 5,115 | 61 |
| 38 | Lawrence | 2517 | 5,145 | 61 |
| 39 | Providence | 3 | 7,714 | 60 |
| 40 | Central Falls | 108 | 4,763 | 59 |
Census tracts in the Boston CSA with the highest percentage of residents who identify as Black American:[23]
| Rank | City or Neighborhood | Census Tract | Population | % Black |
|---|---|---|---|---|
| 1 | Mattapan | 101101 | 3,115 | 84 |
| 2 | Mattapan | 101102 | 4,396 | 84 |
| 3 | Mattapan | 101001 | 5,480 | 83 |
| 4 | Mattapan | 1003 | 3,303 | 80 |
| 5 | Mattapan | 1002 | 2,787 | 78 |
| 6 | Mattapan | 101002 | 4,979 | 77 |
| 7 | Dorchester | 923 | 2,893 | 77 |
| 8 | Roxbury | 82 | 2,815 | 74 |
| 9 | Roxbury | 817 | 3,820 | 71 |
| 10 | Hyde Park | 1404 | 7,650 | 71 |
| 11 | Roxbury | 901 | 4,571 | 71 |
| 12 | Dorchester | 919 | 3,860 | 70 |
| 13 | Dorchester | 1004 | 4,865 | 68 |
| 14 | Roxbury | 819 | 3,115 | 66 |
| 15 | Roxbury | 924 | 5,277 | 66 |
| 16 | Roxbury | 818 | 2,898 | 65 |
| 17 | Mattapan | 1001 | 5,510 | 64 |
| 18 | Roxbury | 815 | 2,134 | 62 |
| 19 | Roxbury | 821 | 5,025 | 62 |
| 20 | Roxbury | 803 | 1,769 | 60 |
| 21 | Roxbury | 903 | 3,179 | 58 |
| 22 | Dorchester | 1009 | 4,072 | 58 |
| 23 | Dorchester | 1005 | 5,909 | 55 |
| 24 | Hyde Park | 1403 | 6,382 | 54 |
| 25 | Dorchester | 92 | 4,945 | 54 |
| 26 | Roxbury | 902 | 2,233 | 53 |
| 27 | Dorchester | 918 | 3,452 | 52 |
| 28 | Roxbury | 904 | 3,659 | 52 |
| 29 | Roxbury | 814 | 3,003 | 50 |
| 30 | Roxbury | 80401 | 2,710 | 50 |
| 31 | Roslindale | 140106 | 1,901 | 49 |
| 32 | Dorchester | 917 | 3,069 | 47 |
| 33 | Dorchester | 914 | 2,741 | 46 |
| 34 | Brockton | 5108 | 6,339 | 44 |
| 35 | Roxbury | 805 | 3,096 | 44 |
| 36 | Roxbury | 801 | 3,350 | 43 |
| 37 | Randolph | 420302 | 7,703 | 42 |
| 38 | Roxbury | 813 | 4,760 | 42 |
| 39 | Dorchester | 922 | 3,349 | 42 |
| 40 | Randolph | 420202 | 6,303 | 40 |
Census tracts in the Boston CSA with the highest percentage of residents who identify as Asian American:[23]
| Rank | City or Neighborhood | Census Tract | Population | % Asian |
|---|---|---|---|---|
| 1 | South End | 70402 | 1,723 | 70 |
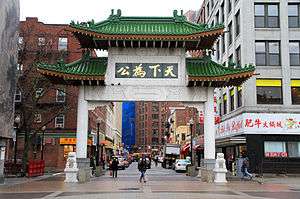
| 2 | Chinatown | 702 | 5,218 | 58 |
| 3 | Lowell | 3112 | 3,267 | 55 |
| 4 | Lowell | 3118 | 3,513 | 54 |
| 5 | Lowell | 3117 | 5,098 | 47 |
| 6 | Quincy | 417502 | 4,639 | 45 |
| 7 | Quincy | 4172 | 8,182 | 44 |
| 8 | Malden | 3413 | 5,439 | 39 |
| 9 | Lowell | 3113 | 4,057 | 38 |
| 10 | Westborough | 742402 | 3,026 | 38 |
| 11 | Quincy | 417501 | 5,004 | 37 |
| 12 | Cambridge | 353102 | 5,040 | 36 |
| 13 | Quincy | 417802 | 3,150 | 35 |
| 14 | Lowell | 3111 | 2,410 | 34 |
| 15 | Lowell | 3115 | 2,974 | 33 |
| 16 | Dorchester | 92101 | 6,451 | 31 |
| 17 | Quincy | 417601 | 5,196 | 30 |
| 18 | Fenway–Kenmore | 10103 | 4,569 | 29 |
| 19 | Quincy | 4180002 | 7,020 | 28 |
| 20 | Quincy | 417602 | 5,155 | 28 |
| 21 | Chinatown/Leather District/Downtown | 70101 | 5,902 | 27 |
| 22 | Cambridge | 3539 | 7,090 | 27 |
| 23 | Lowell | 3114 | 5,986 | 26 |
| 24 | Lowell | 3116 | 5,295 | 26 |
| 25 | Lowell | 3107 | 4,441 | 26 |
| 26 | Quincy | 4171 | 4,264 | 26 |
| 27 | Dorchester | 916 | 3,138 | 26 |
| 28 | Malden | 3412 | 6,857 | 25 |
| 29 | Malden | 341102 | 4,564 | 25 |
| 30 | Malden | 341101 | 3,675 | 25 |
| 31 | Acton | 363102 | 5,909 | 25 |
| 32 | Dorchester | 911 | 4,861 | 25 |
| 33 | Allston-Brighton | 703 | 2,791 | 24 |
| 34 | Lexington | 3583 | 5,526 | 24 |
| 35 | Quincy | 418004 | 4,280 | 23 |
| 36 | Brookline | 4009 | 3,865 | 22 |
| 37 | Cambridge | 3532 | 4,897 | 22 |
| 38 | Cambridge | 352101 | 1,654 | 22 |
| 39 | Shrewsbury | 7391 | 9,557 | 22 |
| 40 | Westborough | 7612 | 5,780 | 22 |
Census tracts in the Boston CSA with the highest percentage of residents who identify as Irish American:[24]
| City or Neighborhood | Census Tract | Population | % Irish |
|---|---|---|---|
| South Boston | 60101 | 3,106 | 68 |
| Milton | 416400 | 6,069 | 63 |
| Charlestown | 040401 | 2,439 | 63 |
| Dorchester | 1007 | 4,322 | 63 |
| South Boston | 608 | 3,964 | 62 |
| South Boston | 604 | 4,904 | 61 |
| Milton | 416101 | 5,724 | 58 |
| Marshfield | 506204 | 4,886 | 57 |
| Weymouth | 422100 | 5,293 | 57 |
| Quincy | 417801 | 5,443 | 55 |
| Hull | 500101 | 3,702 | 55 |
| Scituate | 505101 | 3,860 | 55 |
| West Roxbury | 130402 | 4,637 | 54 |
| Quincy | 417400 | 2,566 | 53 |
| South Boston | 60301 | 3,076 | 52 |
| Abington | 520100 | 6,458 | 52 |
| Braintree | 419200 | 5,002 | 52 |
| Braintree | 419600 | 6,766 | 52 |
| Abington | 520201 | 3,952 | 52 |
| Pembroke | 508200 | 6,031 | 52 |
Census tracts in the Boston CSA with the highest percentage of residents who identify as Italian American:[25]
| City or Neighborhood | Census Tract | Population | % Italian |
|---|---|---|---|
| Johnston | 012402 | 2,486 | 63 |
| Cranston | 014501 | 5,179 | 58 |
| Johnston | 012500 | 5,490 | 57 |
| Johnston | 012200 | 7,187 | 57 |
| Providence | 011902 | 4,780 | 55 |
| Cranston | 014800 | 5,591 | 55 |
| Saugus | 208102 | 3,343 | 51 |
| Cranston | 014300 | 4,716 | 49 |
| Cranston | 014600 | 6,991 | 49 |
| Cranston | 014502 | 4,096 | 48 |
| Johnston | 012300 | 6,656 | 48 |
| Johnston | 012401 | 6,950 | 48 |
| Stoneham | 337102 | 5,042 | 45 |
| Stoneham | 337202 | 4,849 | 45 |
| Revere | 170200 | 4,564 | 45 |
| Revere | 170502 | 2,818 | 43 |
| Cranston | 013900 | 2,992 | 43 |
| Revere | 170300 | 9,040 | 43 |
| North Providence | 012103 | 2,965 | 43 |
Census tracts in the Boston CSA with the highest percentage of residents who identify as Portuguese American:[26]
| City or Neighborhood | Census Tract | Population | % Portuguese |
|---|---|---|---|
| New Bedford | 652800 | 3,277 | 72 |
| Fall River | 640600 | 4,450 | 69 |
| Dartmouth | 653203 | 5,005 | 65 |
| New Bedford | 652400 | 2,664 | 64 |
| New Bedford | 652000 | 2,676 | 62 |
| Fall River | 640500 | 5,165 | 60 |
| Fall River | 641200 | 2,803 | 59 |
| New Bedford | 650500 | 3,141 | 58 |
| Fall River | 640901 | 5,071 | 58 |
| New Bedford | 650400 | 3,773 | 57 |
| New Bedford | 652500 | 2,589 | 56 |
| East Providence | 010400 | 6,661 | 55 |
| New Bedford | 652300 | 2,870 | 54 |
| Fall River | 641000 | 2,419 | 54 |
| Fall River | 640300 | 3,693 | 53 |
| Westport | 646101 | 7,356 | 53 |
| Fall River | 640700 | 2,900 | 53 |
| Fall River | 640400 | 2,682 | 53 |
| New Bedford | 650101 | 5,753 | 53 |
| Fall River | 640100 | 5,358 | 52 |
Census tracts in the Boston CSA with French or French Canadian listed as first ancestry:[27]
| City or Neighborhood | Census Tract | Population | % French |
|---|---|---|---|
| Woonsocket | 018500 | 2,831 | 66 |
| Woonsocket | 017700 | 3,518 | 61 |
| Woonsocket | 017500 | 3,128 | 59 |
| Woonsocket | 017800 | 2,514 | 58 |
| Burrillville | 013001 | 3,479 | 56 |
| North Smithfield | 012802 | 2,391 | 54 |
| North Smithfield | 012803 | 4,776 | 53 |
| Burrillville | 013002 | 7,539 | 53 |
| North Smithfield | 012801 | 4,800 | 52 |
| Manchester | 002300 | 3,758 | 52 |
| Woonsocket | 017900 | 3,049 | 51 |
| Burrillville | 012900 | 4,937 | 50 |
| Manchester | 000202 | 2,297 | 49 |
| Manchester | 002100 | 4,782 | 49 |
| Woonsocket | 017600 | 2,560 | 49 |
| Manchester | 002600 | 5,746 | 48 |
| Manchester | 002200 | 3,232 | 47 |
| Woonsocket | 018400 | 6,527 | 47 |
| Blackstone | 747101 | 5,110 | 47 |
| Woonsocket | 018000 | 2,680 | 46 |
Other
Greater Boston has a sizable Jewish community, estimated at between 210,000 people,[28][29] and 261,000[30] or 5–6% of the Greater Boston metro population, compared with about 2% for the nation as a whole. Contrary to national trends, the number of Jews in Greater Boston has been growing, fueled by the fact that 60% of children in Jewish mixed-faith families are raised Jewish, compared with roughly one in three nationally.[28]
The City of Boston also has one of the largest LGBT populations per capita. It ranks fifth of all major cities in the country (behind San Francisco, and slightly behind Seattle, Atlanta, and Minneapolis respectively), with 12.3% of the city identifying as gay, lesbian, or bisexual.[31]
| County | 2016 Estimate | 2010 Census | Change | Area | Density |
|---|---|---|---|---|---|
| Essex County, Massachusetts | 779,018 | 743,159 | +4.83% | 492.56 sq mi (1,275.7 km2) | 1,582/sq mi (611/km2) |
| Middlesex County, Massachusetts | 1,589,774 | 1,503,085 | +5.77% | 817.82 sq mi (2,118.1 km2) | 1,944/sq mi (751/km2) |
| Norfolk County, Massachusetts | 697,181 | 670,850 | +3.93% | 396.11 sq mi (1,025.9 km2) | 1,760/sq mi (680/km2) |
| Plymouth County, Massachusetts | 513,565 | 494,919 | +3.77% | 659.07 sq mi (1,707.0 km2) | 779/sq mi (301/km2) |
| Suffolk County, Massachusetts | 784,230 | 722,023 | +8.62% | 58.15 sq mi (150.6 km2) | 13,486/sq mi (5,207/km2) |
| Rockingham County, New Hampshire | 303,251 | 295,223 | +2.72% | 694.72 sq mi (1,799.3 km2) | 437/sq mi (169/km2) |
| Strafford County, New Hampshire | 127,428 | 123,143 | +3.48% | 368.97 sq mi (955.6 km2) | 345/sq mi (133/km2) |
| Total | 4,794,447 | 4,552,402 | +5.32% | 3,487.40 sq mi (9,032.3 km2) | 1,375/sq mi (531/km2) |
Higher education


A long established center of higher education, the area includes many community colleges, two-year schools, and internationally prominent undergraduate and graduate institutions. The graduate schools include highly regarded schools of law, medicine, business, technology, international relations, public health, education, and religion. Greater Boston contains seven R1 Research Institutions as per the Carnegie Classification of Institutions of Higher Education. This is, by far, the highest number of such institutions in a single Metropolitan Statistical Area in the United States.
Selected statistics
Changes in house prices for the Greater Boston area are publicly tracked on a regular basis using the Case–Shiller index; the statistic is published by Standard & Poor's and is also a component of S&P's 10-city composite index of the value of the residential real estate market.
Major companies
- Companies along, inside or outside I-495, outside Route 128:
- Abbott Laboratories, in Worcester (pharmaceutical laboratory)
- Advanced Cell Technology, in Worcester (research laboratory)
- AMD, in Boxborough
- Analog Devices, in Norwood
- Atlantic Broadband, in Quincy
- Atlantic Tele-Network, in Beverly
- Avid Technology, Inc, in Burlington (headquarters)
- Azimuth Systems, in Acton
- Bain & Company, in Boston (headquarters)
- Bain Capital, in Boston (headquarters)
- Bertucci's Corporation, in Northborough (headquarters)
- BJ's Wholesale Club, Inc., in Westborough (headquarters)
- Bose Corporation, in Framingham (headquarters)
- Boston Properties, Inc., in Boston (headquarters)
- Boston Scientific Corporation, in Marlborough (headquarters)
- Charles River Laboratories, in Wilmington (headquarters)
- Cisco Systems, in Boxborough
- CommunityRoot, in Boston (headquarters)
- David Clark Company, in Worcester (manufacturer of space suits)
- Diebold, in Marlborough (regional headquarters)
- Dell Technologies, in Hopkinton (headquarters)
- Evergreen Solar, in Marlborough (headquarters)
- Hewlett-Packard, in Marlborough (regional headquarters)
- Schneider Electric, in Andover, Massachusetts
- HourlyNerd, in Boston
- Innerscope Research, in Boston (headquarters)
- Intel Corporation, in Hudson
- Kronos Incorporated, in Chelmsford, Massachusetts (headquarters)
- Marshalls, Inc, in Framingham (headquarters)
- The MathWorks, in Natick
- MITRE Corporation, in Bedford (headquarters)
- Morgan Construction Company, in Worcester (rolling steel mill technology)
- National Amusements, in Norwood (headquarters)
- Novartis, headquartered in Cambridge, with locations worldwide (a Swiss multinational pharmaceutical company based in Basel)
- Philips Electronics North America, in Andover (regional headquarters)
- Philips Healthcare, in Andover (global headquarters) and Framingham
- Red Hat, in Westford (engineering headquarters)
- Reed & Barton in Taunton (factory and headquarters)
- Saint-Gobain, in Worcester
- Sepracor, Inc., in Marlborough (headquarters)
- Staples, Inc., in Framingham (headquarters)
- Stop & Shop, in Quincy (headquarters)
- TJX Corporation, in Framingham (headquarters)
- UniFirst, in Wilmington (headquarters)
- WB Mason, in Brockton (headquarters)
- Wyman-Gordon, in Grafton (complex metal components and products)
- Companies along or inside I-95 (Route 128), not including Boston:
- Akamai Technologies, in Cambridge (headquarters)
- AstraZeneca, in Waltham (R&D)
- BBN Technologies, in Cambridge (headquarters)
- Biocell Center, in Medford (North American headquarters)
- Biogen Idec, in Weston (North American headquarters)
- Carl Zeiss SMT, in Peabody (North American headquarters)
- Constant Contact, in Waltham
- Dunkin' Brands, in Canton (headquarters)
- Facebook, in Cambridge
- General Electric Aviation, in Lynn
- Global Partners, in Waltham (headquarters)
- Google Inc., in Cambridge
- Haemonetics, in Braintree
- IBM, in Waltham, Cambridge and Littleton
- InterSystems Corporation, in Cambridge (headquarters)
- iRobot Corporation, in Burlington (headquarters)
- Keurig, in Burlington (headquarters)
- Lionbridge, in Waltham (US headquarters)
- Meditech, in Westwood (headquarters)
- Microsoft Corporation, in Cambridge
- Millennium Pharmaceuticals, in Cambridge
- National Amusements (Parent company of CBS and Viacom), in Dedham (headquarters)
- National Grid, in Waltham (US headquarters)
- NetApp Inc, in Waltham
- NetBlazr, in Watertown
- Nokia, in Burlington
- Novartis AG, Inc, in Cambridge (research headquarters)
- Novell, Inc., in Waltham
- Nuance Communications, in Burlington
- Oracle Corporation in Burlington
- Osram Sylvania in Danvers (headquarters)
- Parametric Technology Corporation in Needham (headquarters)
- Philips Lighting in Burlington
- Progress Software in Bedford (headquarters)
- Raytheon, in Waltham (headquarters)
- Reebok, in Canton (US headquarters)
- Sanofi Genzyme, in Cambridge (headquarters; many locations in the area)
- SharkNinja, in Needham (headquarters)
- SunSetter Products, LP, in Malden (headquarters)
- Teradyne, in North Reading (headquarters)
- Thermo Fisher Scientific, in Waltham (headquarters)
- TripAdvisor, LLC, in Needham (headquarters)
- Twitter, in Cambridge
- Vistaprint, in Lexington (North American headquarters)[36]
- Major companies inside Boston proper:
- American Tower (headquarters)
- Au Bon Pain (headquarters)
- Bain & Company (headquarters)
- Blue Cross Blue Shield of Massachusetts (headquarters)
- Boston Consulting Group (headquarters)
- Converse (headquarters)
- Fidelity Investments (headquarters)
- General Electric (headquarters)
- The Gillette Company, now owned by Procter & Gamble (headquarters)
- Houghton Mifflin Harcourt (headquarters)
- Iora Health (headquarters)
- John Hancock Financial Services, Inc, now the United States division of Canada's Manulife Financial
- Liberty Mutual (headquarters)
- LogMeIn (headquarters)
- LPL Financial (headquarters)
- Mendix (headquarters)
- New Balance Athletic Shoe, Inc. (headquarters)
- Partners HealthCare (moving to Assembly Row, Somerville)
- Puma (North American headquarters, moving to Assembly Row, Somerville)
- Putnam Investments (headquarters)
- Rapid7
- Sapient Corporation (headquarters)
- Sonesta International Hotels Corp. (headquarters)
- State Street Corporation (headquarters)
- Steward Health Care System (headquarters)
- Toast, Inc. (headquarters)
- Threat Stack (headquarters)
- Vertex Pharmaceuticals (headquarters)
- Wayfair (headquarters)
- Wellington Management Company (headquarters)
- Zipcar (headquarters)
Sports
| Club | Sport | League | Stadium | Established | League titles |
|---|---|---|---|---|---|
| Boston Bruins | Ice hockey | National Hockey League | TD Garden (Boston) | 1924 | 6 Stanley Cups 7 Eastern Conference Titles |
| Boston Cannons | Lacrosse | Major League Lacrosse | Harvard Stadium (Boston) | 2001 | 1 MLL Championship |
| Boston Celtics | Basketball | National Basketball Association | TD Garden (Boston) | 1946 | 17 NBA Championships 21 Eastern Conference Titles |
| Boston Pride | Ice hockey | National Women's Hockey League | Bright Hockey Center (Boston) | 2015 | 1 Isobel Cup |
| Boston Red Sox | Baseball | Major League Baseball | Fenway Park (Boston) | 1901 | 9 MLB World Series Champions 14 American League Pennants |
| New England Patriots | Football | National Football League | Gillette Stadium (Foxboro) | 1960 | 6Super Bowl Champions 11 AFC Champions |
| New England Revolution | Soccer | Major League Soccer | Gillette Stadium (Foxboro) | 1995 | 1 US Open Cup 1 SuperLiga |
Annual sporting events include:
- The Boston Marathon, which follows a course from Hopkinton to Boston
- The Head of the Charles Regatta
- The Lenox Industrial Tools 301, Sylvania 300 and New Hampshire Indy 225 auto races at the New Hampshire Motor Speedway oval track.
Transportation
State Highways


Bridges and tunnels
- Callahan Tunnel, carrying Route 1A Northbound
- Charles M. Braga Jr. Memorial Bridge, carrying Interstate 195
- Claiborne Pell Newport Bridge, carrying Route 138
- Fore River Bridge, carrying Massachusetts Route 3A
- Sumner Tunnel, carrying Route 1A Southbound
- Ted Williams Tunnel, carrying I-90
- Thomas P. O'Neill Jr. Tunnel, carrying I-93 and Routes 1 and 3 concurrently
- Tobin Bridge, carrying Route 1
- Zakim Bunker Hill Bridge, carrying Interstate 93, Route 1 and Route 3 concurrently
Airports
- Logan International Airport in Boston, 3 miles (4.8 km) northeast of downtown Boston, New England's largest transportation center
- Manchester-Boston Regional Airport in Manchester, New Hampshire
- T. F. Green Airport in Warwick, Rhode Island
- Hanscom Field in Bedford
- Norwood Memorial Airport
- Worcester Regional Airport
- Beverly Regional Airport
- Lawrence Municipal Airport
Rail and bus
- Massachusetts Bay Transportation Authority (MBTA, generally known as the "T") rapid transit lines:
- Red Line heavy rail: Cambridge–Braintree and Boston (Mattapan)
- Orange Line heavy rail: Boston (Jamaica Plain)–Malden
- Blue Line heavy rail: Boston–Revere
- Green Line light rail/streetcar: Cambridge–Brookline and Newton
- Ashmont–Mattapan High Speed Line streetcar: Ashmont-Milton-Mattapan
- Silver Line Bus Rapid Transit South Station–Logan Airport and Downtown–Dudley Square
- MBTA Commuter Rail
- Old Colony Lines serving Plymouth County
- Providence/Stoughton Line serving northern Bristol County, western Norfolk County, Kent County, and Washington County, connecting to Providence, Rhode Island
- Fairmount Line shuttle service from South Station
- Franklin Line serving western Norfolk County
- Greenbush Line serving Boston's South Shore
- Needham Line serving Boston suburbs and Needham
- Framingham/Worcester Line serving southwestern Middlesex County, connecting to Worcester
- Fitchburg Line serving northwestern Middlesex County, connecting to Fitchburg
- Lowell Line serving northern Middlesex County
- Haverhill/Reading Line and Newburyport/Rockport Line serving Essex County & Boston's North Shore
- Amtrak service to New York City and Washington, D.C.
- Amtrak Downeaster service to Maine from North Station
- Massport Logan Express
- Plymouth & Brockton Street Railway Co.
The first railway line in the United States was in Quincy. See Neponset River.
The following Regional Transit Authorities have bus service that connects with MBTA commuter rail stations:
- Brockton Area Transit Authority
- Cape Ann Transportation Authority
- Greater Attleboro Taunton Regional Transit Authority
- Lowell Regional Transit Authority
- Merrimack Valley Regional Transit Authority
- MetroWest Regional Transit Authority
- Montachusett Regional Transit Authority
- Rhode Island Public Transit Authority
- Worcester Regional Transit Authority
Ocean transportation
Geography
- Rivers
- Hills
Climate
| Climate data for Concord Municipal Airport, New Hampshire (1981−2010 normals,[lower-alpha 1] extremes 1903–present)[lower-alpha 2] | |||||||||||||
|---|---|---|---|---|---|---|---|---|---|---|---|---|---|
| Month | Jan | Feb | Mar | Apr | May | Jun | Jul | Aug | Sep | Oct | Nov | Dec | Year |
| Record high °F (°C) | 72 (22) |
74 (23) |
89 (32) |
95 (35) |
98 (37) |
101 (38) |
102 (39) |
101 (38) |
98 (37) |
92 (33) |
80 (27) |
73 (23) |
102 (39) |
| Mean maximum °F (°C) | 50.8 (10.4) |
53.7 (12.1) |
66.6 (19.2) |
81.5 (27.5) |
88.7 (31.5) |
92.0 (33.3) |
93.1 (33.9) |
91.8 (33.2) |
87.7 (30.9) |
78.5 (25.8) |
68.7 (20.4) |
56.0 (13.3) |
95.5 (35.3) |
| Average high °F (°C) | 30.8 (−0.7) |
34.9 (1.6) |
43.8 (6.6) |
57.4 (14.1) |
68.9 (20.5) |
77.4 (25.2) |
82.3 (27.9) |
80.9 (27.2) |
72.6 (22.6) |
60.5 (15.8) |
48.4 (9.1) |
36.3 (2.4) |
58.0 (14.4) |
| Average low °F (°C) | 10.4 (−12.0) |
13.8 (−10.1) |
22.5 (−5.3) |
32.7 (0.4) |
42.6 (5.9) |
52.5 (11.4) |
57.7 (14.3) |
56.1 (13.4) |
47.4 (8.6) |
35.8 (2.1) |
28.2 (−2.1) |
17.2 (−8.2) |
34.8 (1.6) |
| Mean minimum °F (°C) | −11.2 (−24.0) |
−8.2 (−22.3) |
0.8 (−17.3) |
19.4 (−7.0) |
28.1 (−2.2) |
37.9 (3.3) |
45.4 (7.4) |
42.0 (5.6) |
31.8 (−0.1) |
21.2 (−6.0) |
11.1 (−11.6) |
−2.8 (−19.3) |
−14.6 (−25.9) |
| Record low °F (°C) | −35 (−37) |
−37 (−38) |
−20 (−29) |
4 (−16) |
21 (−6) |
30 (−1) |
35 (2) |
29 (−2) |
20 (−7) |
10 (−12) |
−17 (−27) |
−24 (−31) |
−37 (−38) |
| Average precipitation inches (mm) | 2.70 (69) |
2.62 (67) |
3.27 (83) |
3.41 (87) |
3.66 (93) |
3.69 (94) |
3.74 (95) |
3.18 (81) |
3.38 (86) |
4.04 (103) |
3.72 (94) |
3.20 (81) |
40.61 (1,033) |
| Average snowfall inches (cm) | 18.1 (46) |
12.3 (31) |
11.1 (28) |
2.8 (7.1) |
0 (0) |
0 (0) |
0 (0) |
0 (0) |
0 (0) |
trace | 2.6 (6.6) |
14.5 (37) |
61.4 (156) |
| Average precipitation days (≥ 0.01 in) | 10.8 | 9.5 | 11.5 | 11.8 | 12.4 | 12.7 | 10.9 | 9.8 | 9.3 | 10.1 | 11.2 | 10.9 | 130.9 |
| Average snowy days (≥ 0.1 in) | 8.2 | 6.5 | 5.3 | 1.2 | 0 | 0 | 0 | 0 | 0 | 0 | 1.9 | 6.6 | 29.7 |
| Average relative humidity (%) | 67.9 | 66.0 | 64.8 | 62.0 | 65.0 | 70.9 | 71.8 | 74.5 | 76.3 | 72.8 | 73.3 | 72.3 | 69.8 |
| Mean monthly sunshine hours | 162.8 | 171.8 | 210.5 | 223.2 | 258.4 | 274.3 | 295.8 | 261.9 | 214.7 | 183.4 | 127.8 | 134.8 | 2,519.4 |
| Percent possible sunshine | 56 | 58 | 57 | 56 | 57 | 60 | 64 | 61 | 57 | 54 | 44 | 48 | 56 |
| Average ultraviolet index | 1 | 2 | 4 | 5 | 7 | 8 | 8 | 7 | 6 | 3 | 2 | 1 | 5 |
| Source 1: NOAA (relative humidity and sun 1961–1990)[37][38][39] | |||||||||||||
| Source 2: Weather Atlas [40] (sunshine data) | |||||||||||||
Climate data for Boston (Logan Airport), 1981−2010 normals[lower-alpha 3], extremes 1872−present[lower-alpha 4] | |||||||||||||
|---|---|---|---|---|---|---|---|---|---|---|---|---|---|
| Month | Jan | Feb | Mar | Apr | May | Jun | Jul | Aug | Sep | Oct | Nov | Dec | Year |
| Record high °F (°C) | 74 (23) |
73 (23) |
89 (32) |
94 (34) |
97 (36) |
100 (38) |
104 (40) |
102 (39) |
102 (39) |
90 (32) |
83 (28) |
76 (24) |
104 (40) |
| Mean maximum °F (°C) | 56.4 (13.6) |
57.7 (14.3) |
67.6 (19.8) |
80.7 (27.1) |
87.3 (30.7) |
92.1 (33.4) |
94.9 (34.9) |
93.3 (34.1) |
87.9 (31.1) |
79.1 (26.2) |
70.5 (21.4) |
61.3 (16.3) |
96.2 (35.7) |
| Average high °F (°C) | 35.8 (2.1) |
38.7 (3.7) |
45.4 (7.4) |
55.6 (13.1) |
66.0 (18.9) |
75.9 (24.4) |
81.4 (27.4) |
79.6 (26.4) |
72.4 (22.4) |
61.4 (16.3) |
51.5 (10.8) |
41.2 (5.1) |
58.8 (14.9) |
| Daily mean °F (°C) | 29.0 (−1.7) |
31.7 (−0.2) |
38.3 (3.5) |
48.1 (8.9) |
58.0 (14.4) |
67.7 (19.8) |
73.4 (23.0) |
72.1 (22.3) |
64.9 (18.3) |
54.0 (12.2) |
44.8 (7.1) |
34.7 (1.5) |
51.4 (10.8) |
| Average low °F (°C) | 22.2 (−5.4) |
24.7 (−4.1) |
31.1 (−0.5) |
40.6 (4.8) |
49.9 (9.9) |
59.5 (15.3) |
65.4 (18.6) |
64.6 (18.1) |
57.4 (14.1) |
46.5 (8.1) |
38.0 (3.3) |
28.2 (−2.1) |
44.1 (6.7) |
| Mean minimum °F (°C) | 4.1 (−15.5) |
8.5 (−13.1) |
14.7 (−9.6) |
30.7 (−0.7) |
40.8 (4.9) |
49.6 (9.8) |
57.3 (14.1) |
55.4 (13.0) |
45.8 (7.7) |
34.9 (1.6) |
24.2 (−4.3) |
11.1 (−11.6) |
2.3 (−16.5) |
| Record low °F (°C) | −13 (−25) |
−18 (−28) |
−8 (−22) |
11 (−12) |
31 (−1) |
41 (5) |
50 (10) |
46 (8) |
34 (1) |
25 (−4) |
−2 (−19) |
−17 (−27) |
−18 (−28) |
| Average precipitation inches (mm) | 3.36 (85) |
3.25 (83) |
4.32 (110) |
3.74 (95) |
3.49 (89) |
3.68 (93) |
3.43 (87) |
3.35 (85) |
3.44 (87) |
3.94 (100) |
3.99 (101) |
3.78 (96) |
43.77 (1,112) |
| Average snowfall inches (cm) | 12.9 (33) |
10.9 (28) |
7.8 (20) |
1.9 (4.8) |
0 (0) |
0 (0) |
0 (0) |
0 (0) |
0 (0) |
trace | 1.3 (3.3) |
9.0 (23) |
43.8 (111) |
| Average precipitation days (≥ 0.01 in) | 11.3 | 9.8 | 11.6 | 11.2 | 12.0 | 10.9 | 9.6 | 9.4 | 8.6 | 9.4 | 10.6 | 11.6 | 126.0 |
| Average snowy days (≥ 0.1 in) | 6.7 | 5.3 | 4.2 | 0.7 | 0 | 0 | 0 | 0 | 0 | 0.1 | 0.8 | 4.6 | 22.4 |
| Average relative humidity (%) | 62.3 | 62.0 | 63.1 | 63.0 | 66.7 | 68.5 | 68.4 | 70.8 | 71.8 | 68.5 | 67.5 | 65.4 | 66.5 |
| Mean monthly sunshine hours | 163.4 | 168.4 | 213.7 | 227.2 | 267.3 | 286.5 | 300.9 | 277.3 | 237.1 | 206.3 | 143.2 | 142.3 | 2,633.6 |
| Percent possible sunshine | 56 | 57 | 58 | 57 | 59 | 63 | 65 | 64 | 63 | 60 | 49 | 50 | 59 |
| Average ultraviolet index | 1 | 2 | 4 | 5 | 7 | 8 | 8 | 8 | 6 | 4 | 2 | 1 | 5 |
| Source 1: NOAA (relative humidity and sun 1961−1990)[42][43][44] | |||||||||||||
| Source 2: Weather Atlas [45] (sunshine data) | |||||||||||||
| Climate data for Boston | |||||||||||||
|---|---|---|---|---|---|---|---|---|---|---|---|---|---|
| Month | Jan | Feb | Mar | Apr | May | Jun | Jul | Aug | Sep | Oct | Nov | Dec | Year |
| Average sea temperature °F (°C) | 41.3 (5.2) |
38.1 (3.4) |
38.4 (3.5) |
43.1 (6.2) |
49.2 (9.5) |
58.4 (14.7) |
65.7 (18.7) |
67.9 (20.0) |
64.8 (18.2) |
59.4 (15.3) |
52.3 (11.3) |
46.6 (8.2) |
52.1 (11.2) |
| Source: Weather Atlas [45] | |||||||||||||
| Climate data for Providence, Rhode Island (T. F. Green Airport), 1981–2010 normals,[lower-alpha 5] extremes 1904–present[lower-alpha 6] | |||||||||||||
|---|---|---|---|---|---|---|---|---|---|---|---|---|---|
| Month | Jan | Feb | Mar | Apr | May | Jun | Jul | Aug | Sep | Oct | Nov | Dec | Year |
| Record high °F (°C) | 69 (21) |
72 (22) |
90 (32) |
98 (37) |
96 (36) |
98 (37) |
102 (39) |
104 (40) |
100 (38) |
88 (31) |
81 (27) |
77 (25) |
104 (40) |
| Mean maximum °F (°C) | 57.2 (14.0) |
58.3 (14.6) |
68.4 (20.2) |
80.3 (26.8) |
86.2 (30.1) |
91.3 (32.9) |
94.5 (34.7) |
92.3 (33.5) |
87.0 (30.6) |
78.1 (25.6) |
70.0 (21.1) |
60.8 (16.0) |
96.2 (35.7) |
| Average high °F (°C) | 37.4 (3.0) |
40.3 (4.6) |
47.8 (8.8) |
58.6 (14.8) |
68.4 (20.2) |
77.5 (25.3) |
82.8 (28.2) |
81.4 (27.4) |
74.2 (23.4) |
63.3 (17.4) |
53.2 (11.8) |
42.3 (5.7) |
60.6 (15.9) |
| Average low °F (°C) | 21.0 (−6.1) |
23.6 (−4.7) |
30.0 (−1.1) |
39.6 (4.2) |
48.6 (9.2) |
58.4 (14.7) |
64.2 (17.9) |
63.2 (17.3) |
55.3 (12.9) |
43.9 (6.6) |
35.7 (2.1) |
26.3 (−3.2) |
42.5 (5.8) |
| Mean minimum °F (°C) | 2.9 (−16.2) |
7.7 (−13.5) |
14.7 (−9.6) |
28.8 (−1.8) |
36.9 (2.7) |
47.1 (8.4) |
55.0 (12.8) |
52.4 (11.3) |
42.2 (5.7) |
31.2 (−0.4) |
21.7 (−5.7) |
10.4 (−12.0) |
0.9 (−17.3) |
| Record low °F (°C) | −13 (−25) |
−17 (−27) |
1 (−17) |
11 (−12) |
29 (−2) |
39 (4) |
48 (9) |
40 (4) |
32 (0) |
20 (−7) |
6 (−14) |
−12 (−24) |
−17 (−27) |
| Average precipitation inches (mm) | 3.86 (98) |
3.29 (84) |
5.01 (127) |
4.36 (111) |
3.55 (90) |
3.64 (92) |
3.29 (84) |
3.60 (91) |
3.92 (100) |
3.93 (100) |
4.51 (115) |
4.22 (107) |
47.18 (1,198) |
| Average snowfall inches (cm) | 9.0 (23) |
8.5 (22) |
5.5 (14) |
0.6 (1.5) |
0 (0) |
0 (0) |
0 (0) |
0 (0) |
0 (0) |
0 (0) |
1.5 (3.8) |
8.7 (22) |
33.8 (86) |
| Average precipitation days (≥ 0.01 in) | 10.9 | 9.7 | 11.9 | 11.3 | 12.0 | 10.9 | 9.4 | 9.0 | 8.7 | 9.4 | 10.1 | 11.6 | 124.9 |
| Average snowy days (≥ 0.1 in) | 5.7 | 4.6 | 3.5 | 0.4 | 0 | 0 | 0 | 0 | 0 | 0 | 0.6 | 3.9 | 18.7 |
| Average relative humidity (%) | 63.9 | 63.0 | 62.9 | 61.4 | 66.6 | 70.1 | 71.0 | 72.5 | 73.0 | 70.2 | 68.9 | 67.0 | 67.5 |
| Mean monthly sunshine hours | 171.7 | 172.6 | 215.6 | 225.1 | 254.9 | 274.1 | 290.6 | 262.8 | 233.0 | 208.7 | 148.0 | 148.6 | 2,605.7 |
| Percent possible sunshine | 58 | 58 | 58 | 56 | 57 | 60 | 63 | 61 | 62 | 61 | 50 | 52 | 58 |
| Average ultraviolet index | 1 | 2 | 4 | 6 | 7 | 8 | 8 | 8 | 6 | 4 | 2 | 1 | 5 |
| Source: Weather Atlas [47] | |||||||||||||
| Climate data for Providence | |||||||||||||
|---|---|---|---|---|---|---|---|---|---|---|---|---|---|
| Month | Jan | Feb | Mar | Apr | May | Jun | Jul | Aug | Sep | Oct | Nov | Dec | Year |
| Average sea temperature °F (°C) | 41.4 (5.2) |
38.1 (3.4) |
38.7 (3.8) |
44.1 (6.7) |
50.9 (10.5) |
59.6 (15.3) |
67.0 (19.4) |
69.3 (20.7) |
66.7 (19.3) |
61.6 (16.4) |
54.2 (12.3) |
47.7 (8.8) |
53.3 (11.8) |
| Source: Weather Atlas [47] | |||||||||||||
See also
- Greater Boston League, a high school athletic conference in Massachusetts
Notes
- Mean monthly maxima and minima (i.e. the expected highest and lowest temperature readings at any point during the year or given month) calculated based on data at said location from 1981 to 2010.
- Official records for Concord were kept at downtown from September 1868 to April 1941 and at Concord Municipal Airport since May 1941; snow records date from December 1942. For more information, see ThreadEx
- Mean monthly maxima and minima (i.e. the expected highest and lowest temperature readings at any point during the year or given month) calculated based on data at said location from 1981 to 2010.
- Official records for Boston were kept at downtown from January 1872 to December 1935, and at Logan Airport (KBOS) since January 1936.[41]
- Mean monthly maxima and minima (i.e. the expected highest and lowest temperature readings at any point during the year or given month) calculated based on data at said location from 1981 to 2010.
- Official records for Providence kept at downtown from November 1904 to May 1932 and at T. F. Green Airport since June 1932.[46]
References
- "Housing and Economic Development:Key Industries". mass.gov. Retrieved May 9, 2016.
- "County Population Totals and Components of Change: 2010-2018". United States Census Bureau. Retrieved October 4, 2019.
- Will Joyner (9 April 1999). "Where Literary Legends Took Shape Around Boston". The New York Times. Retrieved May 9, 2016.
- "The 1692 Salem Witch Trials". SalemWitchTrialsMuseum.com. Retrieved May 9, 2016.
- "Faneuil Hall". Celebrateboston.com. Retrieved April 21, 2015.
- "The Temperance Issue in the Election of 1840: Massachusetts". Teachushistory.org. Retrieved May 9, 2016.
- Packer, Barbara (2007). The Transcendentalists. University of Georgia Press; First edition (April 25, 2007). ISBN 978-0820329581.
- "Images of the Antislavery Movement in Massachusetts". Masshist.org. Retrieved May 9, 2016.
- "Massachusetts court strikes down ban on same-sex marriage". Reuters. November 18, 2003. Retrieved April 21, 2015.
- "History of Harvard University". Harvard University. Retrieved April 21, 2015.
- Tamar Lewin (January 28, 2015). "Harvard's Endowment Remains Biggest of All". The New York Times. Retrieved May 9, 2016.
- Richard Wolf (March 16, 2016). "Meet Merrick Garland, Obama's Supreme Court nominee". USA Today. Retrieved May 9, 2016.
- "Kendall Square Initiative". MIT. Retrieved December 1, 2016.
- Lelund Cheung. "When a neighborhood is crowned the most innovative square mile in the world, how do you keep it that way?". Boston Globe Media Partners, LLC. Retrieved December 1, 2016.
- Accessed May 9, 2016.
- "About MAPC". Metropolitan Area Planning Council. Archived from the original on 2007-02-21. Retrieved 2007-05-14.
- "Metropolitan Area Planning Council Strategic Plan 2015–2020" (PDF). Metropolitan Area Planning Council. Archived from the original (PDF) on 2016-10-11. Retrieved 2017-04-22.
- "Transportation Plan – Overview". Boston Region Metropolitan Planning Organization. 2009. Archived from the original on August 29, 2008. Retrieved 2009-09-27.
- "Principal cities of New England city and town areas (NECTAs)" (XLS spreadsheet). U.S. Census Bureau. Retrieved April 26, 2015.
- "Standards for Defining Metropolitan and Micropolitan Statistical Areas" (PDF). Office of Management and Budget. December 27, 2000. Retrieved September 14, 2009.
- "City and Town Population for 2013". U.S. Census Bureau. Archived from the original on 2016-01-19. Retrieved September 19, 2014.
- Jane Walsh (November 25, 2015). "The most Irish town in America is named using US census data". Irish Central. Retrieved May 8, 2016.
- "Mapping the 2010 U.S. Census". The New York Times. U.S. Census Bureau. 13 December 2010.
- "Irish as First Ancestry Population Percentage Rank of Census Tract within 100 miles of Zip Code 02176". Usa.com. Retrieved 4 January 2015.
- "Italian as First Ancestry Population Percentage Rank of Census Tract within 100 miles of Zip Code 02176". Usa.com. Retrieved 4 January 2015.
- "French as First Ancestry Population Percentage Rank of Census Tract within 100 miles of Zip Code 02176". Usa.com. Retrieved 4 January 2015.
- Michael Paulson (2006-11-10). "Jewish population in region rises". The Boston Globe. Retrieved 2009-11-29.
- "Cities with the Largest Jewish Population in the Diaspora". adherents.com. Retrieved 2009-11-29.
- "Metro Area Membership Report". The Association of Religion Data Archives. Retrieved 2009-11-29.
- "12.9% in Seattle are gay or bisexual, second only to S.F., study says". The Seattle Times. The Seattle Times Company. 2006. Retrieved 2009-05-01.
- "2009 Globe 100 – Top Massachusetts-based employers". The Boston Globe. 2010-01-19. Archived from the original on May 22, 2009.
- Archived March 10, 2009, at the Wayback Machine
- "Top Companies in Massachusetts on the Inc. 5000 - Inc.com". Inc.com. Retrieved 4 January 2015.
- Archived October 10, 2007, at the Wayback Machine
- "Who We Are & About Us - Vistaprint". News.vistaprint.com. Archived from the original on 18 October 2014. Retrieved 4 January 2015.
- "NowData - NOAA Online Weather Data". National Oceanic and Atmospheric Administration. Retrieved 2018-02-22.
- "Station Name: NH CONCORD MUNI AP". National Oceanic and Atmospheric Administration. Retrieved 2016-09-11.
- "WMO Climate Normals for CONCORD MUNICIPAL AP, NH 1961–1990". National Oceanic and Atmospheric Administration. Retrieved 2014-03-11.
- "Concord, New Hampshire, USA - Monthly weather forecast and Climate data". Weather Atlas. Retrieved 4 July 2019.
- ThreadEx
- "Station Name: MA BOSTON LOGAN INTL AP". National Oceanic and Atmospheric Administration. Retrieved 2013-03-24.
- "NowData - NOAA Online Weather Data". National Oceanic and Atmospheric Administration. Retrieved 2020-01-13.
- "WMO Climate Normals for BOSTON/LOGAN INT'L AIRPORT, MA 1961–1990". National Oceanic and Atmospheric Administration. Retrieved 2014-03-11.
- "Boston, Massachusetts, USA - Monthly weather forecast and Climate data". Weather Atlas. Retrieved 4 July 2019.
- ThreadEx
- "Providence, Rhode Island, USA - Monthly weather forecast and Climate data". Weather Atlas. Retrieved 4 July 2019.
Further reading
| Wikivoyage has a travel guide for Greater Boston. |
- Wilson, Susan (2005). The Literary Trail of Greater Boston: A Tour of Sites in Boston, Cambridge, and Concord, Revised Edition. Commonwealth Editions. ISBN 1-889833-67-3. An informative guidebook, with facts and data about literary figures, publishers, bookstores, libraries, and other historic sites on the newly designated Literary Trail of Greater Boston.
- Warner, Sam, Jr. (2001). Greater Boston: Adapting Regional Traditions to the Present. University of Pennsylvania Press. ISBN 0-8122-1769-1.
Providence (capital) | ||
| Topics |
| |
| Society |
| |
| Regions | ||
| Cities | ||
| Towns |
| |