List of metropolitan statistical areas
The United States Office of Management and Budget (OMB) has defined 392 metropolitan statistical areas (MSAs) for the United States, including eight for Puerto Rico.[1] The OMB defines a Metropolitan Statistical Area as one or more adjacent counties, or county equivalents, that have at least one urban core area of at least 50,000 population, plus adjacent territory that has a high degree of social and economic integration with the core as measured by the commuting tie.
United States
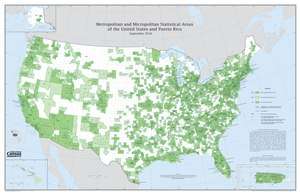
An enlargeable map of the 938 core-based statistical areas (CBSAs) of the United States and Puerto Rico. The 392 MSAs are shown in medium green . The 546 micropolitan statistical areas (μSAs) are shown in light green .
The following sortable table lists the 384 MSAs of the United States with the following information:
- The MSA rank by population as of July 1, 2019, as estimated by the United States Census Bureau[2]
- The MSA name as designated by the United States Office of Management and Budget[1]
- The MSA population as of July 1, 2019, as estimated by the United States Census Bureau[2]
- The MSA population as of April 1, 2010, as enumerated by the 2010 United States Census[2]
- The percent MSA population change from April 1, 2010, to July 1, 2019[2]
- The combined statistical area (CSA)[3] if the MSA is a component[1]
| Rank | Metropolitan statistical area | 2019 estimate | 2010 Census | % change | Encompassing combined statistical area |
|---|---|---|---|---|---|
| 1 | New York-Newark-Jersey City, NY-NJ-PA MSA | 19,216,182 | 18,897,109 | +1.69% | New York-Newark, NY-NJ-CT-PA CSA |
| 2 | Los Angeles-Long Beach-Anaheim, CA MSA | 13,214,799 | 12,828,837 | +3.01% | Los Angeles-Long Beach, CA CSA |
| 3 | Chicago-Naperville-Elgin, IL-IN-WI MSA | 9,458,539 | 9,461,105 | −0.03% | Chicago-Naperville, IL-IN-WI CSA |
| 4 | Dallas-Fort Worth-Arlington, TX MSA | 7,573,136 | 6,366,542 | +18.95% | Dallas-Fort Worth, TX-OK CSA |
| 5 | Houston-The Woodlands-Sugar Land, TX MSA | 7,066,141 | 5,920,416 | +19.35% | Houston-The Woodlands, TX CSA |
| 6 | Washington-Arlington-Alexandria, DC-VA-MD-WV MSA | 6,280,487 | 5,649,540 | +11.17% | Washington-Baltimore-Arlington, DC-MD-VA-WV-PA CSA |
| 7 | Miami-Fort Lauderdale-Pompano Beach, FL MSA | 6,166,488 | 5,564,635 | +10.82% | Miami-Port St. Lucie-Fort Lauderdale, FL CSA |
| 8 | Philadelphia-Camden-Wilmington, PA-NJ-DE-MD MSA | 6,102,434 | 5,965,343 | +2.30% | Philadelphia-Reading-Camden, PA-NJ-DE-MD CSA |
| 9 | Atlanta-Sandy Springs-Alpharetta, GA MSA | 6,020,364 | 5,286,728 | +13.88% | Atlanta–Athens-Clarke County–Sandy Springs, GA-AL CSA |
| 10 | Phoenix-Mesa-Chandler, AZ MSA | 4,948,203 | 4,192,887 | +18.01% | Phoenix-Mesa, AZ CSA |
| 11 | Boston-Cambridge-Newton, MA-NH MSA | 4,873,019 | 4,552,402 | +7.04% | Boston-Worcester-Providence, MA-RI-NH-CT CSA |
| 12 | San Francisco-Oakland-Berkeley, CA MSA | 4,731,803 | 4,335,391 | +9.14% | San Jose-San Francisco-Oakland, CA CSA |
| 13 | Riverside-San Bernardino-Ontario, CA MSA | 4,650,631 | 4,224,851 | +10.08% | Los Angeles-Long Beach, CA CSA |
| 14 | Detroit-Warren-Dearborn, MI MSA | 4,319,629 | 4,296,250 | +0.54% | Detroit-Warren-Ann Arbor, MI CSA |
| 15 | Seattle-Tacoma-Bellevue, WA MSA | 3,979,845 | 3,439,809 | +15.70% | Seattle-Tacoma, WA CSA |
| 16 | Minneapolis-St. Paul-Bloomington, MN-WI MSA | 3,640,043 | 3,333,633 | +9.19% | Minneapolis-St. Paul, MN-WI CSA |
| 17 | San Diego-Chula Vista-Carlsbad, CA MSA | 3,338,330 | 3,095,313 | +7.85% | |
| 18 | Tampa-St. Petersburg-Clearwater, FL MSA | 3,194,831 | 2,783,243 | +14.79% | |
| 19 | Denver-Aurora-Lakewood, CO MSA | 2,967,239 | 2,543,482 | +16.66% | Denver-Aurora, CO CSA |
| 20 | St. Louis, MO-IL MSA | 2,803,228 | 2,787,701 | +0.56% | St. Louis-St. Charles-Farmington, MO-IL CSA |
| 21 | Baltimore-Columbia-Towson, MD MSA | 2,800,053 | 2,710,489 | +3.30% | Washington-Baltimore-Arlington, DC-MD-VA-WV-PA CSA |
| 22 | Charlotte-Concord-Gastonia, NC-SC MSA | 2,636,883 | 2,243,960 | +17.51% | Charlotte-Concord, NC-SC CSA |
| 23 | Orlando-Kissimmee-Sanford, FL MSA | 2,608,147 | 2,134,411 | +22.20% | Orlando-Lakeland-Deltona, FL CSA |
| 24 | San Antonio-New Braunfels, TX MSA | 2,550,960 | 2,142,508 | +19.06% | San Antonio-New Braunfels-Pearsall, TX CSA |
| 25 | Portland-Vancouver-Hillsboro, OR-WA MSA | 2,492,412 | 2,226,009 | +11.97% | Portland-Vancouver-Salem, OR-WA CSA |
| 26 | Sacramento-Roseville-Folsom, CA MSA | 2,363,730 | 2,149,127 | +9.99% | Sacramento-Roseville, CA CSA |
| 27 | Pittsburgh, PA MSA | 2,317,600 | 2,356,285 | −1.64% | Pittsburgh-New Castle-Weirton, PA-OH-WV CSA |
| 28 | Las Vegas-Henderson-Paradise, NV MSA | 2,266,715 | 1,951,269 | +16.17% | Las Vegas-Henderson, NV-AZ CSA |
| 29 | Austin-Round Rock-Georgetown, TX MSA | 2,227,083 | 1,716,289 | +29.76% | |
| 30 | Cincinnati, OH-KY-IN MSA | 2,221,208 | 2,137,667 | +3.91% | Cincinnati-Wilmington-Maysville, OH-KY-IN CSA |
| 31 | Kansas City, MO-KS MSA | 2,157,990 | 2,009,342 | +7.40% | Kansas City-Overland Park-Kansas City, MO-KS CSA |
| 32 | Columbus, OH MSA | 2,122,271 | 1,901,974 | +11.58% | Columbus-Marion-Zanesville, OH CSA |
| 33 | Indianapolis-Carmel-Anderson, IN MSA | 2,074,537 | 1,887,877 | +9.89% | Indianapolis-Carmel-Muncie, IN CSA |
| 34 | Cleveland-Elyria, OH MSA | 2,048,449 | 2,077,240 | −1.39% | Cleveland-Akron-Canton, OH CSA |
| 35 | San Jose-Sunnyvale-Santa Clara, CA MSA | 1,990,660 | 1,836,911 | +8.37% | San Jose-San Francisco-Oakland, CA CSA |
| 36 | Nashville-Davidson–Murfreesboro–Franklin, TN MSA | 1,934,317 | 1,646,200 | +17.50% | Nashville-Davidson–Murfreesboro, TN CSA |
| 37 | Virginia Beach-Norfolk-Newport News, VA-NC MSA | 1,768,901 | 1,713,954 | +3.21% | Virginia Beach-Norfolk, VA-NC CSA |
| 38 | Providence-Warwick, RI-MA MSA | 1,624,578 | 1,600,852 | +1.48% | Boston-Worcester-Providence, MA-RI-NH-CT CSA |
| 39 | Milwaukee-Waukesha, WI MSA | 1,575,179 | 1,555,908 | +1.24% | Milwaukee-Racine-Waukesha, WI CSA |
| 40 | Jacksonville, FL MSA | 1,559,514 | 1,345,596 | +15.90% | Jacksonville-St. Marys-Palatka, FL-GA CSA |
| 41 | Oklahoma City, OK MSA | 1,408,950 | 1,252,987 | +12.45% | Oklahoma City-Shawnee, OK CSA |
| 42 | Raleigh-Cary, NC MSA | 1,390,785 | 1,130,490 | +23.02% | Raleigh-Durham-Cary, NC CSA |
| 43 | Memphis, TN-MS-AR MSA | 1,346,045 | 1,316,100 | +2.28% | Memphis-Forrest City, TN-MS-AR CSA |
| 44 | Richmond, VA MSA | 1,291,900 | 1,186,501 | +8.88% | |
| 45 | New Orleans-Metairie, LA MSA | 1,270,530 | 1,189,866 | +6.78% | New Orleans-Metairie-Hammond, LA-MS CSA |
| 46 | Louisville/Jefferson County, KY-IN MSA | 1,265,108 | 1,202,718 | +5.19% | Louisville/Jefferson County–Elizabethtown–Bardstown, KY-IN CSA |
| 47 | Salt Lake City, UT MSA | 1,232,696 | 1,087,873 | +13.31% | Salt Lake City-Provo-Orem, UT CSA |
| 48 | Hartford-East Hartford-Middletown, CT MSA | 1,204,877 | 1,212,381 | −0.62% | Hartford-East Hartford, CT CSA |
| 49 | Buffalo-Cheektowaga, NY MSA | 1,127,983 | 1,135,509 | −0.66% | Buffalo-Cheektowaga-Olean, NY CSA |
| 50 | Birmingham-Hoover, AL MSA | 1,090,435 | 1,061,024 | +2.77% | Birmingham-Hoover-Talladega, AL CSA |
| 51 | Grand Rapids-Kentwood, MI MSA | 1,077,370 | 993,670 | +8.42% | Grand Rapids-Kentwood-Muskegon, MI CSA |
| 52 | Rochester, NY MSA | 1,069,644 | 1,079,671 | −0.93% | Rochester-Batavia-Seneca Falls, NY CSA |
| 53 | Tucson, AZ MSA | 1,047,279 | 980,263 | +6.84% | Tucson-Nogales, AZ CSA |
| 54 | Fresno, CA MSA | 999,101 | 930,450 | +7.38% | Fresno-Madera-Hanford, CA CSA |
| 55 | Tulsa, OK MSA | 998,626 | 937,478 | +6.52% | Tulsa-Muskogee-Bartlesville, OK CSA |
| 56 | Urban Honolulu, HI MSA | 974,563 | 953,207 | +2.24% | |
| 57 | Omaha-Council Bluffs, NE-IA MSA | 949,442 | 865,350 | +9.72% | Omaha-Council Bluffs-Fremont, NE-IA CSA |
| 58 | Worcester, MA-CT MSA | 947,404 | 916,980 | +3.32% | Boston-Worcester-Providence, MA-RI-NH-CT CSA |
| 59 | Bridgeport-Stamford-Norwalk, CT MSA | 943,332 | 916,829 | +2.89% | New York-Newark, NY-NJ-CT-PA CSA |
| 60 | Greenville-Anderson, SC MSA | 920,477 | 824,112 | +11.69% | Greenville-Spartanburg-Anderson, SC CSA |
| 61 | Albuquerque, NM MSA | 918,018 | 887,077 | +3.49% | Albuquerque-Santa Fe-Las Vegas, NM CSA |
| 62 | Bakersfield, CA MSA | 900,202 | 839,631 | +7.21% | |
| 63 | Albany-Schenectady-Troy, NY MSA | 880,381 | 870,716 | +1.11% | Albany-Schenectady, NY CSA |
| 64 | Knoxville, TN MSA | 869,046 | 814,914 | +6.64% | Knoxville-Morristown-Sevierville, TN CSA |
| 65 | McAllen-Edinburg-Mission, TX MSA | 868,707 | 774,769 | +12.12% | McAllen-Edinburg, TX CSA |
| 66 | Baton Rouge, LA MSA | 854,884 | 825,905 | +3.51% | |
| 67 | New Haven-Milford, CT MSA | 854,757 | 862,477 | −0.90% | New York-Newark, NY-NJ-CT-PA CSA |
| 68 | Oxnard-Thousand Oaks-Ventura, CA MSA | 846,006 | 823,318 | +2.76% | Los Angeles-Long Beach, CA CSA |
| 69 | El Paso, TX MSA | 844,124 | 804,123 | +4.97% | El Paso-Las Cruces, TX-NM CSA |
| 70 | Allentown-Bethlehem-Easton, PA-NJ MSA | 844,052 | 821,173 | +2.79% | |
| 71 | Columbia, SC MSA | 838,433 | 767,598 | +9.23% | Columbia-Orangeburg-Newberry, SC CSA |
| 72 | North Port-Sarasota-Bradenton, FL MSA | 836,995 | 702,281 | +19.18% | North Port-Sarasota, FL CSA |
| 73 | Dayton-Kettering, OH MSA | 807,611 | 799,232 | +1.05% | Dayton-Springfield-Kettering, OH CSA |
| 74 | Charleston-North Charleston, SC MSA | 802,122 | 664,607 | +20.69% | |
| 75 | Greensboro-High Point, NC MSA | 771,851 | 723,801 | +6.64% | Greensboro–Winston-Salem–High Point, NC CSA |
| 76 | Cape Coral-Fort Myers, FL MSA | 770,577 | 618,754 | +24.54% | Cape Coral-Fort Myers-Naples, FL CSA |
| 77 | Stockton, CA MSA | 762,148 | 685,306 | +11.21% | San Jose-San Francisco-Oakland, CA CSA |
| 78 | Boise City, ID MSA | 749,202 | 616,561 | +21.51% | Boise City-Mountain Home-Ontario, ID-OR CSA |
| 79 | Colorado Springs, CO MSA | 745,791 | 645,613 | +15.52% | |
| 80 | Little Rock-North Little Rock-Conway, AR MSA | 742,384 | 699,757 | +6.09% | Little Rock-North Little Rock, AR CSA |
| 81 | Lakeland-Winter Haven, FL MSA | 724,777 | 602,095 | +20.38% | Orlando-Lakeland-Deltona, FL CSA |
| 82 | Akron, OH MSA | 703,479 | 703,200 | +0.04% | Cleveland-Akron-Canton, OH CSA |
| 83 | Des Moines-West Des Moines, IA MSA | 699,292 | 606,475 | +15.30% | Des Moines-Ames-West Des Moines, IA CSA |
| 84 | Springfield, MA MSA | 697,382 | 692,942 | +0.64% | |
| 85 | Ogden-Clearfield, UT MSA | 683,864 | 597,159 | +14.52% | Salt Lake City-Provo-Orem, UT CSA |
| 86 | Poughkeepsie-Newburgh-Middletown, NY MSA | 679,158 | 670,301 | +1.32% | New York-Newark, NY-NJ-CT-PA CSA |
| 87 | Winston-Salem, NC MSA | 676,008 | 640,595 | +5.53% | Greensboro–Winston-Salem–High Point, NC CSA |
| 88 | Deltona-Daytona Beach-Ormond Beach, FL MSA | 668,365 | 590,289 | +13.23% | Orlando-Lakeland-Deltona, FL CSA |
| 89 | Madison, WI MSA | 664,865 | 605,435 | +9.82% | Madison-Janesville-Beloit, WI CSA |
| 90 | Syracuse, NY MSA | 648,593 | 662,577 | −2.11% | Syracuse-Auburn, NY CSA |
| 91 | Provo-Orem, UT MSA | 648,252 | 526,810 | +23.05% | Salt Lake City-Provo-Orem, UT CSA |
| 92 | Durham-Chapel Hill, NC MSA | 644,367 | 564,273 | +14.19% | Raleigh-Durham-Cary, NC CSA |
| 93 | Toledo, OH MSA | 641,816 | 651,429 | −1.48% | Toledo-Findlay-Tiffin, OH CSA |
| 94 | Wichita, KS MSA | 640,218 | 623,061 | +2.75% | Wichita-Winfield, KS CSA |
| 95 | Augusta-Richmond County, GA-SC MSA | 608,980 | 564,873 | +7.81% | |
| 96 | Palm Bay-Melbourne-Titusville, FL MSA | 601,942 | 543,376 | +10.78% | Orlando-Deltona-Daytona Beach, FL CSA |
| 97 | Jackson, MS MSA | 594,806 | 586,320 | +1.45% | Jackson-Vicksburg-Brookhaven, MS CSA |
| 98 | Harrisburg-Carlisle, PA MSA | 577,941 | 549,475 | +5.18% | Harrisburg-York-Lebanon, PA CSA |
| 99 | Spokane-Spokane Valley, WA MSA | 568,521 | 514,752 | +10.45% | Spokane-Spokane Valley-Coeur d'Alene, WA-ID CSA |
| 100 | Chattanooga, TN-GA MSA | 565,194 | 528,143 | +7.02% | Chattanooga-Cleveland-Dalton, TN-GA-AL CSA |
| 101 | Scranton–Wilkes-Barre, PA MSA | 553,885 | 563,631 | −1.73% | |
| 102 | Modesto, CA MSA | 550,660 | 514,453 | +7.04% | San Jose-San Francisco-Oakland, CA CSA |
| 103 | Lansing-East Lansing, MI MSA | 550,391 | 534,684 | +2.94% | |
| 104 | Lancaster, PA MSA | 545,724 | 519,445 | +5.06% | |
| 105 | Portland-South Portland, ME MSA | 538,500 | 514,098 | +4.75% | Portland-Lewiston-South Portland, ME CSA |
| 106 | Youngstown-Warren-Boardman, OH-PA MSA | 536,081 | 565,773 | −5.25% | Youngstown-Warren, OH-PA CSA |
| 107 | Fayetteville-Springdale-Rogers, AR MSA | 534,904 | 440,121 | +21.54% | |
| 108 | Fayetteville, NC MSA | 526,719 | 481,061 | +9.49% | Fayetteville-Lumberton-Laurinburg, NC CSA |
| 109 | Lexington-Fayette, KY MSA | 517,056 | 472,099 | +9.52% | Lexington-Fayette–Richmond–Frankfort, KY CSA |
| 110 | Pensacola-Ferry Pass-Brent, FL MSA | 502,629 | 448,991 | +11.95% | Pensacola-Ferry Pass, FL-AL CSA |
| 111 | Myrtle Beach-Conway-North Myrtle Beach, SC-NC MSA | 496,901 | 376,722 | +31.90% | Myrtle Beach-Conway, SC-NC CSA |
| 112 | Santa Rosa-Petaluma, CA MSA | 494,336 | 483,878 | +2.16% | San Jose-San Francisco-Oakland, CA CSA |
| 113 | Port St. Lucie, FL MSA | 489,297 | 424,107 | +15.37% | Miami-Port St. Lucie-Fort Lauderdale, FL CSA |
| 114 | Lafayette, LA MSA | 489,207 | 466,750 | +4.81% | Lafayette-Opelousas-Morgan City, LA CSA |
| 115 | Reno, NV MSA | 475,642 | 425,417 | +11.81% | Reno-Carson City-Fernley, NV CSA |
| 116 | Huntsville, AL MSA | 471,824 | 417,593 | +12.99% | Huntsville-Decatur, AL CSA |
| 117 | Springfield, MO MSA | 470,300 | 436,712 | +7.69% | |
| 118 | Visalia, CA MSA | 466,195 | 442,179 | +5.43% | |
| 119 | Asheville, NC MSA | 462,680 | 424,858 | +8.90% | Asheville-Marion-Brevard, NC CSA |
| 120 | Killeen-Temple, TX MSA | 460,303 | 405,300 | +13.57% | |
| 121 | York-Hanover, PA MSA | 449,058 | 434,972 | +3.24% | Harrisburg-York-Lebanon, PA CSA |
| 122 | Vallejo, CA MSA | 447,643 | 413,344 | +8.30% | San Jose-San Francisco-Oakland, CA CSA |
| 123 | Santa Maria-Santa Barbara, CA MSA | 446,499 | 423,895 | +5.33% | |
| 124 | Salinas, CA MSA | 434,061 | 415,057 | +4.58% | |
| 125 | Salem, OR MSA | 433,903 | 390,738 | +11.05% | Portland-Vancouver-Salem, OR-WA CSA |
| 126 | Mobile, AL MSA | 429,536 | 430,573 | −0.24% | Mobile-Daphne-Fairhope, AL CSA |
| 127 | Corpus Christi, TX MSA | 429,024 | 405,027 | +5.92% | Corpus Christi-Kingsville-Alice, TX CSA |
| 128 | Brownsville-Harlingen, TX MSA | 423,163 | 406,220 | +4.17% | Brownsville-Harlingen-Raymondville, TX CSA |
| 129 | Reading, PA MSA | 421,164 | 411,442 | +2.36% | Philadelphia-Reading-Camden, PA-NJ-DE-MD CSA |
| 130 | Gulfport-Biloxi, MS MSA | 417,665 | 388,488 | +7.51% | |
| 131 | Manchester-Nashua, NH MSA | 417,025 | 400,721 | +4.07% | Boston-Worcester-Providence, MA-RI-NH-CT CSA |
| 132 | Salisbury, MD-DE MSA | 415,726 | 373,802 | +11.22% | Salisbury-Cambridge, MD-DE CSA |
| 133 | Fort Wayne, IN MSA | 413,263 | 388,621 | +6.34% | Fort Wayne-Huntington-Auburn, IN CSA |
| 134 | Flint, MI MSA | 405,813 | 425,790 | −4.69% | Detroit-Warren-Ann Arbor, MI CSA |
| 135 | Peoria, IL MSA | 400,561 | 416,255 | −3.77% | |
| 136 | Canton-Massillon, OH MSA | 397,520 | 404,422 | −1.71% | Cleveland-Akron-Canton, OH CSA |
| 137 | Anchorage, AK MSA | 396,317 | 380,821 | +4.07% | |
| 138 | Shreveport-Bossier City, LA MSA | 394,706 | 398,604 | −0.98% | Shreveport-Bossier City-Minden, LA CSA |
| 139 | Savannah, GA MSA | 393,353 | 347,611 | +13.16% | Savannah-Hinesville-Statesboro, GA CSA |
| 140 | Beaumont-Port Arthur, TX MSA | 392,563 | 388,745 | +0.98% | |
| 141 | Tallahassee, FL MSA | 387,227 | 367,413 | +5.39% | |
| 142 | Naples-Marco Island, FL MSA | 384,902 | 321,520 | +19.71% | Cape Coral-Fort Myers-Naples, FL CSA |
| 143 | Eugene-Springfield, OR MSA | 382,067 | 351,715 | +8.63% | |
| 144 | Davenport-Moline-Rock Island, IA-IL MSA | 379,172 | 379,690 | −0.14% | Davenport-Moline, IA-IL CSA |
| 145 | Montgomery, AL MSA | 373,290 | 374,536 | −0.33% | Montgomery-Selma-Alexander City, AL CSA |
| 146 | Hickory-Lenoir-Morganton, NC MSA | 369,711 | 365,497 | +1.15% | |
| 147 | Ann Arbor, MI MSA | 367,601 | 344,791 | +6.62% | Detroit-Warren-Ann Arbor, MI CSA |
| 148 | Trenton-Princeton, NJ MSA | 367,430 | 366,513 | +0.25% | New York-Newark, NY-NJ-CT-PA CSA |
| 149 | Ocala, FL MSA | 365,579 | 331,298 | +10.35% | |
| 150 | Fort Collins, CO MSA | 356,899 | 299,630 | +19.11% | |
| 151 | Huntington-Ashland, WV-KY-OH MSA | 355,873 | 370,908 | −4.05% | Charleston-Huntington-Ashland, WV-OH-KY CSA |
| 152 | Lincoln, NE MSA | 336,374 | 302,157 | +11.32% | Lincoln-Beatrice, NE CSA |
| 153 | Rockford, IL MSA | 336,116 | 349,431 | −3.81% | Rockford-Freeport-Rochelle, IL CSA |
| 154 | Gainesville, FL MSA | 329,128 | 305,076 | +7.88% | Gainesville-Lake City, FL CSA |
| 155 | Boulder, CO MSA | 326,196 | 294,567 | +10.74% | Denver-Aurora, CO CSA |
| 156 | Greeley, CO MSA | 324,492 | 252,825 | +28.35% | Denver-Aurora, CO CSA |
| 157 | South Bend-Mishawaka, IN-MI MSA | 323,613 | 319,224 | +1.37% | South Bend-Elkhart-Mishawaka, IN-MI CSA |
| 158 | Green Bay, WI MSA | 322,906 | 306,241 | +5.44% | Green Bay-Shawano, WI CSA |
| 159 | Lubbock, TX MSA | 322,257 | 290,805 | +10.82% | Lubbock-Plainview-Levelland, TX CSA |
| 160 | Columbus, GA-AL MSA | 321,048 | 307,788 | +4.31% | Columbus-Auburn-Opelika, GA-AL CSA |
| 161 | Spartanburg, SC MSA | 319,785 | 284,307 | +12.48% | Greenville-Spartanburg-Anderson, SC CSA |
| 162 | Evansville, IN-KY MSA | 315,086 | 311,552 | +1.13% | |
| 163 | Roanoke, VA MSA | 313,222 | 308,707 | +1.46% | |
| 164 | Clarksville, TN-KY MSA | 307,820 | 273,949 | +12.36% | |
| 165 | Kingsport-Bristol, TN-VA MSA | 307,202 | 309,544 | −0.76% | Johnson City-Kingsport-Bristol, TN-VA CSA |
| 166 | Kennewick-Richland, WA MSA | 299,612 | 253,340 | +18.26% | Kennewick-Richland-Walla Walla, WA CSA |
| 167 | Wilmington, NC MSA | 297,533 | 254,884 | +16.73% | |
| 168 | Olympia-Lacey-Tumwater, WA MSA | 290,536 | 252,264 | +15.17% | Seattle-Tacoma, WA CSA |
| 169 | Utica-Rome, NY MSA | 289,990 | 299,397 | −3.14% | |
| 170 | Duluth, MN-WI MSA | 288,732 | 290,637 | −0.66% | |
| 171 | Hagerstown-Martinsburg, MD-WV MSA | 288,104 | 269,140 | +7.05% | Washington-Baltimore-Arlington, DC-MD-VA-WV-PA CSA |
| 172 | Longview, TX MSA | 286,657 | 280,000 | +2.38% | |
| 173 | Crestview-Fort Walton Beach-Destin, FL MSA | 284,809 | 235,865 | +20.75% | |
| 174 | San Luis Obispo-Paso Robles, CA MSA | 283,111 | 269,637 | +5.00% | |
| 175 | Merced, CA MSA | 277,680 | 255,793 | +8.56% | San Jose-San Francisco-Oakland, CA CSA |
| 176 | Laredo, TX MSA | 276,652 | 250,304 | +10.53% | |
| 177 | Waco, TX MSA | 273,920 | 252,772 | +8.37% | |
| 178 | Santa Cruz-Watsonville, CA MSA | 273,213 | 262,382 | +4.13% | San Jose-San Francisco-Oakland, CA CSA |
| 179 | Cedar Rapids, IA MSA | 273,032 | 257,940 | +5.85% | Cedar Rapids-Iowa City, IA CSA |
| 180 | Bremerton-Silverdale-Port Orchard, WA MSA | 271,473 | 251,133 | +8.10% | Seattle-Tacoma, WA CSA |
| 181 | Erie, PA MSA | 269,728 | 280,566 | −3.86% | Erie-Meadville, PA CSA |
| 182 | Sioux Falls, SD MSA | 268,232 | 228,261 | +17.51% | |
| 183 | Norwich-New London, CT MSA | 265,206 | 274,055 | −3.23% | Hartford-East Hartford, CT CSA |
| 184 | Kalamazoo-Portage, MI MSA | 265,066 | 250,331 | +5.89% | Kalamazoo-Battle Creek-Portage, MI CSA |
| 185 | Amarillo, TX MSA | 265,053 | 251,933 | +5.21% | Amarillo-Pampa-Borger, TX CSA |
| 186 | College Station-Bryan, TX MSA | 264,728 | 228,660 | +15.77% | |
| 187 | Atlantic City-Hammonton, NJ MSA | 263,670 | 274,549 | −3.96% | Philadelphia-Reading-Camden, PA-NJ-DE-MD CSA |
| 188 | Lynchburg, VA MSA | 263,566 | 252,634 | +4.33% | |
| 189 | Charleston, WV MSA | 257,074 | 278,009 | −7.53% | Charleston-Huntington-Ashland, WV-OH-KY CSA |
| 190 | Tuscaloosa, AL MSA | 252,047 | 239,207 | +5.37% | |
| 191 | Yakima, WA MSA | 250,873 | 243,231 | +3.14% | |
| 192 | Fort Smith, AR-OK MSA | 250,368 | 248,208 | +0.87% | |
| 193 | Fargo, ND-MN MSA | 246,145 | 208,777 | +17.90% | Fargo-Wahpeton, ND-MN CSA |
| 194 | Binghamton, NY MSA | 238,691 | 251,725 | −5.18% | |
| 195 | Appleton, WI MSA | 237,974 | 225,666 | +5.45% | Appleton-Oshkosh-Neenah, WI CSA |
| 196 | Prescott Valley-Prescott, AZ MSA | 235,099 | 211,033 | +11.40% | |
| 197 | Lafayette-West Lafayette, IN MSA | 233,002 | 210,297 | +10.80% | Lafayette-West Lafayette-Frankfort, IN CSA |
| 198 | Tyler, TX MSA | 232,751 | 209,714 | +10.98% | Tyler-Jacksonville, TX CSA |
| 199 | Topeka, KS MSA | 231,969 | 233,870 | −0.81% | |
| 200 | Macon-Bibb County, GA MSA | 229,996 | 232,293 | −0.99% | Macon-Bibb County–Warner Robins, GA CSA |
| 201 | Bellingham, WA MSA | 229,247 | 201,140 | +13.97% | |
| 202 | Champaign-Urbana, IL MSA | 226,033 | 217,810 | +3.78% | |
| 203 | Daphne-Fairhope-Foley, AL MSA | 223,234 | 182,265 | +22.48% | Mobile-Daphne-Fairhope, AL CSA |
| 204 | Hilton Head Island-Bluffton, SC MSA | 222,195 | 187,010 | +18.81% | |
| 205 | Rochester, MN MSA | 221,921 | 206,877 | +7.27% | Rochester-Austin, MN CSA |
| 206 | Medford, OR MSA | 220,944 | 203,206 | +8.73% | Medford-Grants Pass, OR CSA |
| 207 | Burlington-South Burlington, VT MSA | 220,411 | 211,261 | +4.33% | Burlington-South Burlington-Barre, VT CSA |
| 208 | Chico, CA MSA | 219,186 | 220,000 | −0.37% | |
| 209 | Charlottesville, VA MSA | 218,615 | 201,559 | +8.46% | |
| 210 | Las Cruces, NM MSA | 218,195 | 209,233 | +4.28% | El Paso-Las Cruces, TX-NM CSA |
| 211 | Yuma, AZ MSA | 213,787 | 195,751 | +9.21% | |
| 212 | Athens-Clarke County, GA MSA | 213,750 | 192,541 | +11.02% | Atlanta–Athens-Clarke County–Sandy Springs, GA-AL CSA |
| 213 | Barnstable Town, MA MSA | 212,990 | 215,888 | −1.34% | Boston-Worcester-Providence, MA-RI-NH-CT CSA |
| 214 | Lake Havasu City-Kingman, AZ MSA | 212,181 | 200,186 | +5.99% | Las Vegas-Henderson, NV-AZ CSA |
| 215 | Lake Charles, LA MSA | 210,409 | 199,607 | +5.41% | Lake Charles-Jennings, LA CSA |
| 216 | Columbia, MO MSA | 208,173 | 190,387 | +9.34% | Columbia-Moberly-Mexico, MO CSA |
| 217 | Houma-Thibodaux, LA MSA | 208,075 | 208,178 | −0.05% | |
| 218 | Springfield, IL MSA | 206,868 | 210,170 | −1.57% | Springfield-Jacksonville-Lincoln, IL CSA |
| 219 | Elkhart-Goshen, IN MSA | 206,341 | 197,559 | +4.45% | South Bend-Elkhart-Mishawaka, IN-MI CSA |
| 220 | Florence, SC MSA | 204,911 | 205,566 | −0.32% | |
| 221 | Gainesville, GA MSA | 204,441 | 179,684 | +13.78% | Atlanta–Athens-Clarke County–Sandy Springs, GA-AL CSA |
| 222 | Johnson City, TN MSA | 203,649 | 198,716 | +2.48% | Johnson City-Kingsport-Bristol, TN-VA CSA |
| 223 | St. Cloud, MN MSA | 201,964 | 189,093 | +6.81% | Minneapolis-St. Paul, MN-WI CSA |
| 224 | Monroe, LA MSA | 200,261 | 204,420 | −2.03% | Monroe-Ruston, LA CSA |
| 225 | Jacksonville, NC MSA | 197,938 | 177,772 | +11.34% | |
| 226 | Bend, OR MSA | 197,692 | 157,733 | +25.33% | Bend-Prineville, OR CSA |
| 227 | Racine, WI MSA | 196,311 | 195,408 | +0.46% | Milwaukee-Racine-Waukesha, WI CSA |
| 228 | Saginaw, MI MSA | 190,539 | 200,169 | −4.81% | Saginaw-Midland-Bay City, MI CSA |
| 229 | Punta Gorda, FL MSA | 188,910 | 159,978 | +18.08% | North Port-Sarasota, FL CSA |
| 230 | Terre Haute, IN MSA | 186,367 | 189,764 | −1.79% | |
| 231 | Warner Robins, GA MSA | 185,409 | 167,595 | +10.63% | Macon-Bibb County–Warner Robins, GA CSA |
| 232 | Midland, TX MSA | 182,603 | 141,671 | +28.89% | Midland-Odessa, TX CSA |
| 233 | Billings, MT MSA | 181,667 | 167,167 | +8.67% | |
| 234 | El Centro, CA MSA | 181,215 | 174,528 | +3.83% | |
| 235 | Dover, DE MSA | 180,786 | 162,310 | +11.38% | Philadelphia-Reading-Camden, PA-NJ-DE-MD CSA |
| 236 | Greenville, NC MSA | 180,742 | 168,148 | +7.49% | Greenville-Kinston-Washington, NC CSA |
| 237 | Redding, CA MSA | 180,080 | 177,223 | +1.61% | Redding-Red Bluff, CA CSA |
| 238 | Joplin, MO MSA | 179,564 | 175,518 | +2.31% | Joplin-Miami, MO-OK CSA |
| 239 | Bowling Green, KY MSA | 179,240 | 158,599 | +13.01% | Bowling Green-Glasgow, KY CSA |
| 240 | Jackson, TN MSA | 178,644 | 179,694 | −0.58% | |
| 241 | Kingston, NY MSA | 177,573 | 182,493 | −2.70% | New York-Newark, NY-NJ-CT-PA CSA |
| 242 | St. George, UT MSA | 177,556 | 138,115 | +28.56% | |
| 243 | Yuba City, CA MSA | 175,639 | 166,892 | +5.24% | Sacramento-Roseville, CA CSA |
| 244 | Panama City, FL MSA | 174,705 | 168,852 | +3.47% | |
| 245 | Muskegon, MI MSA | 173,566 | 172,188 | +0.80% | Grand Rapids-Kentwood-Muskegon, MI CSA |
| 246 | Iowa City, IA MSA | 173,105 | 152,586 | +13.45% | Cedar Rapids-Iowa City, IA CSA |
| 247 | Abilene, TX MSA | 172,060 | 165,252 | +4.12% | |
| 248 | Oshkosh-Neenah, WI MSA | 171,907 | 166,994 | +2.94% | Appleton-Oshkosh-Neenah, WI CSA |
| 249 | Bloomington, IL MSA | 171,517 | 169,572 | +1.15% | Bloomington-Pontiac, IL CSA |
| 250 | East Stroudsburg, PA MSA | 170,271 | 169,842 | +0.25% | New York-Newark, NY-NJ-CT-PA CSA |
| 251 | Burlington, NC MSA | 169,509 | 151,131 | +12.16% | Greensboro–Winston-Salem–High Point, NC CSA |
| 252 | Eau Claire, WI MSA | 169,304 | 161,151 | +5.06% | Eau Claire-Menomonie, WI CSA |
| 253 | Bloomington, IN MSA | 169,230 | 159,549 | +6.07% | Bloomington-Bedford, IN CSA |
| 254 | Hattiesburg, MS MSA | 168,849 | 162,410 | +3.96% | Hattiesburg-Laurel, MS CSA |
| 255 | Waterloo-Cedar Falls, IA MSA | 168,522 | 167,819 | +0.42% | |
| 256 | Pueblo, CO MSA | 168,424 | 159,063 | +5.89% | Pueblo-Cañon City, CO CSA |
| 257 | Blacksburg-Christiansburg, VA MSA | 167,531 | 162,958 | +2.81% | |
| 258 | Kahului-Wailuku-Lahaina, HI MSA | 167,417 | 154,834 | +8.13% | |
| 259 | Odessa, TX MSA | 166,223 | 137,130 | +21.22% | Midland-Odessa, TX CSA |
| 260 | Coeur d'Alene, ID MSA | 165,697 | 138,494 | +19.64% | Spokane-Spokane Valley-Coeur d'Alene, WA-ID CSA |
| 261 | Auburn-Opelika, AL MSA | 164,542 | 140,247 | +17.32% | Columbus-Auburn-Opelika, GA-AL CSA |
| 262 | Janesville-Beloit, WI MSA | 163,354 | 160,331 | +1.89% | Madison-Janesville-Beloit, WI CSA |
| 263 | Wausau-Weston, WI MSA | 163,285 | 162,806 | +0.29% | Wausau-Stevens Point-Wisconsin Rapids, WI CSA |
| 264 | State College, PA MSA | 162,385 | 153,990 | +5.45% | State College-DuBois, PA CSA |
| 265 | Sebastian-Vero Beach, FL MSA | 159,923 | 138,028 | +15.86% | Miami-Port St. Lucie-Fort Lauderdale, FL CSA |
| 266 | Jackson, MI MSA | 158,510 | 160,248 | −1.08% | |
| 267 | Madera, CA MSA | 157,327 | 150,865 | +4.28% | Fresno-Madera-Hanford, CA CSA |
| 268 | Chambersburg-Waynesboro, PA MSA | 155,027 | 149,618 | +3.62% | Washington-Baltimore-Arlington, DC-MD-VA-WV-PA CSA |
| 269 | Grand Junction, CO MSA | 154,210 | 146,723 | +5.10% | |
| 270 | Elizabethtown-Fort Knox, KY MSA | 153,928 | 148,338 | +3.77% | Louisville/Jefferson County–Elizabethtown–Bardstown, KY-IN CSA |
| 271 | Niles, MI MSA | 153,401 | 156,813 | −2.18% | South Bend-Elkhart-Mishawaka, IN-MI CSA |
| 272 | Hanford-Corcoran, CA MSA | 152,940 | 152,982 | −0.03% | Fresno-Madera-Hanford, CA CSA |
| 273 | Decatur, AL MSA | 152,603 | 153,829 | −0.80% | Huntsville-Decatur, AL CSA |
| 274 | Bangor, ME MSA | 152,148 | 153,923 | −1.15% | |
| 275 | Alexandria, LA MSA | 152,037 | 153,922 | −1.22% | |
| 276 | Idaho Falls, ID MSA | 151,530 | 133,265 | +13.71% | Idaho Falls-Rexburg-Blackfoot, ID CSA |
| 277 | Wichita Falls, TX MSA | 151,254 | 151,306 | −0.03% | |
| 278 | Jefferson City, MO MSA | 151,235 | 149,807 | +0.95% | |
| 279 | Monroe, MI MSA | 150,500 | 152,021 | −1.00% | Detroit-Warren-Ann Arbor, MI CSA |
| 280 | Santa Fe, NM MSA | 150,358 | 144,170 | +4.29% | Albuquerque-Santa Fe-Las Vegas, NM CSA |
| 281 | Homosassa Springs, FL MSA | 149,657 | 141,236 | +5.96% | |
| 282 | Vineland-Bridgeton, NJ MSA | 149,527 | 156,898 | −4.70% | Philadelphia-Reading-Camden, PA-NJ-DE-MD CSA |
| 283 | Dothan, AL MSA | 149,358 | 145,639 | +2.55% | Dothan-Ozark, AL CSA |
| 284 | Texarkana, TX-AR MSA | 148,761 | 149,198 | −0.29% | |
| 285 | Florence-Muscle Shoals, AL MSA | 147,970 | 147,137 | +0.57% | |
| 286 | Valdosta, GA MSA | 147,292 | 139,588 | +5.52% | |
| 287 | Albany, GA MSA | 146,726 | 153,857 | −4.63% | |
| 288 | Rocky Mount, NC MSA | 145,770 | 152,392 | −4.35% | Rocky Mount-Wilson-Roanoke Rapids, NC CSA |
| 289 | Dalton, GA MSA | 144,724 | 142,227 | +1.76% | Chattanooga-Cleveland-Dalton, TN-GA-AL CSA |
| 290 | Sioux City, IA-NE-SD MSA | 144,701 | 143,577 | +0.78% | |
| 291 | Flagstaff, AZ MSA | 143,476 | 134,421 | +6.74% | |
| 292 | Morristown, TN MSA | 142,749 | 136,608 | +4.50% | Knoxville-Morristown-Sevierville, TN CSA |
| 293 | Logan, UT-ID MSA | 142,165 | 125,442 | +13.33% | |
| 294 | Rapid City, SD MSA | 142,107 | 126,382 | +12.44% | Rapid City-Spearfish, SD CSA |
| 295 | Lebanon, PA MSA | 141,793 | 133,568 | +6.16% | Harrisburg-York-Lebanon, PA CSA |
| 296 | Winchester, VA-WV MSA | 140,566 | 128,472 | +9.41% | Washington-Baltimore-Arlington, DC-MD-VA-WV-PA CSA |
| 297 | Sumter, SC MSA | 140,466 | 142,427 | −1.38% | |
| 298 | Morgantown, WV MSA | 139,044 | 129,709 | +7.20% | Morgantown-Fairmont, WV CSA |
| 299 | Wheeling, WV-OH MSA | 138,948 | 147,950 | −6.08% | |
| 300 | Napa, CA MSA | 137,744 | 136,484 | +0.92% | San Jose-San Francisco-Oakland, CA CSA |
| 301 | La Crosse-Onalaska, WI-MN MSA | 136,616 | 133,665 | +2.21% | |
| 302 | Sherman-Denison, TX MSA | 136,212 | 120,877 | +12.69% | Dallas-Fort Worth, TX-OK CSA |
| 303 | Carbondale-Marion, IL MSA | 135,764 | 139,157 | −2.44% | |
| 304 | Harrisonburg, VA MSA | 134,964 | 125,228 | +7.77% | Harrisonburg-Staunton-Waynesboro, VA CSA |
| 305 | Hammond, LA MSA | 134,758 | 121,097 | +11.28% | New Orleans-Metairie-Hammond, LA-MS CSA |
| 306 | Battle Creek, MI MSA | 134,159 | 136,146 | −1.46% | Kalamazoo-Battle Creek-Portage, MI CSA |
| 307 | Springfield, OH MSA | 134,083 | 138,333 | −3.07% | Dayton-Springfield-Kettering, OH CSA |
| 308 | Jonesboro, AR MSA | 133,860 | 121,026 | +10.60% | Jonesboro-Paragould, AR CSA |
| 309 | The Villages, FL MSA | 132,420 | 93,420 | +41.75% | Orlando-Lakeland-Deltona, FL CSA |
| 310 | Manhattan, KS MSA | 130,285 | 127,081 | +2.52% | |
| 311 | Johnstown, PA MSA | 130,192 | 143,679 | −9.39% | Johnstown-Somerset, PA CSA |
| 312 | Albany-Lebanon, OR MSA | 129,749 | 116,672 | +11.21% | Portland-Vancouver-Salem, OR-WA CSA |
| 313 | Mount Vernon-Anacortes, WA MSA | 129,205 | 116,901 | +10.53% | Seattle-Tacoma, WA CSA |
| 314 | Bismarck, ND MSA | 128,949 | 110,625 | +16.56% | |
| 315 | Lawton, OK MSA | 126,415 | 130,291 | −2.97% | |
| 316 | Sierra Vista-Douglas, AZ MSA | 125,922 | 131,346 | −4.13% | |
| 317 | St. Joseph, MO-KS MSA | 125,223 | 127,329 | −1.65% | Kansas City-Overland Park-Kansas City, MO-KS CSA |
| 318 | Glens Falls, NY MSA | 125,148 | 128,923 | −2.93% | Albany-Schenectady, NY CSA |
| 319 | Pittsfield, MA MSA | 124,944 | 131,219 | −4.78% | |
| 320 | Cleveland, TN MSA | 124,942 | 115,788 | +7.91% | Chattanooga-Cleveland-Dalton, TN-GA-AL CSA |
| 321 | New Bern, NC MSA | 124,284 | 126,802 | −1.99% | New Bern-Morehead City, NC CSA |
| 322 | Farmington, NM MSA | 123,958 | 130,044 | −4.68% | |
| 323 | Ames, IA MSA | 123,351 | 115,848 | +6.48% | Des Moines-Ames-West Des Moines, IA CSA |
| 324 | Goldsboro, NC MSA | 123,131 | 122,623 | +0.41% | |
| 325 | Staunton, VA MSA | 123,120 | 118,502 | +3.90% | Harrisonburg-Staunton-Waynesboro, VA CSA |
| 326 | Lawrence, KS MSA | 122,259 | 110,826 | +10.32% | Kansas City-Overland Park-Kansas City, MO-KS CSA |
| 327 | San Angelo, TX MSA | 122,027 | 112,966 | +8.02% | |
| 328 | Altoona, PA MSA | 121,829 | 127,089 | −4.14% | |
| 329 | Mansfield, OH MSA | 121,154 | 124,475 | −2.67% | Mansfield-Ashland-Bucyrus, OH CSA |
| 330 | Wenatchee, WA MSA | 120,629 | 110,884 | +8.79% | |
| 331 | Missoula, MT MSA | 119,600 | 109,299 | +9.42% | |
| 332 | Owensboro, KY MSA | 119,440 | 114,752 | +4.09% | |
| 333 | Brunswick, GA MSA | 118,779 | 112,370 | +5.70% | |
| 334 | Weirton-Steubenville, WV-OH MSA | 116,074 | 124,454 | −6.73% | Pittsburgh-New Castle-Weirton, PA-OH-WV CSA |
| 335 | Beckley, WV MSA | 115,767 | 124,898 | −7.31% | |
| 336 | Sheboygan, WI MSA | 115,340 | 115,507 | −0.14% | |
| 337 | Muncie, IN MSA | 114,135 | 117,671 | −3.00% | Indianapolis-Carmel-Muncie, IN CSA |
| 338 | Anniston-Oxford, AL MSA | 113,605 | 118,572 | −4.19% | |
| 339 | California-Lexington Park, MD MSA | 113,510 | 105,151 | +7.95% | Washington-Baltimore-Arlington, DC-MD-VA-WV-PA CSA |
| 340 | Williamsport, PA MSA | 113,299 | 116,111 | −2.42% | Williamsport-Lock Haven, PA CSA |
| 341 | Twin Falls, ID MSA | 111,290 | 99,604 | +11.73% | |
| 342 | Longview, WA MSA | 110,593 | 102,410 | +7.99% | Portland-Vancouver-Salem, OR-WA CSA |
| 343 | Michigan City-La Porte, IN MSA | 109,888 | 111,467 | −1.42% | Chicago-Naperville, IL-IN-WI CSA |
| 344 | Kankakee, IL MSA | 109,862 | 113,449 | −3.16% | Chicago-Naperville, IL-IN-WI CSA |
| 345 | Watertown-Fort Drum, NY MSA | 109,834 | 116,229 | −5.50% | |
| 346 | Lewiston-Auburn, ME MSA | 108,277 | 107,702 | +0.53% | Portland-Lewiston-South Portland, ME CSA |
| 347 | Sebring-Avon Park, FL MSA | 106,221 | 98,786 | +7.53% | |
| 348 | Decatur, IL MSA | 104,009 | 110,768 | −6.10% | |
| 349 | Fond du Lac, WI MSA | 103,403 | 101,633 | +1.74% | |
| 350 | Bay City, MI MSA | 103,126 | 107,771 | −4.31% | Saginaw-Midland-Bay City, MI CSA |
| 351 | Gettysburg, PA MSA | 103,009 | 101,407 | +1.58% | Harrisburg-York-Lebanon, PA CSA |
| 352 | Lima, OH MSA | 102,351 | 106,331 | −3.74% | Lima-Van Wert-Celina, OH CSA |
| 353 | Gadsden, AL MSA | 102,268 | 104,430 | −2.07% | |
| 354 | Ithaca, NY MSA | 102,180 | 101,564 | +0.61% | Ithaca-Cortland, NY CSA |
| 355 | Mankato, MN MSA | 101,927 | 96,740 | +5.36% | Mankato-New Ulm, MN CSA |
| 356 | Grand Forks, ND-MN MSA | 100,815 | 98,461 | +2.39% | |
| 357 | Victoria, TX MSA | 99,742 | 94,003 | +6.11% | Victoria-Port Lavaca, TX CSA |
| 358 | Cheyenne, WY MSA | 99,500 | 91,738 | +8.46% | |
| 359 | Hot Springs, AR MSA | 99,386 | 96,024 | +3.50% | Hot Springs-Malvern, AR CSA |
| 360 | Rome, GA MSA | 98,498 | 96,317 | +2.26% | Atlanta–Athens-Clarke County–Sandy Springs, GA-AL CSA |
| 361 | Dubuque, IA MSA | 97,311 | 93,653 | +3.91% | |
| 362 | Cumberland, MD-WV MSA | 97,284 | 103,299 | −5.82% | |
| 363 | Fairbanks, AK MSA | 96,849 | 97,581 | −0.75% | |
| 364 | Cape Girardeau, MO-IL MSA | 96,765 | 96,275 | +0.51% | Cape Girardeau-Sikeston, MO-IL CSA |
| 365 | Pocatello, ID MSA | 95,489 | 90,656 | +5.33% | |
| 366 | Corvallis, OR MSA | 93,053 | 85,579 | +8.73% | Portland-Vancouver-Salem, OR-WA CSA |
| 367 | Ocean City, NJ MSA | 92,039 | 97,265 | −5.37% | Philadelphia-Reading-Camden, PA-NJ-DE-MD CSA |
| 368 | Parkersburg-Vienna, WV MSA | 89,339 | 92,673 | −3.60% | Parkersburg-Marietta-Vienna, WV-OH CSA |
| 369 | Pine Bluff, AR MSA | 87,804 | 100,258 | −12.42% | Little Rock-North Little Rock, AR CSA |
| 370 | Grants Pass, OR MSA | 87,487 | 82,713 | +5.77% | Medford-Grants Pass, OR CSA |
| 371 | Columbus, IN MSA | 83,779 | 76,794 | +9.10% | Indianapolis-Carmel-Muncie, IN CSA |
| 372 | Elmira, NY MSA | 83,456 | 88,830 | −6.05% | Elmira-Corning, NY CSA |
| 373 | Bloomsburg-Berwick, PA MSA | 83,194 | 85,562 | −2.77% | Bloomsburg-Berwick-Sunbury, PA CSA |
| 374 | Midland, MI MSA | 83,156 | 83,629 | −0.57% | Saginaw-Midland-Bay City, MI CSA |
| 375 | Kokomo, IN MSA | 82,544 | 82,752 | −0.25% | Kokomo-Peru, IN CSA |
| 376 | Great Falls, MT MSA | 81,366 | 81,327 | +0.05% | |
| 377 | Hinesville, GA MSA | 80,994 | 77,917 | +3.95% | Savannah-Hinesville-Statesboro, GA CSA |
| 378 | Casper, WY MSA | 79,858 | 75,450 | +5.84% | |
| 379 | Danville, IL MSA | 75,758 | 81,625 | −7.19% | |
| 380 | Grand Island, NE MSA | 75,553 | 72,726 | +3.89% | |
| 381 | Lewiston, ID-WA MSA | 62,990 | 60,888 | +3.45% | |
| 382 | Enid, OK MSA | 61,056 | 60,580 | +0.79% | |
| 383 | Walla Walla, WA MSA | 60,760 | 58,781 | +3.37% | |
| 384 | Carson City, NV MSA | 55,916 | 55,274 | +1.16% | Reno-Carson City-Fernley, NV CSA |
Puerto Rico
The following sortable table lists the eight Metropolitan Statistical Areas (MSAs) of Puerto Rico with the following information:
- The MSA rank by population as of July 1, 2019, as estimated by the United States Census Bureau[2]
- The MSA name as designated by the United States Office of Management and Budget[1]
- The MSA population as of July 1, 2019, as estimated by the United States Census Bureau[2]
- The MSA population as of April 1, 2010, as enumerated by the 2010 United States Census[2]
- The percent MSA population change from April 1, 2010, to July 1, 2019[2]
- The Combined Statistical Area (CSA)[3] if the MSA is a component[1]
| Rank | Metropolitan Statistical Area | 2019 Estimate | 2010 Census | Change | Encompassing Combined Statistical Area |
|---|---|---|---|---|---|
| 1 | San Juan-Bayamón-Caguas, PR Metropolitan Statistical Area | 2,023,227 | 2,350,126 | −13.91% | San Juan-Bayamón, PR Combined Statistical Area |
| 2 | Aguadilla-Isabela, PR Metropolitan Statistical Area | 289,289 | 339,441 | −14.77% | |
| 3 | Ponce, PR Metropolitan Statistical Area | 215,295 | 262,630 | −18.02% | Ponce-Yauco-Coamo, PR Combined Statistical Area |
| 4 | Arecibo, PR Metropolitan Statistical Area | 174,606 | 199,471 | −12.47% | San Juan-Bayamón, PR Combined Statistical Area |
| 5 | San Germán, PR Metropolitan Statistical Area | 121,464 | 137,462 | −11.64% | Mayagüez-San Germán, PR Combined Statistical Area |
| 6 | Mayagüez, PR Metropolitan Statistical Area | 94,975 | 116,211 | −18.27% | Mayagüez-San Germán, PR Combined Statistical Area |
| 7 | Yauco, PR Metropolitan Statistical Area | 85,830 | 107,333 | −20.03% | Ponce-Yauco-Coamo, PR Combined Statistical Area |
| 8 | Guayama, PR Metropolitan Statistical Area | 72,914 | 84,214 | −13.42% | San Juan-Bayamón, PR Combined Statistical Area |
See also
- United States of America
- Outline of the United States
- Index of United States-related articles
- Book:United States
- Demographics of the United States
- United States Census Bureau
- List of U.S. states and territories by population
- List of metropolitan areas of the United States
- List of United States cities by population
- List of United States counties and county-equivalents
- United States Office of Management and Budget
- The OMB has defined 1098 statistical areas comprising 392 MSAs, 555 μSAs, and 169 CSAs
- Primary statistical area – List of the 574 PSAs
- Combined Statistical Area – List of the 169 CSAs
- Core Based Statistical Area – List of the 929 CBSAs
- Metropolitan Statistical Area – List of the 392 MSAs
- Micropolitan Statistical Area – List of the 550 μSAs
- Primary statistical area – List of the 574 PSAs
- The OMB has defined 1098 statistical areas comprising 392 MSAs, 555 μSAs, and 169 CSAs
- United States Census Bureau
References
- "OMB Bulletin No. 20-01: Revised Delineations of Metropolitan Statistical Areas, Micropolitan Statistical Areas, and Combined Statistical Areas, and Guidance on Uses of the Delineations of These Areas" (PDF). United States Office of Management and Budget. March 6, 2020. Retrieved April 24, 2020.
- "Metropolitan and Micropolitan Statistical Areas Population Totals and Components of Change: 2010-2019". United States Census Bureau, Population Division. April 2019. Retrieved April 18, 2020.
- The United States Office of Management and Budget (OMB) defines a CSA (CSA) as an aggregate of adjacent core-based statistical areas that are linked by commuting ties.
This article is issued from Wikipedia. The text is licensed under Creative Commons - Attribution - Sharealike. Additional terms may apply for the media files.