Rockingham County, New Hampshire
Rockingham County is a county in the U.S. state of New Hampshire. As of the 2010 census, the population was 295,223,[1] making it the second-most populous county in New Hampshire. The county seat is Brentwood.[2] Rockingham County constitutes a portion of the Boston-Cambridge-Newton, MA-NH Metropolitan Statistical Area as well as of the greater Boston-Worcester-Providence, MA-RI-NH-CT Combined Statistical Area.
Rockingham County | |
|---|---|
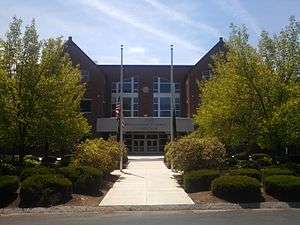 Rockingham County Courthouse | |
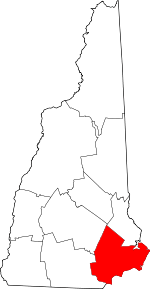 Location within the U.S. state of New Hampshire | |
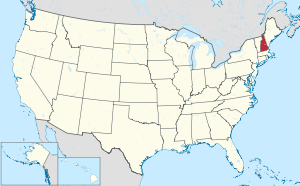 New Hampshire's location within the U.S. | |
| Coordinates: 42°57′46″N 71°04′39″W | |
| Country | |
| State | |
| Founded | 1769 |
| Named for | Charles Watson-Wentworth, 2nd Marquess of Rockingham |
| Seat | Brentwood |
| Largest town | Derry |
| Area | |
| • Total | 795.2 sq mi (2,060 km2) |
| • Land | 695.4 sq mi (1,801 km2) |
| • Water | 99.9 sq mi (259 km2) 12.6% |
| Population (2010) | |
| • Total | 295,223 |
| • Estimate (2019) | 309,769 |
| • Density | 444.6/sq mi (171.7/km2) |
| Time zone | UTC−5 (Eastern) |
| • Summer (DST) | UTC−4 (EDT) |
| Congressional districts | 1st, 2nd |
| Website | www |
History
The area that today is Rockingham County was first settled by Europeans moving north from the Plymouth Colony in Massachusetts as early as 1623. The government was linked tightly with Massachusetts until New Hampshire became a separate colony in 1679, but counties were not introduced until 1769.
Rockingham was identified in 1769 as one of five original counties for the colony. It is named for Charles Watson-Wentworth, 2nd Marquess of Rockingham, who had been Prime Minister in 1765-1766. The county was organized in 1771, with its county seat at Exeter. In 1844 its area was reduced by the formation of Belknap County to the northwest. In 1997 the county court facilities were moved to Brentwood, a rural town adjacent to Exeter.[3]
Geography
According to the U.S. Census Bureau, the county has a total area of 795 square miles (2,060 km2), of which 695 square miles (1,800 km2) is land and 100 square miles (260 km2) (13%) is water.[4] The highest point in Rockingham County is Nottingham Mountain, at 1,340 feet (410 m), in the town of Deerfield. The county contains the entirety of New Hampshire's Atlantic coast, which, at approximately 18 miles (29 km), is the shortest ocean coastline of any state in the nation.[5]
Adjacent counties
- Strafford County (north)
- York County, Maine (northeast)
- Essex County, Massachusetts (south)
- Hillsborough County (west)
- Merrimack County (northwest)
National protected area
Demographics
| Historical population | |||
|---|---|---|---|
| Census | Pop. | %± | |
| 1790 | 43,184 | — | |
| 1800 | 45,427 | 5.2% | |
| 1810 | 50,175 | 10.5% | |
| 1820 | 55,246 | 10.1% | |
| 1830 | 44,325 | −19.8% | |
| 1840 | 45,771 | 3.3% | |
| 1850 | 49,194 | 7.5% | |
| 1860 | 50,122 | 1.9% | |
| 1870 | 47,297 | −5.6% | |
| 1880 | 49,064 | 3.7% | |
| 1890 | 49,650 | 1.2% | |
| 1900 | 51,118 | 3.0% | |
| 1910 | 52,188 | 2.1% | |
| 1920 | 52,498 | 0.6% | |
| 1930 | 53,750 | 2.4% | |
| 1940 | 58,142 | 8.2% | |
| 1950 | 70,059 | 20.5% | |
| 1960 | 99,029 | 41.4% | |
| 1970 | 138,951 | 40.3% | |
| 1980 | 190,345 | 37.0% | |
| 1990 | 245,845 | 29.2% | |
| 2000 | 277,359 | 12.8% | |
| 2010 | 295,223 | 6.4% | |
| Est. 2019 | 309,769 | [6] | 4.9% |
| U.S. Decennial Census[7] 1790-1960[8] 1900-1990[9] 1990-2000[10] 2010-2018[1] | |||
2000 census
As of the census[11] of 2000, there were 277,359 people, 104,529 households, and 74,320 families living in the county. The population density was 399 people per square mile (154/km²). There were 113,023 housing units at an average density of 163 per square mile (63/km²). The racial makeup of the county was 96.80% White, 0.58% Black or African American, 0.18% Native American, 1.11% Asian, 0.04% Pacific Islander, 0.38% from other races, and 0.92% from two or more races. 1.19% of the population were Hispanic or Latino of any race. 18.1% were of Irish, 14.6% English, 11.8% Italian, 10.5% French, 8.0% French Canadian, 6.0% German and 5.6% American ancestry. 94.3% spoke English, 1.8% French and 1.3% Spanish as their first language.
There were 104,529 households out of which 35.90% had children under the age of 18 living with them, 59.50% were married couples living together, 8.20% had a female householder with no husband present, and 28.90% were non-families. 22.00% of all households were made up of individuals and 7.00% had someone living alone who was 65 years of age or older. The average household size was 2.63 and the average family size was 3.11.
In the county, the population was spread out with 26.40% under the age of 18, 6.20% from 18 to 24, 32.80% from 25 to 44, 24.40% from 45 to 64, and 10.10% who were 65 years of age or older. The median age was 37 years. For every 100 females, there were 97.40 males. For every 100 females age 18 and over, there were 95.40 males.
The median income for a household in the county was $58,150, and the median income for a family was $66,345. (These figures had risen to $72,600 and $85,361 respectively, as of a 2007 estimate.[12]) Males had a median income of $45,598 versus $30,741 for females. The per capita income for the county was $26,656. About 3.10% of families and 4.50% of the population were below the poverty line, including 5.00% of those under age 18 and 6.40% of those age 65 or over.
2010 census
As of the 2010 United States Census, there were 295,223 people, 115,033 households, and 79,832 families living in the county.[13] The population density was 425.0 inhabitants per square mile (164.1/km2). There were 126,709 housing units at an average density of 182.4 per square mile (70.4/km2).[14] The racial makeup of the county was 95.5% white, 1.7% Asian, 0.7% black or African American, 0.2% American Indian, 0.6% from other races, and 1.4% from two or more races. Those of Hispanic or Latino origin made up 2.1% of the population.[13] In terms of ancestry, 26.9% were Irish, 19.0% were English, 14.8% were Italian, 9.7% were German, 7.3% were French Canadian, 5.6% were Polish, and 3.8% were American.[15]
Of the 115,033 households, 32.9% had children under the age of 18 living with them, 56.4% were married couples living together, 8.9% had a female householder with no husband present, 30.6% were non-families, and 23.5% of all households were made up of individuals. The average household size was 2.54 and the average family size was 3.03. The median age was 42.2 years.[13]
The median income for a household in the county was $75,825 and the median income for a family was $90,463. Males had a median income of $61,443 versus $42,478 for females. The per capita income for the county was $35,889. About 3.0% of families and 4.7% of the population were below the poverty line, including 4.9% of those under age 18 and 6.0% of those age 65 or over.[16]
Politics and government
Historically, Rockingham County has had the distinction of being a Republican stronghold, with only two Democratic presidential nominees having captured the county since 1964. However, in recent years, it has become more competitive. Republicans have typically remained dominant at the local level, but communities like Portsmouth and Exeter have been known for their liberal voting patterns.
| Year | Republican | Democratic | Third parties |
|---|---|---|---|
| 2016 | 49.9% 90,447 | 44.1% 79,994 | 6.1% 10,993 |
| 2012 | 51.6% 87,921 | 47.0% 80,142 | 1.4% 2,360 |
| 2008 | 48.8% 81,917 | 49.9% 83,723 | 1.3% 2,182 |
| 2004 | 51.7% 82,069 | 47.5% 75,437 | 0.8% 1,310 |
| 2000 | 49.1% 65,860 | 45.9% 61,628 | 5.0% 6,685 |
| 1996 | 40.8% 46,201 | 47.4% 53,644 | 11.8% 13,403 |
| 1992 | 38.3% 47,353 | 35.8% 44,317 | 26.0% 32,136 |
| 1988 | 63.2% 64,034 | 35.3% 35,775 | 1.6% 1,596 |
| 1984 | 69.0% 57,586 | 30.6% 25,557 | 0.4% 297 |
| 1980 | 57.8% 45,960 | 27.3% 21,712 | 14.9% 11,802 |
| 1976 | 53.9% 36,738 | 44.1% 30,051 | 2.0% 1,341 |
| 1972 | 63.1% 38,825 | 35.8% 21,998 | 1.2% 718 |
| 1968 | 55.0% 28,842 | 40.4% 21,195 | 4.6% 2,419 |
| 1964 | 41.7% 19,498 | 58.3% 27,256 | |
| 1960 | 62.2% 28,032 | 37.8% 17,063 | |
| 1956 | 73.4% 28,226 | 26.5% 10,198 | 0.1% 18 |
| 1952 | 68.6% 26,280 | 31.4% 12,040 | |
| 1948 | 60.7% 18,890 | 38.4% 11,937 | 1.0% 301 |
| 1944 | 56.6% 17,144 | 43.4% 13,170 | 0.0% 2 |
| 1940 | 53.7% 16,223 | 46.3% 14,001 | |
| 1936 | 54.8% 15,466 | 43.2% 12,207 | 2.0% 576 |
| 1932 | 56.4% 14,902 | 43.0% 11,363 | 0.5% 140 |
| 1928 | 69.2% 17,590 | 30.6% 7,782 | 0.2% 53 |
| 1924 | 68.4% 14,530 | 28.6% 6,073 | 3.0% 634 |
| 1920 | 67.3% 13,811 | 32.1% 6,582 | 0.6% 132 |
| 1916 | 50.3% 5,866 | 48.3% 5,637 | 1.4% 162 |
| 1912 | 37.5% 4,231 | 38.2% 4,306 | 24.3% 2,733 |
| 1908 | 60.3% 6,814 | 36.5% 4,118 | 3.2% 361 |
| 1904 | 61.0% 7,216 | 36.5% 4,320 | 2.5% 299 |
| 1900 | 59.3% 7,363 | 38.0% 4,719 | 2.7% 337 |
| 1896 | 69.3% 7,881 | 26.3% 2,992 | 4.4% 496 |
| 1892 | 50.8% 6,380 | 47.4% 5,961 | 1.8% 230 |
| 1888 | 48.8% 6,450 | 49.5% 6,553 | 1.7% 226 |
| 1884 | 50.6% 6,162 | 46.7% 5,682 | 2.7% 326 |
| 1880 | 53.3% 6,960 | 45.8% 5,989 | 0.9% 121 |
| 1876 | 53.5% 6,422 | 46.5% 5,576 | 0.0% 3 |
County Commission
The executive power of Rockingham County's government is held by three county commissioners, each representing one of the three commissioner districts within the county.[18]
| Districts | Name | Hometown | Party |
|---|---|---|---|
| District 1 | Kevin St. James (Vice Chair) | Kingston, NH | Republican |
| District 2 | Thomas Tombarello (Clerk) | Sandown, NH | Republican |
| District 3 | Kevin Coyle (Chair) | Derry, NH | Republican |
In addition to the County Commission, there are five directly-elected officials: they include County Attorney, Register of Deeds, County Sheriff, Register of Probate, and County Treasurer.[19]
| Office | Name |
|---|---|
| County Attorney | Patricia Conway (R) |
| Register of Deeds | Cathy Stacey (R) |
| County Sheriff | Chuck Massahos (R) |
| Register of Probate | Ray Tweedie (R) |
| County Treasurer | Scott Priestley (R) |
Legislative branch
The legislative branch of Rockingham County is made up of the members of the New Hampshire House of Representatives from the county. In total, as of August 2018 there are 90 members from 37 different districts.
| Affiliation | Members | Voting share | |
|---|---|---|---|
| Democratic Party | 29 | 32.2% | |
| Republican Party | 61 | 67.8% | |
| Total | 90 | 100% | |
Attractions
The Rockingham County Botanical Garden was a botanical garden located in Brentwood. Strawbery Banke Museum in Portsmouth is a collection of historic buildings from the seventeenth through nineteenth centuries. Canobie Lake Park, located in Salem, is an amusement park that opened in 1902. Also in Salem is Rockingham Park racetrack, which features weekly horse racing and is next to the Mall at Rockingham Park, and America's Stonehenge, which claims to be a pre-Columbian collection of stone structures. Derry was home to poet Robert Frost, who taught at nearby Pinkerton Academy. His home, the Robert Frost Farm, has been preserved as a state park.
Rockingham County is also home to New Hampshire's entire seacoast and features several popular resort towns. Hampton Beach has a boardwalk and Hampton Beach Casino Ballroom. The town of Rye features several undeveloped beaches such as Odiorne Point State Park and contains New Hampshire's portion of the Isles of Shoals. Seabrook contains the Seabrook Greyhound Racing Park and the Seabrook Nuclear Power Plant, the last nuclear plant opened in the United States.
Communities

City
Towns
- Atkinson
- Auburn
- Brentwood (county seat)
- Candia
- Chester
- Danville
- Deerfield
- Derry
- East Kingston
- Epping
- Exeter
- Fremont
- Greenland
- Hampstead
- Hampton
- Hampton Falls
- Kensington
- Kingston
- Londonderry
- New Castle
- Newfields
- Newington
- Newmarket
- Newton
- North Hampton
- Northwood
- Nottingham
- Plaistow
- Raymond
- Rye
- Salem
- Sandown
- Seabrook
- South Hampton
- Stratham
- Windham
Census-designated places
References
- "State & County QuickFacts". United States Census Bureau. Retrieved September 24, 2013.
- "Find a County". National Association of Counties. Retrieved June 7, 2011.
- "Ignoring quality issues at courthouse is criminal". The Exeter News-Letter. Retrieved March 10, 2009.
- "2010 Census Gazetteer Files". United States Census Bureau. August 22, 2012. Archived from the original on December 27, 2014. Retrieved December 27, 2014.
- des
.nh .gov /organization /divisions /water /wmb /coastal /documents /coastal _access _map .pdf - "Population and Housing Unit Estimates". Retrieved May 16, 2019.
- "U.S. Decennial Census". United States Census Bureau. Retrieved December 27, 2014.
- "Historical Census Browser". University of Virginia Library. Retrieved December 27, 2014.
- "Population of Counties by Decennial Census: 1900 to 1990". United States Census Bureau. Retrieved December 27, 2014.
- "Census 2000 PHC-T-4. Ranking Tables for Counties: 1990 and 2000" (PDF). United States Census Bureau. Retrieved December 27, 2014.
- "U.S. Census website". United States Census Bureau. Retrieved January 31, 2008.
- "American FactFinder - Community Facts". factfinder.census.gov. Archived from the original on February 11, 2020. Retrieved May 9, 2017.
- "DP-1 Profile of General Population and Housing Characteristics: 2010 Demographic Profile Data". United States Census Bureau. Archived from the original on February 13, 2020. Retrieved January 12, 2016.
- "Population, Housing Units, Area, and Density: 2010 - County". United States Census Bureau. Archived from the original on February 13, 2020. Retrieved January 12, 2016.
- "DP02 SELECTED SOCIAL CHARACTERISTICS IN THE UNITED STATES – 2006-2010 American Community Survey 5-Year Estimates". United States Census Bureau. Archived from the original on February 13, 2020. Retrieved January 12, 2016.
- "DP03 SELECTED ECONOMIC CHARACTERISTICS – 2006-2010 American Community Survey 5-Year Estimates". United States Census Bureau. Archived from the original on February 13, 2020. Retrieved January 12, 2016.
- Leip, David. "Dave Leip's Atlas of U.S. Presidential Elections". uselectionatlas.org. Retrieved June 9, 2018.
- http://sos.nh.gov/2016CountyGen.aspx?id=8589963586
- http://www.rockinghamcountynh.org/departments/
Further reading
- D. Hamilton Hurd, History of Rockingham and Strafford Counties, New Hampshire: With Biographical Sketches of Many of Its Pioneers and Prominent Men. Philadelphia: J.W. Lewis, 1882.
External links
| Wikimedia Commons has media related to Rockingham County, New Hampshire. |
Places adjacent to Rockingham County, New Hampshire | ||||||||||
|---|---|---|---|---|---|---|---|---|---|---|
| ||||||||||
Municipalities and communities of Rockingham County, New Hampshire, United States | ||
|---|---|---|
| City | Map of New Hampshire highlighting Rockingham County | |
| Towns |
| |
| CDPs | ||
| Other villages | ||
| Authority control |
|
|---|