Essex County, Massachusetts
Essex County is a county in the northeastern part of the U.S. state of Massachusetts. As of the 2010 census, the total population was 743,159,[1] making it the third-most populous county in the state. It is part of the Greater Boston area (the Boston–Cambridge–Newton, MA–NH Metropolitan Statistical Area). The largest city in Essex County is Lynn. The county was named after the English county of Essex.
Essex County | |
|---|---|
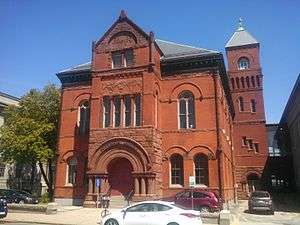 Former Essex County Courthouse in Salem | |
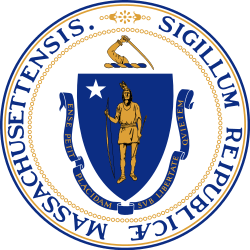
 Seal | |
 Location within the U.S. state of Massachusetts | |
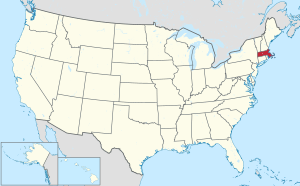 Massachusetts's location within the U.S. | |
| Coordinates: 42°38′08″N 70°58′15″W | |
| Country | |
| State | |
| Founded | 1643 |
| Named for | Essex |
| Seat | Salem and Lawrence |
| Largest city | Lynn |
| Area | |
| • Total | 828 sq mi (2,140 km2) |
| • Land | 493 sq mi (1,280 km2) |
| • Water | 336 sq mi (870 km2) 41%% |
| Population | |
| • Estimate (2019) | 789,034 |
| • Density | 1,509/sq mi (583/km2) |
| Time zone | UTC−5 (Eastern) |
| • Summer (DST) | UTC−4 (EDT) |
| Congressional districts | 3rd, 6th |
It has two traditional county seats: Salem and Lawrence. Prior to the dissolution of the county government in 1999, Salem had jurisdiction over the Southern Essex District, and Lawrence had jurisdiction over the Northern Essex District, but currently these cities do not function as seats of government. However, the county and the districts remain as administrative regions recognized by various governmental agencies, which gathered vital statistics or disposed of judicial case loads under these geographic subdivisions, and are required to keep the records based on them. The county has been designated the Essex National Heritage Area by the National Park Service.
History
The county was created by the General Court of the Massachusetts Bay Colony on May 10, 1643, when it was ordered "that the whole plantation within this jurisdiction be divided into four sheires". Named after the county in England, Essex then comprised the towns of Salem, Lynn, Wenham, Ipswich, Rowley, Newbury, Gloucester, and Andover.[2] In 1680, Haverhill and Salisbury, both located north of the Merrimack River, were annexed to Essex County. These communities had been part of Massachusetts' colonial-era Norfolk County. The remaining four towns within colonial Norfolk County, which included Exeter and what is now Portsmouth, were transferred to what became Rockingham County in the Province of New Hampshire. The ten large founding Massachusetts-based settlements were then subdivided over the centuries to produce Essex County's modern composition of cities and towns.
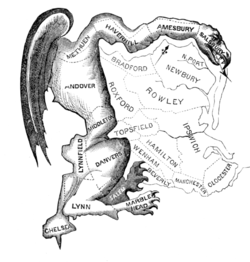
Essex County is where Elbridge Gerry (who was born and raised in Marblehead) created a legislative district in 1812 that gave rise to the word gerrymandering.
Due to a confluence of floods, hurricanes, and severe winter storms, Essex County has had more disaster declarations than most other U.S. counties, from 1964 to 2016.[3][4]
Law and government
From the founding of the Republican Party until the New Deal, Essex County was a Republican stronghold in presidential elections. Since 1936, it has trended Democratic, with Dwight Eisenhower in 1952 and 1956 and Ronald Reagan in 1980 and 1984 being the only Republicans to carry the county since.
| Year | Republican | Democratic | Third parties |
|---|---|---|---|
| 2016 | 35.4% 136,316 | 57.7% 222,310 | 6.9% 26,744 |
| 2012 | 41.1% 150,480 | 57.4% 210,302 | 1.5% 5,575 |
| 2008 | 38.8% 137,129 | 59.1% 208,976 | 2.1% 7,357 |
| 2004 | 40.6% 135,114 | 58.2% 194,068 | 1.2% 4,051 |
| 2000 | 35.5% 110,010 | 57.5% 178,400 | 7.1% 21,923 |
| 1996 | 30.6% 89,120 | 58.7% 171,021 | 10.7% 31,301 |
| 1992 | 31.7% 102,212 | 43.6% 140,593 | 24.7% 79,523 |
| 1988 | 48.7% 148,614 | 49.7% 151,816 | 1.7% 5,070 |
| 1984 | 54.8% 162,152 | 44.8% 132,353 | 0.4% 1,151 |
| 1980 | 43.8% 130,252 | 39.1% 116,173 | 17.2% 51,108 |
| 1976 | 41.7% 125,538 | 55.0% 165,710 | 3.4% 10,196 |
| 1972 | 46.5% 138,040 | 53.0% 157,324 | 0.6% 1,720 |
| 1968 | 35.4% 99,721 | 61.0% 171,901 | 3.6% 10,063 |
| 1964 | 25.3% 71,653 | 74.3% 210,135 | 0.4% 1,157 |
| 1960 | 42.9% 126,599 | 56.9% 167,875 | 0.2% 607 |
| 1956 | 60.1% 166,115 | 39.7% 109,671 | 0.2% 667 |
| 1952 | 55.6% 156,030 | 44.0% 123,334 | 0.4% 1,045 |
| 1948 | 44.2% 108,894 | 53.6% 132,016 | 2.2% 5,461 |
| 1944 | 48.5% 111,958 | 51.2% 118,228 | 0.3% 570 |
| 1940 | 47.7% 116,134 | 51.7% 125,998 | 0.7% 1,603 |
| 1936 | 43.6% 97,310 | 47.6% 106,078 | 8.8% 19,611 |
| 1932 | 49.4% 95,277 | 47.6% 91,787 | 3.1% 5,954 |
| 1928 | 52.9% 102,008 | 46.4% 89,508 | 0.7% 1,294 |
| 1924 | 66.6% 92,918 | 18.4% 25,635 | 15.0% 20,997 |
| 1920 | 71.9% 95,057 | 23.1% 30,560 | 5.0% 6,647 |
| 1916 | 50.5% 35,909 | 45.7% 32,498 | 3.8% 2,688 |
| 1912 | 32.2% 21,441 | 31.1% 20,691 | 36.8% 24,507[6] |
| 1908 | 59.2% 36,351 | 30.6% 18,801 | 10.1% 6,221 |
| 1904 | 62.3% 36,980 | 31.3% 18,562 | 6.5% 3,850 |
| 1900 | 57.8% 32,924 | 34.7% 19,781 | 7.5% 4,242 |
| 1896 | 68.6% 37,041 | 27.8% 15,025 | 3.5% 1,898 |
| 1892 | 54.5% 29,088 | 41.2% 21,975 | 4.4% 2,320 |
| 1888 | 56.7% 27,560 | 40.8% 19,812 | 2.5% 1,234 |
| 1884 | 47.7% 20,304 | 35.6% 15,148 | 16.7% 7,118 |
| 1880 | 55.3% 22,544 | 40.0% 16,307 | 4.7% 1,909 |
| 1876 | 59.0% 21,689 | 40.5% 14,895 | 0.5% 165 |
Like several other Massachusetts counties, Essex County exists today only as a historical geographic region, and has no county government. All former county functions were assumed by state agencies in 1999. The sheriff (currently Kevin Coppinger) and some other regional officials with specific duties are still elected locally to perform duties within the county region, but there is no county council, commissioner, or county employees. Communities are now granted the right to form their own regional compacts for sharing services. See also: League of Women Voters page on Massachusetts counties.
Geography
Essex County is roughly diamond-shaped and occupies the northeastern corner of the state of Massachusetts.
According to the U.S. Census Bureau, the county has a total area of 828 square miles (2,140 km2), of which 493 square miles (1,280 km2) is land and 336 square miles (870 km2) (41%) is water.[7] Essex County is adjacent to Rockingham County, New Hampshire to the north, the Atlantic Ocean (specifically the Gulf of Maine and Massachusetts Bay) to the east, Suffolk County to the south, Middlesex County to the west and a very small portion of Hillsborough County, New Hampshire to the far north west in Methuen. All county land is incorporated into towns or cities.
Essex County includes the North Shore, Cape Ann, and the lower portions of the Merrimack Valley.
Transportation
These routes pass through Essex County:


The Lawrence Municipal Airport and Beverly Municipal Airport are regional airports within the county; the nearest commercial airports are Logan Airport in Boston and Manchester-Boston Regional Airport in Manchester, NH.
The MBTA commuter rail has two lines operating in Essex County: the Haverhill Line and the Newburyport Line, both of which go toward Boston. Close to Boston, MBTA buses also exist. The MVRTA is a bus company that connects cities within the Merrimack Valley portion of Essex County.
National protected areas
Because of Essex County's rich history, which includes 17th century colonial history, maritime history spanning its existence, and leadership in the expansions of the textile industry in the 19th century, the entire county has been designated the Essex National Heritage Area by the National Park Service.
The following areas of national significance have also been preserved:
Demographics
| Historical population | |||
|---|---|---|---|
| Census | Pop. | %± | |
| 1790 | 57,879 | — | |
| 1800 | 61,196 | 5.7% | |
| 1810 | 71,888 | 17.5% | |
| 1820 | 74,655 | 3.8% | |
| 1830 | 82,859 | 11.0% | |
| 1840 | 94,987 | 14.6% | |
| 1850 | 131,300 | 38.2% | |
| 1860 | 165,611 | 26.1% | |
| 1870 | 200,843 | 21.3% | |
| 1880 | 244,535 | 21.8% | |
| 1890 | 299,995 | 22.7% | |
| 1900 | 357,030 | 19.0% | |
| 1910 | 436,477 | 22.3% | |
| 1920 | 482,156 | 10.5% | |
| 1930 | 498,040 | 3.3% | |
| 1940 | 496,313 | −0.3% | |
| 1950 | 522,384 | 5.3% | |
| 1960 | 568,831 | 8.9% | |
| 1970 | 637,887 | 12.1% | |
| 1980 | 633,632 | −0.7% | |
| 1990 | 670,080 | 5.8% | |
| 2000 | 723,419 | 8.0% | |
| 2010 | 743,159 | 2.7% | |
| Est. 2019 | 789,034 | [8] | 6.2% |
| U.S. Decennial Census[9] 1790-1960[10] 1900-1990[11] 1990-2000[12] 2010-2019[1] | |||
As of the 2010 United States Census, there were 743,159 people, 285,956 households, and 188,005 families residing in the county.[13] The population density was 1,508.8 inhabitants per square mile (582.6/km2). There were 306,754 housing units at an average density of 622.8 per square mile (240.5/km2).[14] The racial makeup of the county was 81.9% white, 3.8% black or African American, 3.1% Asian, 0.4% American Indian, 8.2% from other races, and 2.6% from two or more races. Those of Hispanic or Latino origin made up 16.5% of the population.[13] In terms of ancestry, 23.3% were Irish, 17.1% were Italian, 12.6% were English, 6.1% were German, and 3.6% were American.[15]
Of the 285,956 households, 32.9% had children under the age of 18 living with them, 47.9% were married couples living together, 13.5% had a female householder with no husband present, 34.3% were non-families, and 28.1% of all households were made up of individuals. The average household size was 2.54 and the average family size was 3.14. The median age was 40.4 years.[13]
The median income for a household in the county was $64,153 and the median income for a family was $81,173. Males had a median income of $58,258 versus $44,265 for females. The per capita income for the county was $33,828. About 7.7% of families and 10.1% of the population were below the poverty line, including 13.3% of those under age 18 and 9.4% of those age 65 or over.[16]
Demographic breakdown by town
Income
The ranking of unincorporated communities that are included on the list are reflective if the census designated locations and villages were included as cities or towns. Data is from the 2007-2011 American Community Survey 5-Year Estimates.[17][18][19]
| Rank | Town | Per capita income |
Median household income |
Median family income |
Population | Number of households | |
|---|---|---|---|---|---|---|---|
| 1 | Manchester-by-the-Sea | Town | $69,930 | $114,639 | $131,136 | 5,137 | 2,047 |
| 2 | Boxford | Town | $67,601 | $137,159 | $145,691 | 7,950 | 2,665 |
| Boxford | CDP | $65,327 | $112,656 | $121,000 | 2,406 | 763 | |
| 3 | Marblehead | Town | $55,778 | $99,574 | $122,679 | 19,811 | 7,898 |
| 4 | Wenham | Town | $55,054 | $139,856 | $159,688 | 4,831 | 1,311 |
| Topsfield | CDP | $53,247 | $116,667 | $125,156 | 2,788 | 976 | |
| 5 | West Newbury | Town | $52,882 | $104,931 | $123,237 | 4,222 | 1,497 |
| 6 | Andover | Town | $52,404 | $113,936 | $142,413 | 32,945 | 11,929 |
| 7 | Nahant | Town | $51,308 | $77,243 | $134,875 | 3,420 | 1,531 |
| 8 | Topsfield | Town | $50,689 | $116,122 | $122,794 | 6,075 | 2,039 |
| 9 | Swampscott | Town | $48,013 | $90,148 | $108,004 | 13,826 | 5,577 |
| 10 | North Andover | Town | $47,092 | $95,199 | $121,563 | 28,156 | 10,223 |
| 11 | Newburyport | City | $46,327 | $80,861 | $117,305 | 18,202 | 10,534 |
| 12 | Lynnfield | Town | $44,969 | $101,921 | $115,726 | 11,548 | 4,069 |
| 13 | Newbury | Town | $44,349 | $89,107 | $120,870 | 6,647 | 2,516 |
| Essex | CDP | $43,589 | $77,188 | $121,343 | 1,581 | 669 | |
| 14 | Rockport | Town | $43,201 | $71,447 | $98,587 | 7,021 | 3,020 |
| 15 | Georgetown | Town | $42,683 | $106,765 | $125,417 | 8,083 | 2,790 |
| 16 | Ipswich | Town | $42,494 | $84,609 | $100,000 | 13,127 | 5,473 |
| Andover | CDP | $41,811 | $72,440 | $105,000 | 8,799 | 3,640 | |
| 17 | Amesbury | City | $41,142 | $79,293 | $94,946 | 16,267 | 6,543 |
| 18 | Essex | Town | $40,213 | $79,492 | $115,048 | 3,470 | 1,383 |
| Rowley | CDP | $39,483 | $69,243 | $75,481 | 1,370 | 615 | |
| 19 | Danvers | Town | $39,067 | $78,593 | $98,723 | 26,303 | 10,282 |
| 20 | Rowley | Town | $38,592 | $79,449 | $103,197 | 5,815 | 2,254 |
| 21 | Hamilton | Town | $38,157 | $103,774 | $113,000 | 7,809 | 2,532 |
| 22 | Groveland | Town | $37,173 | $91,080 | $100,972 | 6,401 | 2,372 |
| 23 | Beverly | City | $36,889 | $67,733 | $90,672 | 39,455 | 15,278 |
| Salisbury | CDP | $36,812 | $65,205 | $77,119 | 4,735 | 2,117 | |
| Ipswich | CDP | $36,687 | $70,970 | $86,397 | 3,951 | 1,831 | |
| 24 | Merrimac | Town | $36,643 | $76,936 | $90,812 | 6,297 | 2,442 |
| 25 | Middleton | Town | $36,194 | $93,415 | $100,288 | 8,839 | 2,621 |
| Rockport | CDP | $36,099 | $56,250 | $97,241 | 4,952 | 2,137 | |
| 26 | Gloucester | City | $35,080 | $59,061 | $76,610 | 28,869 | 12,310 |
| Massachusetts | State | $35,051 | $65,981 | $83,371 | 6,512,227 | 2,522,409 | |
| Essex County | County | $34,858 | $65,785 | $83,047 | 739,505 | 284,940 | |
| 27 | Salisbury | Town | $34,755 | $68,194 | $82,353 | 8,212 | 3,399 |
| 28 | Saugus | Town | $34,076 | $75,258 | $93,125 | 26,516 | 9,917 |
| 29 | Peabody | City | $32,442 | $65,471 | $80,859 | 50,824 | 20,890 |
| 30 | Salem | City | $30,961 | $56,203 | $64,769 | 41,163 | 17,690 |
| 31 | Haverhill | City | $30,574 | $60,611 | $76,754 | 60,544 | 24,334 |
| 32 | Methuen | City | $29,778 | $65,799 | $81,190 | 46,785 | 17,508 |
| United States | Country | $27,915 | $52,762 | $64,293 | 306,603,772 | 114,761,359 | |
| 33 | Lynn | City | $22,190 | $44,367 | $51,384 | 90,006 | 34,018 |
| 34 | Lawrence | City | $17,068 | $31,478 | $35,606 | 75,761 | 27,004 |
Politics
| Voter registration and party enrollment as of October 17, 2018[20] | |||||
|---|---|---|---|---|---|
| Party | Number of voters | Percentage | |||
| Democratic | 162,360 | 30.48% | |||
| Republican | 58,151 | 10.92% | |||
| Unenrolled | 305,206 | 57.29% | |||
| Minor parties | 1,807 | 0.34% | |||
| Total | 532,750 | 100% | |||
Education
Essex County is home to numerous libraries and schools, both public and private.
Libraries
Secondary education
Public schools
- Amesbury High School serves Amesbury and South Hampton, New Hampshire
- Andover High School
- Beverly High School
- Danvers High School[23]
- Georgetown High School
- Gloucester High School
- Hamilton-Wenham Regional High School
- Haverhill High School
- Ipswich High School
- Lawrence High School[24]
- Lynn Classical High School
- Lynn English High School
- Lynnfield High School[25]
- Manchester Essex Regional High School
- Marblehead High School
- Masconomet Regional High School, serves Topsfield, Boxford and Middleton
- Methuen High School
- Newburyport High School
- North Andover High School
- Northshore Academy
- Peabody Veterans Memorial High School
- Pentucket Regional High School, serves Groveland, Merrimac and West Newbury
- Rockport High School
- Salem High School
- Saugus High School
- Swampscott High School,[26] serves Swampscott and Nahant
- Triton Regional High School, serves Newbury, Rowley and Salisbury
Technical schools
Private schools
- Academy at Penguin Hall
- Bishop Fenwick High School
- Bradford Christian Academy
- Brooks School
- Central Catholic High School
- The Clark School (Rowley, Massachusetts)
- The Governor's Academy
- Phillips Academy
- Pingree School
- Presentation of Mary Academy
- St. John's Preparatory School
- St. Mary's High School
- The Waring School
Higher education
- Endicott College
- Gordon College
- Gordon-Conwell Theological Seminary
- Marian Court College - Now closed
- Massachusetts School of Law
- Merrimack College
- Montserrat College of Art
- North Shore Community College
- Northern Essex Community College
- Northpoint Bible College
- Salem State University
Economy
Employment
As of 2015, the county had total employment of 282,412.[7] The largest employer in the county is Massachusetts General Hospital, with over 5,000 employees.[27]
Banking
Based on deposits in the county, the five largest banks are TD Bank, N.A., Salem Five Cents Bank, Institution for Savings, Bank of America, and Eastern Bank.[28]
Essex National Heritage Area
On November 12, 1996, Essex National Heritage Area (ENHA) was authorized by Congress. The heritage area consists of all of Essex County, MA a 500-square-mile (1,300 km2) area between the Atlantic Coast and the Merrimack Valley. The area includes 34 cities and towns; two National Historic Sites (Salem Maritime National Historic Site and Saugus Iron Works National Historic Site); and thousands of historic sites and districts that illuminate colonial settlement, the development of the shoe and textile industries, and the growth and decline of the maritime industries, including fishing, privateering, and the China trade.[29] The Essex National Heritage Area[30] is one of 49 heritage areas designated by Congress, affiliated with the National Park Service.
The Essex National Heritage Commission is a non-profit organization chartered to promote tourism and cultural awareness of the area, connecting people to the places of Essex County, MA. The Commission's mission is to promote and preserve the historic, cultural and natural resources of the ENHA by rallying community support around saving the character of the area. This is accomplished through the commission's projects and programs, which include Partnership Grant Program, Explorers membership program, photo safaris, and the annual September weekend event Trails & Sails,[31] as well as other important regional partnership building projects like the Essex Heritage Scenic Byway, and the Border to Boston trail.
Communities
The towns and cities of Essex County are listed below.
Cities
- Amesbury
- Beverly
- Gloucester
- Haverhill
- Lawrence (traditional county seat)
- Lynn
- Methuen
- Newburyport
- Peabody
- Salem (traditional county seat)
Towns
Other villages
- Annisquam
- Ballardvale
- Beverly Farms
- Bradford
- Byfield
- Clifton
- Magnolia
- Merrimacport
- Rocks Village
- Plum Island
See also
Notes
- "State & County QuickFacts". United States Census Bureau. Archived from the original on 10 July 2011. Retrieved 5 September 2013.
- Davis, William T. Bench and Bar of the Commonwealth of Massachusetts, p. 44. The Boston History Company, 1895.
- "Frequency of Disaster Declarations". New America.
- "Essex County, Massachusetts". New America.
- Leip, David. "Dave Leip's Atlas of U.S. Presidential Elections". uselectionatlas.org.
- The leading "other" candidate, Progressive Theodore Roosevelt, received 21,098 votes, while Socialist candidate Eugene Debs received 2,716 votes, Prohibition candidate Eugene Chafin received 444 votes, and Socialist Labor candidate Arthur Reimer received 249 votes.
- "United States Census Bureau QuickFacts: Essex County, Massachusetts". United States Census Bureau.
- "Population and Housing Unit Estimates". Retrieved March 26, 2020.
- "U.S. Decennial Census". United States Census Bureau. Retrieved September 16, 2014.
- "Historical Census Browser". University of Virginia Library. Retrieved September 16, 2014.
- "Population of Counties by Decennial Census: 1900 to 1990". United States Census Bureau. Retrieved September 16, 2014.
- "Census 2000 PHC-T-4. Ranking Tables for Counties: 1990 and 2000" (PDF). United States Census Bureau. Retrieved September 16, 2014.
- "DP-1 Profile of General Population and Housing Characteristics: 2010 Demographic Profile Data". United States Census Bureau. Archived from the original on 2020-02-13. Retrieved 2016-01-13.
- "Population, Housing Units, Area, and Density: 2010 - County". United States Census Bureau. Archived from the original on 2020-02-13. Retrieved 2016-01-13.
- "DP02 SELECTED SOCIAL CHARACTERISTICS IN THE UNITED STATES – 2006-2010 American Community Survey 5-Year Estimates". United States Census Bureau. Archived from the original on 2020-02-13. Retrieved 2016-01-13.
- "DP03 SELECTED ECONOMIC CHARACTERISTICS – 2006-2010 American Community Survey 5-Year Estimates". United States Census Bureau. Archived from the original on 2020-02-13. Retrieved 2016-01-13.
- "SELECTED ECONOMIC CHARACTERISTICS 2007-2011 American Community Survey 5-Year Estimates". U.S. Census Bureau. Archived from the original on 12 February 2020. Retrieved 5 September 2013.
- "ACS Demographic and Housing Estimates 2007-2011 American Community Survey 5-Year Estimates". U.S. Census Bureau. Archived from the original on 12 February 2020. Retrieved 5 September 2013.
- "Households and Families 2007-2011 American Community Survey 5-Year Estimates". U.S. Census Bureau. Archived from the original on 12 February 2020. Retrieved 5 September 2013.
- "Registration and Party Enrollment Statistics as of October 17, 2018" (PDF). Massachusetts Elections Division. Retrieved January 25, 2019.
- Merrimack Valley Library Consortium - Northern Essex and Middlesex County Libraries
- North of Boston Library Exchange - Southern Essex and Middlesex County Libraries
- "Danvers High School". Archived from the original on September 19, 2013. Retrieved December 18, 2018.
- Lawrence High School
- Lynnfield High School
- Swampscott High School
- "Largest 200 Employers in Essex County". Massachusetts Executive Office of Labor and Workforce Development.
- "Deposit Market Share Report". Federal Deposit Insurance Corporation.
- The National Parks: Index 2001-2003, Washington, D.C.: National Park Service, p. 104.
- Essex National Heritage Area
- Trails & Sails
References
- Arrington, Benjamin F., ed. (1922A). Municipal History of Essex County in Massachusetts. Volume I (Tercentenary ed.). New York: Lewis Historical Publishing Company.CS1 maint: ref=harv (link)
- Arrington, Benjamin F., ed. (1922B). Municipal History of Essex County in Massachusetts. Volume II (Tercentenary ed.). New York: Lewis Historical Publishing Company.CS1 maint: ref=harv (link)
- Arrington, Benjamin F., ed. (1922C). Municipal History of Essex County in Massachusetts. Volume III (Tercentenary ed.). New York: Lewis Historical Publishing Company.CS1 maint: ref=harv (link)
- Arrington, Benjamin F., ed. (1922D). Municipal History of Essex County in Massachusetts. Volume IV (Tercentenary ed.). New York: Lewis Historical Publishing Company.CS1 maint: ref=harv (link)
- Hurd, Duane Hamilton. History of Essex County, Massachusetts: With Biographical Sketches of Many Pioneers and Prominent Men. Volume 1. Volume 2 Published 1888 by J.W. Lewis and Co.
- Newhall, James Robinson. The Essex Memorial, for 1836: Embracing a Register of the County. Published 1836.
- Lewis, Alonzo and James Robinson Newhall. History of Lynn, Essex County, Massachusetts: Including Lynnfield,Saugus, Swampscott and Nahant.Published 1865 by John L. Shorey 13 Washington St. Lynn.
- Perley, Sidney. The Essex Antiquarian. Volume 1 1897.Volume 3 1899.Volume 6 1902.Volume 8 1904
- Various. Early Massachusetts Vital Records 1600–1849
Further reading
- Jeremiah Spofford (1860), "Counties: Essex", Historical and Statistical Gazetteer of Massachusetts (2nd ed.), Haverhill: E.G. Frothingham
- Essex-County History and Directory. Boston: C.A. & J.F. Wood. 1870 – via HathiTrust.
- Joseph Sabin, ed. (1873). "Essex Co., Mass.". Bibliotheca Americana. 6. New York. OCLC 13972268.
- Essex County Directory for 1884-85. Boston, Massachusetts: Briggs & Co. 1884 – via Internet Archive.
- George Chinn; Fred E. Smith (1884). Wheelman's Hand-book of Essex County. Marblehead: G. Chinn.
External links
| Wikimedia Commons has media related to Essex County, Massachusetts. |
Registries
- "Southern Essex District Registry of Deeds". Commonwealth of Massachusetts. Archived from the original on November 19, 2012. Located in Salem, Massachusetts.
- "Northern Essex Registry of Deeds". Commonwealth of Massachusetts. Located in Lawrence, Massachusetts.
Maps
- "Map of Essex County, Mass". Atlases. Registry of Deeds Southern Essex District. 1872. Archived from the original on February 8, 2012.
Other sites
- "Merrimack Valley Planning Commission". Official website.
- "PEM Peabody Essex Museum". Official website.
- "Massachusetts - Essex County". National Register of Historic Places. nationalregisterofhistoricplaces.com. Archived from the original on 2012-10-16. Retrieved 2012-10-16.
- Essex County Sheriff's Department
Places adjacent to Essex County, Massachusetts | ||||||||||
|---|---|---|---|---|---|---|---|---|---|---|
| ||||||||||
Municipalities and communities of Essex County, Massachusetts, United States | ||
|---|---|---|
| Cities | | |
| Towns | ||
| CDPs | ||
| Other villages |
| |
| Authority control |
|
|---|