Sullivan County, New Hampshire
Sullivan County is a county in the U.S. state of New Hampshire. As of the 2010 census, the population was 43,742,[1] making it the second-least populous county in New Hampshire. Its county seat is Newport.[2]
Sullivan County | |
|---|---|
 Lempster Mountain Wind Power Project overlooking cemetery in East Lempster, NH | |
 Seal | |
 Location within the U.S. state of New Hampshire | |
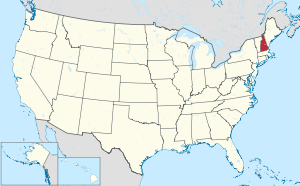 New Hampshire's location within the U.S. | |
| Coordinates: 43°20′39″N 72°14′50″W | |
| Country | |
| State | |
| Founded | 1827 |
| Named for | John Sullivan |
| Seat | Newport |
| Largest city | Claremont |
| Area | |
| • Total | 552.1 sq mi (1,430 km2) |
| • Land | 537.5 sq mi (1,392 km2) |
| • Water | 14.6 sq mi (38 km2) 2.6% |
| Population (2010) | |
| • Total | 43,742 |
| • Estimate (2019) | 43,146 |
| • Density | 80.3/sq mi (31.0/km2) |
| Time zone | UTC−5 (Eastern) |
| • Summer (DST) | UTC−4 (EDT) |
| Congressional district | 2nd |
| Website | www |
Sullivan County is included in the Claremont-Lebanon, NH-VT Micropolitan Statistical Area.
History
Sullivan County was organized at Newport in 1827 and is named for John Sullivan (1740–1795), the Revolutionary War hero and a former governor. It was formed from the northern part of Cheshire County.
Geography
According to the U.S. Census Bureau, the county has a total area of 552 square miles (1,430 km2), of which 537 square miles (1,390 km2) is land and 15 square miles (39 km2) (2.7%) is water.[3] It is the third-smallest county in New Hampshire by area.
Adjacent counties
- Grafton County (north)
- Merrimack County (east)
- Hillsborough County (southeast)
- Cheshire County (south)
- Windham County, Vermont (southwest)
- Windsor County, Vermont (west)
National protected area
- Saint-Gaudens National Historic Site
Demographics
| Historical population | |||
|---|---|---|---|
| Census | Pop. | %± | |
| 1830 | 19,669 | — | |
| 1840 | 20,340 | 3.4% | |
| 1850 | 19,375 | −4.7% | |
| 1860 | 19,041 | −1.7% | |
| 1870 | 18,058 | −5.2% | |
| 1880 | 18,161 | 0.6% | |
| 1890 | 17,304 | −4.7% | |
| 1900 | 18,009 | 4.1% | |
| 1910 | 19,337 | 7.4% | |
| 1920 | 20,922 | 8.2% | |
| 1930 | 24,286 | 16.1% | |
| 1940 | 25,442 | 4.8% | |
| 1950 | 26,441 | 3.9% | |
| 1960 | 28,067 | 6.1% | |
| 1970 | 30,949 | 10.3% | |
| 1980 | 36,063 | 16.5% | |
| 1990 | 38,592 | 7.0% | |
| 2000 | 40,458 | 4.8% | |
| 2010 | 43,742 | 8.1% | |
| Est. 2019 | 43,146 | [4] | −1.4% |
| U.S. Decennial Census[5] 1790-1960[6] 1900-1990[7] 1990-2000[8] 2010-2018[1] | |||
2000 census
At the 2000 census,[9] there were 40,458 people, 16,530 households and 11,174 families living in the county. The population density was 29/; (75/sq mi). There were 20,158 housing units at an average density of 38 per square mile (14/km²). The racial makeup of the county was 97.99% White, 0.24% Black or African American, 0.29% Native American, 0.37% Asian, 0.02% Pacific Islander, 0.14% from other races, and 0.94% from two or more races. 0.55% of the population were Hispanic or Latino of any race. 16.9% were of English, 14.7% French, 11.7% French Canadian, 10.7% American, 10.0% Irish, 6.2% German and 5.1% Italian ancestry. 96.1% spoke English and 1.6% French as their first language.
There were 16,530 households of which 29.40% had children under the age of 18 living with them, 54.70% were married couples living together, 8.60% had a female householder with no husband present, and 32.40% were non-families. 25.70% of all households were made up of individuals and 10.90% had someone living alone who was 65 years of age or older. The average household size was 2.41 and the average family size was 2.88.
23.90% of the population were under the age of 18, 6.40% from 18 to 24, 28.00% from 25 to 44, 25.90% from 45 to 64, and 15.80% who were 65 years of age or older. The median age was 40 years. For every 100 females there were 97.10 males. For every 100 females age 18 and over, there were 93.50 males.
The median household income was $40,938 and the median family income was $48,516. Males had a median income of $32,185 versus $24,615 for females. The per capita income for the county was $21,319. About 5.20% of families and 8.50% of the population were below the poverty line, including 9.50% of those under age 18 and 8.80% of those age 65 or over.
2010 census
As of the 2010 United States Census, there were 43,742 people, 18,126 households, and 12,025 families living in the county.[10] The population density was 81.4 inhabitants per square mile (31.4/km2). There were 22,341 housing units at an average density of 41.6 per square mile (16.1/km2).[11] The racial makeup of the county was 97.0% white, 0.6% Asian, 0.4% black or African American, 0.3% American Indian, 0.3% from other races, and 1.4% from two or more races. Those of Hispanic or Latino origin made up 1.1% of the population.[10] In terms of ancestry, 23.9% were English, 16.3% were Irish, 9.2% were German, 7.1% were Italian, 6.0% were French Canadian, 5.2% were Scottish, 5.1% were Polish, and 4.4% were American.[12]
Of the 18,126 households, 28.5% had children under the age of 18 living with them, 51.3% were married couples living together, 9.9% had a female householder with no husband present, 33.7% were non-families, and 26.1% of all households were made up of individuals. The average household size was 2.37 and the average family size was 2.82. The median age was 43.9 years.[10]
The median income for a household in the county was $50,689 and the median income for a family was $61,959. Males had a median income of $44,408 versus $34,233 for females. The per capita income for the county was $26,322. About 7.5% of families and 10.0% of the population were below the poverty line, including 12.6% of those under age 18 and 7.9% of those age 65 or over.[13]
Politics and government
| Year | Republican | Democratic | Third parties |
|---|---|---|---|
| 2016 | 47.6% 10,796 | 45.0% 10,210 | 7.4% 1,677 |
| 2012 | 42.5% 9,269 | 55.7% 12,166 | 1.8% 402 |
| 2008 | 40.3% 9,169 | 58.2% 13,249 | 1.5% 336 |
| 2004 | 46.5% 10,142 | 52.4% 11,434 | 1.1% 228 |
| 2000 | 49.8% 9,304 | 44.1% 8,224 | 6.1% 1,140 |
| 1996 | 39.5% 6,824 | 48.6% 8,380 | 11.9% 2,056 |
| 1992 | 35.5% 6,318 | 44.5% 7,921 | 20.0% 3,560 |
| 1988 | 57.8% 8,836 | 41.7% 6,378 | 0.5% 69 |
| 1984 | 64.8% 9,220 | 34.9% 4,962 | 0.4% 57 |
| 1980 | 52.9% 7,472 | 34.6% 4,889 | 12.6% 1,776 |
| 1976 | 50.6% 6,679 | 47.9% 6,323 | 1.6% 205 |
| 1972 | 58.1% 7,901 | 40.9% 5,554 | 1.0% 137 |
| 1968 | 49.4% 6,094 | 47.2% 5,817 | 3.4% 417 |
| 1964 | 31.2% 3,975 | 68.9% 8,787 | |
| 1960 | 52.3% 7,105 | 47.7% 6,469 | |
| 1956 | 66.4% 8,403 | 33.5% 4,239 | 0.0% 5 |
| 1952 | 63.7% 8,317 | 36.3% 4,743 | |
| 1948 | 55.5% 6,003 | 43.4% 4,696 | 1.1% 119 |
| 1944 | 49.8% 5,935 | 50.1% 5,972 | 0.1% 6 |
| 1940 | 48.7% 5,583 | 51.3% 5,872 | |
| 1936 | 50.7% 5,347 | 48.5% 5,113 | 0.7% 78 |
| 1932 | 53.8% 5,153 | 45.6% 4,368 | 0.6% 58 |
| 1928 | 61.6% 5,754 | 38.0% 3,549 | 0.5% 43 |
| 1924 | 68.0% 5,187 | 29.7% 2,268 | 2.2% 170 |
| 1920 | 64.4% 4,647 | 34.9% 2,521 | 0.8% 54 |
| 1916 | 49.3% 2,193 | 49.8% 2,215 | 0.9% 38 |
| 1912 | 38.9% 1,677 | 35.3% 1,523 | 25.9% 1,117 |
| 1908 | 63.2% 2,758 | 33.7% 1,469 | 3.1% 136 |
| 1904 | 64.2% 2,774 | 33.5% 1,447 | 2.3% 99 |
| 1900 | 61.4% 2,559 | 36.9% 1,538 | 1.7% 69 |
| 1896 | 71.5% 2,750 | 22.5% 865 | 6.1% 234 |
| 1892 | 53.8% 2,434 | 44.7% 2,021 | 1.5% 66 |
| 1888 | 55.0% 2,588 | 43.3% 2,040 | 1.7% 82 |
| 1884 | 54.0% 2,477 | 44.2% 2,031 | 1.8% 83 |
| 1880 | 55.5% 2,729 | 44.2% 2,175 | 0.4% 17 |
| 1876 | 54.9% 2,568 | 45.0% 2,106 | 0.1% 3 |
County Commission
The executive power of Sullivan County's government is held by three county commissioners, each representing one of the three commissioner districts within the county.[15]
| Districts | Name | Hometown | Party |
|---|---|---|---|
| District 1 | Jeffrey Barrette (Chair) | Claremont, NH | Democratic |
| District 2 | Bennie Nelson (Vice Chair) | Grantham, NH | Republican |
| District 3 | George Hebert (Clerk) | Goshen, NH | Republican |
In addition to the County Commission, there are five directly-elected officials: they include County Attorney, Register of Deeds, County Sheriff, Register of Probate, and County Treasurer.[16]
| Office | Name |
|---|---|
| County Attorney | Marc Hathaway (R) |
| Register of Deeds | Janet Gibson (R) |
| County Sheriff | John Simonds (R) |
| Register of Probate | Raymond Gagnon (D) |
| County Treasurer | Michael Sanderson (R) |
Legislative branch
The legislative branch of Sullivan County is made up of all of the members of the New Hampshire House of Representatives from the county. In total, as of August 2018 there are 13 members from 11 different districts.
| Affiliation | Members | Voting share | |
|---|---|---|---|
| Democratic Party | 6 | 46.1% | |
| Republican Party | 7 | 53.9% | |
| Total | 13 | 100% | |
Communities
City
Towns
Census-designated places
Other populated places
Geographical features
Mountains
County services
The Sullivan County Department of Corrections operates the county prison in the town of Unity.
References
- "State & County QuickFacts". United States Census Bureau. Retrieved September 24, 2013.
- "Find a County". National Association of Counties. Retrieved June 7, 2011.
- "2010 Census Gazetteer Files". United States Census Bureau. August 22, 2012. Archived from the original on December 27, 2014. Retrieved December 27, 2014.
- "Population and Housing Unit Estimates". Retrieved May 16, 2019.
- "U.S. Decennial Census". United States Census Bureau. Retrieved December 27, 2014.
- "Historical Census Browser". University of Virginia Library. Retrieved December 27, 2014.
- "Population of Counties by Decennial Census: 1900 to 1990". United States Census Bureau. Retrieved December 27, 2014.
- "Census 2000 PHC-T-4. Ranking Tables for Counties: 1990 and 2000" (PDF). United States Census Bureau. Retrieved December 27, 2014.
- "U.S. Census website". United States Census Bureau. Retrieved January 31, 2008.
- "DP-1 Profile of General Population and Housing Characteristics: 2010 Demographic Profile Data". United States Census Bureau. Archived from the original on February 13, 2020. Retrieved January 12, 2016.
- "Population, Housing Units, Area, and Density: 2010 - County". United States Census Bureau. Archived from the original on February 13, 2020. Retrieved January 12, 2016.
- "DP02 SELECTED SOCIAL CHARACTERISTICS IN THE UNITED STATES – 2006-2010 American Community Survey 5-Year Estimates". United States Census Bureau. Archived from the original on February 13, 2020. Retrieved January 12, 2016.
- "DP03 SELECTED ECONOMIC CHARACTERISTICS – 2006-2010 American Community Survey 5-Year Estimates". United States Census Bureau. Archived from the original on February 13, 2020. Retrieved January 12, 2016.
- Leip, David. "Dave Leip's Atlas of U.S. Presidential Elections". uselectionatlas.org. Retrieved 2018-06-09.
- http://sos.nh.gov/2016CountyGen.aspx?id=8589963692
- http://sullivancountynh.gov/index.php?n=elected_officials
External links
- Sullivan County official website
- Sullivan County, NH, Court Records, 1819-1859 at Dartmouth College Library
Places adjacent to Sullivan County, New Hampshire | ||||||||||
|---|---|---|---|---|---|---|---|---|---|---|
| ||||||||||
Municipalities and communities of Sullivan County, New Hampshire, United States | ||
|---|---|---|
| City | Map of New Hampshire highlighting Sullivan County | |
| Towns | ||
| CDPs | ||
| Other villages | ||
| Authority control |
|
|---|