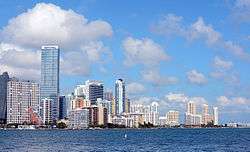
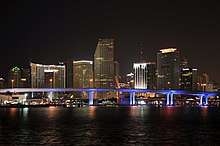
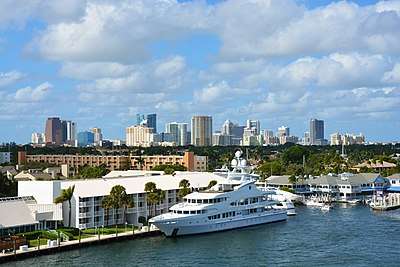
Miami metropolitan area
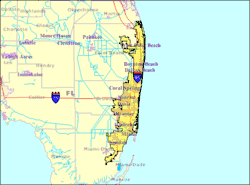
The Miami metropolitan area, also known as the Greater Miami Area or South Florida, is the 72nd largest metropolitan area in the world and the seventh-largest metropolitan area in the United States. Located in southeastern Florida with 6,198,782 inhabitants as of 2018, the Miami metropolitan area is the most populous in Florida and second largest in the southeastern United States.[2][3][4][5] It extends about 120 miles (190 km) from north to south.
Miami metropolitan area | |
|---|---|
| Miami–Fort Lauderdale–West Palm Beach | |
 | |
| Coordinates: 26°8′N 80°12′W | |
| Country | United States |
| State(s) | Florida |
| Largest city | Miami |
| Other cities | - Hialeah - Fort Lauderdale - Pembroke Pines - Hollywood - Miramar - Coral Springs - Miami Gardens - Pompano Beach - West Palm Beach - Davie - Boca Raton - Sunrise - Plantation - Miami Beach - Deerfield Beach - Boynton Beach - Lauderhill - Weston - Parkland |
| Area | |
| • Total | 6,137 sq mi (15,890 km2) |
| Highest elevation | Jupiter, Florida 53 ft (16.2 m) |
| Lowest elevation | Atlantic Ocean 0 ft (0 m) |
| Population | |
| • Total | 6,198,782 [1] |
| • Rank | 7th in the U.S. |
| • Density | 1,004/sq mi (373/km2) |
The metropolitan area is defined by the Office of Management and Budget as the Miami–Fort Lauderdale–West Palm Beach, FL (MSA), consisting of Miami-Dade, Broward, and Palm Beach counties, a metropolitan statistical area used for statistical purposes by the United States Census Bureau and other agencies.[6] Its land area is 6,137 sq. mi (15,890 km2).
Miami-Dade, Broward, and Palm Beach counties are the first, second, and third most populous counties in Florida, and Miami-Dade, with 2,761,581 people in 2018, is the seventh most populous county in the United States. The three counties together are known as the Greater Miami Area and have principal cities including Miami, Fort Lauderdale, West Palm Beach, Hialeah, Pembroke Pines, Hollywood, and Boca Raton. Besides its association with the South Florida region, which includes the Everglades and the Florida Keys, it is also synonymous with an area known collectively as the "Gold Coast".
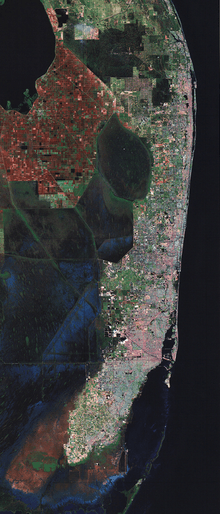
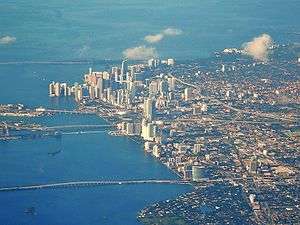
Because the population of South Florida is largely confined to a strip of land between the Atlantic Ocean and the Everglades, the Miami urbanized area (that is, the area of contiguous urban development) is about 100 miles (160 km) long (north to south), but never more than 20 miles (32 km) wide, and in some areas only 5 miles (8.0 km) wide (east to west). The Miami metropolitan statistical area is longer than any other urbanized area in the United States except for the New York metropolitan area.[7] It was the eighth most densely populated urbanized area in the United States in the 2000 census.[8]
As of the 2000 census, the urbanized area had a land area of 1,116 square miles (2,890 km2), with a population of 4,919,036, for a population density of 4,407.4 per square mile (1,701.7 per square kilometer). Miami and Hialeah (the second largest city in the metropolitan area) had population densities of more than 10,000 per square mile (more than 3,800 per square kilometer).[9][10] The Miami Urbanized Area was the fourth largest urbanized area in the United States in the 2010 census.
The Miami metropolitan area also includes several urban clusters (UCs) as of the 2000 Census which are not part of the Miami Urbanized Area. These are the Belle Glade UC, population 24,218, area 20,717,433 square meters and population density of 3027.6 per square mile; Key Biscayne UC, population 10,513, area 4,924,214 square meters and population density of 5529.5 per square mile; Redland UC, population 3,936, area 10,586,212 square meters and population density of 963.0 per square mile; and West Jupiter UC, population 8,998, area 24,737,176 square meters and population density of 942.1 per square mile.[11]
Metropolitan divisions
The Miami metropolitan area consists of three distinct metropolitan divisions, subdividing the region into three divisions according to the region's three counties: Miami-Dade County, Broward County, and Palm Beach County.
| Miami metropolitan area divisions[12] | 2000 Population |
2010 Population |
2018 Population |
% change (2010 to 2018) |
|---|---|---|---|---|
| Miami—Miami Beach—Kendall (Miami-Dade County) | 2,253,362 | 2,496,435 | 2,761,581 | +10.62% |
| Fort Lauderdale—Pompano Beach—Deerfield Beach (Broward County) | 1,623,018 | 1,748,066 | 1,951,260 | +11.62% |
| West Palm Beach—Boca Raton—Delray Beach (Palm Beach County) | 1,131,184 | 1,320,134 | 1,485,941 | +12.56% |
| 5,007,564 | 5,564,635 | 6,198,782 | +11.40% |
Cities
Largest cities
The following is a list of the twenty largest cities in the Miami metropolitan area as ranked by population.[13][14][15]
| Rank | City | County | 2000 population |
2010 population |
2018 population |
2010 to 2018 % change |
|---|---|---|---|---|---|---|
| 1 | Miami | Miami-Dade | 362,470 | 399,457 | 470,914 | +17.89% |
| 2 | Hialeah | Miami-Dade | 226,419 | 224,669 | 238,942 | +6.35% |
| 3 | Fort Lauderdale | Broward | 152,397 | 165,521 | 182,595 | +10.32% |
| 4 | Pembroke Pines | Broward | 137,427 | 154,750 | 172,374 | +11.39% |
| 5 | Hollywood | Broward | 139,357 | 140,768 | 154,823 | +9.98% |
| 6 | Miramar | Broward | 72,739 | 122,041 | 140,823 | +15.39% |
| 7 | Coral Springs | Broward | 117,549 | 121,096 | 133,507 | +10.25% |
| 8 | Miami Gardens | Miami-Dade | 100,758 | 107,167 | 113,069 | +5.51% |
| 9 | Pompano Beach | Broward | 78,191 | 99,845 | 111,954 | +12.13% |
| 10 | West Palm Beach | Palm Beach | 82,103 | 99,919 | 111,398 | +11.49% |
| 11 | Davie | Broward | 75,720 | 91,922 | 106,558 | +15.92% |
| 12 | Boca Raton | Palm Beach | 74,764 | 84,392 | 99,244 | +17.60% |
| 13 | Sunrise | Broward | 85,779 | 84,439 | 95,458 | +13.05% |
| 14 | Plantation | Broward | 82,934 | 84,955 | 94,288 | +10.99% |
| 15 | Miami Beach | Miami-Dade | 87,933 | 87,779 | 91,718 | +4.49% |
| 16 | Deerfield Beach | Broward | 64,583 | 75,018 | 80,863 | +7.79% |
| 17 | Boynton Beach | Palm Beach | 60,389 | 68,217 | 78,050 | +14.41% |
| 18 | Lauderhill | Broward | 57,585 | 66,887 | 72,094 | +7.78% |
| 19 | Weston | Broward | 49,251 | 65,333 | 71,210 | +9.00% |
| 20 | Homestead | Miami-Dade | 31,909 | 60,512 | 70,477 | +16.47% |
Areas with between 10,000 and 100,000 inhabitants
- Aventura
- Belle Glade
- Boca Del Mar
- Boca Raton
- Boynton Beach
- Brownsville
- Coconut Creek
- Cooper City
- Coral Gables
- Coral Terrace
- Country Club
- Country Walk
- Cutler Bay
- Dania Beach
- Deerfield Beach
- Delray Beach
- Doral
- Florida City
- Fontainebleau
- Gladeview
- Glenvar Heights
- Goulds
- Greenacres
- Hallandale Beach
- Hamptons at Boca Raton
- Hialeah Gardens
- Homestead
- Ives Estates
- Jupiter
- Kendale Lakes
- Kendall West
- Kendall
- Key Biscayne
- Kings Point
- Lake Worth Corridor
- Lake Worth Beach
- Lauderdale Lakes
- Lauderhill
- Leisure City
- Lighthouse Point
- Margate
- Miami Beach
- Miami Lakes
- Miami Shores
- Miami Springs
- North Lauderdale
- North Miami Beach
- North Miami
- North Palm Beach
- Oakland Park
- Ojus
- Olympia Heights
- Opa-locka
- Palm Beach Gardens
- Palm Beach
- Palm Springs
- Palmetto Bay
- Palmetto Estates
- Parkland
- Pinecrest
- Pinewood
- Plantation
- Princeton
- Richmond West
- Riviera Beach
- Royal Palm Beach
- Sandalfoot Cove
- South Miami Heights
- South Miami
- Sunny Isles Beach
- Sunrise
- Sunset
- Sweetwater
- Tamarac
- Tamiami
- The Crossings
- The Hammocks
- University Park
- Wellington
- West Little River
- West Park
- Westchester
- Weston
- Westwood Lakes
- Wilton Manors
Areas with fewer than 10,000 inhabitants
- Atlantis
- Bal Harbour
- Bay Harbor Islands
- Belle Glade Camp
- Biscayne Park
- Boca Pointe
- Boulevard Gardens
- Briny Breezes
- Broadview Park
- Canal Point
- Century Village
- Cypress Lakes
- Dunes Road
- El Portal
- Fisher Island
- Franklin Park
- Fremd Village-Padgett Island
- Glen Ridge
- Godfrey Road
- Golden Beach
- Golden Lakes
- Golf
- Gulf Stream
- Gun Club Estates
- Haverhill
- High Point
- Highland Beach
- Hillsboro Beach
- Hillsboro Pines
- Homestead Base
- Hypoluxo
- Indian Creek
- Islandia
- Juno Beach
- Juno Ridge
- Jupiter Inlet Colony
- Lake Belvedere Estates
- Lake Clarke Shores
- Lake Harbor
- Lake Park
- Lakeside Green
- Lantana
- Lauderdale-by-the-Sea
- Lazy Lake
- Limestone Creek
- Manalapan
- Mangonia Park
- Medley
- Mission Bay
- Naranja
- North Bay Village
- Ocean Ridge
- Pahokee
- Palm Beach Shores
- Palm Springs North
- Pembroke Park
- Plantation Mobile Home Park
- Richmond Heights
- Roosevelt Gardens
- Royal Palm Estates
- Schall Circle
- Sea Ranch Lakes
- Seminole Manor
- South Bay
- South Palm Beach
- Southwest Ranches
- Stacy Street
- Surfside
- Tequesta
- Three Lakes
- Villages of Oriole
- Virginia Gardens
- Washington Park
- Westlake
- West Miami
- West Perrine
- Westview
- Whisper Walk
Demographics
Population
| Historical population | |||
|---|---|---|---|
| Census | Pop. | %± | |
| 1900 | 4,955 | — | |
| 1910 | 17,510 | 253.4% | |
| 1920 | 66,542 | 280.0% | |
| 1930 | 214,830 | 222.8% | |
| 1940 | 387,522 | 80.4% | |
| 1950 | 693,705 | 79.0% | |
| 1960 | 1,497,099 | 115.8% | |
| 1970 | 2,236,645 | 49.4% | |
| 1980 | 3,220,844 | 44.0% | |
| 1990 | 4,056,100 | 25.9% | |
| 2000 | 5,007,564 | 23.5% | |
| 2010 | 5,564,635 | 11.1% | |
| Est. 2019[16] | 6,166,488 | 10.8% | |
The Miami area is a diverse community with a large proportion of foreign-born residents, in large part due to its proximity to Latin America and the Caribbean.
Another factor is residents who were formerly snowbirds from the Northeast and, to a lesser extent, countries such as Canada.
Politically speaking, the region is heavily Democratic. Broward County is the second most reliably Democratic county in the state,[17][18] behind only Palm Beach County, like Broward, is largely Democratic as well, especially amongst its Jewish community,[19] while the rest of Florida tends to follow Southern politics and vote more Republican, with the exception of certain parts of Florida where Southern culture is not as influential. With a majority Hispanic population in Miami-Dade, Republican votes are mainly by older generations of Cuban Americans, most of whom defected to the United States following the Cuban Revolution, but Miami-Dade County still remains very Democratic when compared with most of Florida's other counties.[20][21][22] In the 2016 presidential election, 62.3% of voters in the Miami metropolitan area voted Democratic. This was the 6th highest of any metro area in the United States.[23]
As of the 2005 American Community Survey,[24][25] 5,334,685 people lived in the metropolis.
The Miami area has a large Jewish community; 10.2% of the population was Jewish in the 2000 Census.[26]
Population: As of the 2010 U.S. Census, there were 5,564,635 people. 2.8 million (52%) were females and 2.6 million (48%) were males. The median age was 38.6 years. 24% of the population were under 18 years and 15% were 65 years and older. There were 2,097,626 households, and 1,378,108 families residing in the Miami metropolitan area.
Ethnicity:
The racial makeup of the population of the Miami area [6,066,387] as of 2016:[27]
- White: 70.3% [4,263,038]
- White Hispanic: 39.2% [2,375,219]
- White Non-Hispanic: 31.1% [1,887,819]
- Black or African American: 21.2% [1,288,585]
- Native American: 0.2% [12,487]
- Asian: 2.5% [151,537]
- Pacific Islander: 0.1% [3,527]
- Other races: 3.5% [214,451]
- Two or more races:2.2% [132,762]
- Hispanic or Latino (of any race) were 44.2% [2,693,672] of the population[28][29]
Language and national origin
National origin and language: Of the people living in the Miami metro area in 2005, 63% were born in the United States (including 30% who were born in Florida) and 37% were foreign born. Among people at least five years old living in the region in 2005, 52% spoke English at home while 48% spoke some other language at home. Of those speaking a language other than English at home, 78% spoke Spanish and 22% spoke some other language (mainly Haitian Creole, but also French, German, Hebrew, Italian, Portuguese, Russian or Yiddish).
Geographic mobility: In 2005, 83% of the people at least one year old living in the Miami metro area were living in the same residence one year earlier; 12% had moved during the past year from another residence in the same county, 2% from another county in the same state, 2% from another state, and 1% from abroad.
Households and families: There were 2,338,450 households, The average household size was 2.6 people. Families made up 65% of the households in the Miami area. This figure includes both married-couple families (45%) and other families (20%). Nonfamily households made up 35% of all households in Miami. Most of the nonfamily households were people living alone, but some consisted of people living in households in which no one was related to the householder.
Miami dialect
In Miami-Dade County and Broward County and areas nearby, a unique dialect, commonly called the "Miami dialect", is widely spoken. The dialect developed among second- or third-generation Hispanics, including Cuban-Americans, whose first language was English (though some non-Hispanic white, black, and other races who were born and raised in Miami-Dade tend to adopt it as well.)[30] It is based on a fairly standard American accent but with some changes very similar to dialects in the Mid-Atlantic (especially the New York area dialect, Northern New Jersey English, and New York Latino English.) Unlike Virginia Piedmont, Coastal Southern American, and Northeast American dialects and Florida Cracker dialect (see section below), "Miami accent" is rhotic; it also incorporates a rhythm and pronunciation heavily influenced by Spanish (wherein rhythm is syllable-timed).[31] However, this is a native dialect of English, not learner English or interlanguage; it is possible to differentiate this variety from an interlanguage spoken by second-language speakers in that "Miami accent" does not generally display the following features: there is no addition of /ɛ/ before initial consonant clusters with /s/, speakers do not confuse of /dʒ/ with /j/, (e.g., Yale with jail), and /r/ and /rr/ are pronounced as alveolar approximant [ɹ] instead of alveolar tap [ɾ] or alveolar trill [r] in Spanish.[32][33][34][35]
Education
Education: In 2005, 83% of people 25 years and over had at least graduated from high school and 30% had a bachelor's degree or higher. Among people 16 to 19 years old, 7% were dropouts; they were not enrolled in school and had not yet graduated from high school. The total school enrollment in the Miami Metro Area was 1.4 million in 2005. Nursery school and kindergarten enrollment was 170,000 and elementary or high school enrollment was 879,000 children. College or graduate school enrollment was 354,000.
Occupation, Income, and Industries
Occupations and Type of Employer: Among the most common occupations were: 32% were management, professional, and related occupations, 30% were sales and office occupations, 18% were service occupations, 11% were construction, extraction, maintenance and repair occupations, and 9% were production, transportation, and material moving occupations. 81% of the people employed were Private wage and salary workers; 12% were Federal, state, or local government workers; and 7% were Self-employed in own not incorporated business workers.
Income: The median income of households in the Miami area was $43,091. 78% of the households received earnings and 13% received retirement income other than Social Security. 30% of the households received Social Security. The average income from Social Security was $13. These income sources are not mutually exclusive; that is, some households received income from more than one source.
Industries: In 2005, for the employed population 16 years and older, the leading industries in the Miami area were Educational services, health care and social assistance, which accounted for 18%, and Professional, scientific, and management, and administrative and waste management services, which accounted for 13% of the population.
Traveling to Work: 79% of Miami area workers drove to work alone in 2005, 10% carpooled, 4% took public transportation, and 4% used other means. The remaining 3% worked at home. Among those who commuted to work, it took them on average 28.5 minutes to get to work.
Poverty and Participation in Government Programs: In 2005, 14% of people were in poverty. 19% of related children under 18 were below the poverty level, compared with 14% of people 65 years old and over. 11% of all families, and 26% of families with a female householder and no husband present had incomes below the poverty level.
Housing characteristics and costs
Changes in house prices for the area are publicly tracked on a regular basis using the Case–Shiller index; the statistic is published by Standard & Poor's and is also a component of S&P's 10-city composite index of the value of the residential real estate market.
Housing characteristics: As of 2005, the Miami area had a total of 2.3 million housing units, 13% of which were vacant. Of the total housing units, 52% were in single-unit structures, 45% were in multi-unit structures, and 3% were mobile homes. 25% of the housing units were built since 1990. As of 2019, over 70% of Miami's residents are renters with median rent of $1,355, $180 over the national average.
Occupied housing unit characteristics: In 2005, the Miami area had 2.0 million occupied housing units – 1.3 million (66%) owner occupied and 688,000 (34%) renter occupied.
Housing costs: In 2010, housing costs in the Miami area typically represented 40% of household income, compared to 34% nationwide.[36]
Property tax increase: In March 2009, Miami area lawmakers passed a 5–10% hike in property tax millage rates throughout the metropolitan area to fund the construction of new schools and to fund understaffed schools and educational institutions, resulting in an increase in residents' property tax bills beginning in the 2009 tax year.
Education
In Florida, each county is also a school district. Each district is headed by an elected school board. A professional superintendent manages the day-to-day operations of each district, who is appointed by and serves at the pleasure of the School Board.
The Miami-Dade County Public School District is currently the 4th-largest public school district in the nation. The School District of Palm Beach County is the 4th-largest in Florida and the 11th-largest in the United States. Broward County Public School District is the 6th-largest in the United States.
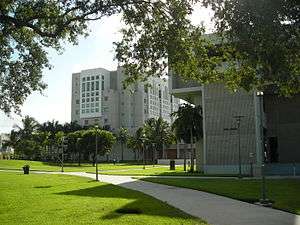
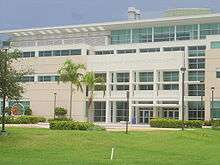
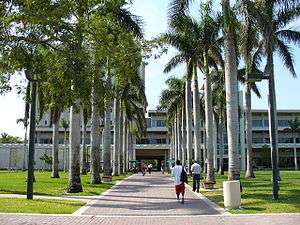
Some colleges and universities in Greater Miami include:
- Barry University (private/Catholic)
- Broward College (public)
- Carlos Albizu University (private)
- Florida Atlantic University (public)
- Florida International University (public)
- Florida Memorial University (private)
- Johnson & Wales University (private)
- Le Cordon Bleu College of Culinary Arts Miami (private)
- Lynn University (private)
- Miami Dade College (public)
- Northwood University (private)
- Nova Southeastern University (private)
- Palm Beach Atlantic University (private/Christian)
- Palm Beach State College (public)
- St. Thomas University (private/Catholic)
- University of Miami (private)
In 2005, 82% of people 25 years and over had at least graduated from high school and 28% had a bachelor's degree or higher. Among people 16 to 19 years old, 7% were dropouts; they were not enrolled in school and had not graduated from high school. The total school enrollment in the Miami metro area was 1.4 million in 2005. Nursery school and kindergarten enrollment was 170,000 and elementary or high school enrollment was 879,000. College or graduate school enrollment was 354,000.
Transportation
Roads
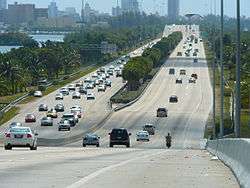
The Miami metropolitan area is served by five interstate highways operated by the Florida Department of Transportation (FDOT) in conjunction with local agencies. Interstate 95 (I-95) runs north to south along the coast, ending just south of Downtown Miami at South Dixie Highway (US 1). I-75 runs east to west, turning south in western Broward County and connecting suburban north Miami-Dade to Naples on the Southwest Coast via Alligator Alley, which transverses the Florida Everglades before turning north. I-595 connects the Broward coast and downtown Fort Lauderdale to I-75 and Alligator Alley. In Miami, I-195 and I-395 relay the main I-95 route east to Biscayne Boulevard (US 1) and Miami Beach across Biscayne Bay via the Julia Tuttle and MacArthur causeways.
In greater Miami, the Miami-Dade Expressway Authority and Florida's Turnpike Enterprise (FTE) maintain eight state expressways in conjunction with FDOT. The Airport Expressway (SR 112) and the Dolphin Expressway (SR 836) relay western Miami-Dade suburbs to the eastern urban coast at I-95, and to Miami Beach via I-195 and I-395 at the Airport and Midtown interchanges. The Gratigny Parkway (SR 924) connects northern Miami suburbs to the southern end of I-75. The Palmetto Expressway (SR 826) is the primary beltway road of urban Miami, relaying I-95 and Florida's Turnpike (SR 91) at the Golden Glades Interchange near northeastern North Miami Beach to the southern inland suburbs of Kendall and Pinecrest. The Don Shula Expressway (SR 874) and the Homestead Extension of Florida's Turnpike (SR 821) form the southernmost end of the beltway, connecting the Palmetto Expressway to the bedroom communities of Homestead and Florida City. The Snapper Creek Expressway (SR 878) relays the Don Shula Expressway to South Dixie Highway (US 1).
The urban bypass expressway in greater Fort Lauderdale is the Sawgrass Expressway (SR 869), connecting the northern Broward County coast at I-95 and Deerfield Beach to I-595 and I-75 at Alligator Alley in Sunrise.
Express lanes on I-95 start in southern Broward County and continue to Miami-Dade County. With increased presents of traffic in South Florida, it is projected that express lanes will soon be implemented in southern Palm Beach County.
Major freeways and tollways


Major airports
The metropolitan area is served by three major commercial airports. These airports combine to make the fourth largest domestic origin and destination market in the United States, after New York City, Los Angeles, and Chicago.[37]
| Airport | IATA code | County | FAA Category |
|---|---|---|---|
| Miami International Airport | MIA | Miami-Dade | Large Hub |
| Fort Lauderdale – Hollywood International Airport | FLL | Broward | Large Hub |
| Palm Beach International Airport | PBI | Palm Beach | Large Hub |
The following smaller general aviation airports are also in the metro area:
| Airport | IATA code | ICAO code | County |
|---|---|---|---|
| Dade-Collier Training and Transition Airport | TNT | KTNT | Miami-Dade |
| Miami Homestead General Aviation Airport | Miami-Dade | ||
| Homestead Joint Air Reserve Base | HST | KHST | Miami-Dade |
| Miami Executive Airport | TMB | KTMB | Miami-Dade |
| Miami-Opa Locka Executive Airport | OPF | KOPF | Miami-Dade |
| Fort Lauderdale Executive Airport | FXE | KFXE | Broward |
| North Perry Airport | HWO | KHWO | Broward |
| Pompano Beach Airpark | PPM | KPMP | Broward |
| North Palm Beach County General Aviation Airport | Palm Beach | ||
| Palm Beach County Park Airport | LNA | KLNA | Palm Beach |
Seaports
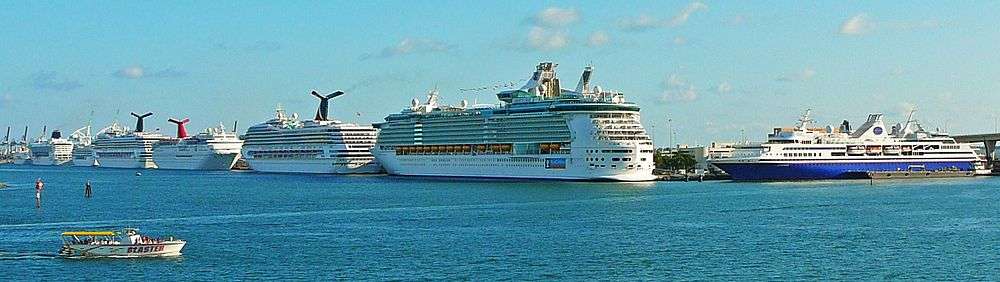
The metropolis also has four seaports, the largest and most important being the Port of Miami. Others in the area include Port Everglades, Port of Palm Beach and the Miami River Port. On August 21, 2012, PortMiami and the U.S. Army Corps of Engineers signed the Partnership Agreement (PPA) construction agreement that will allow the Deep Dredge project to go out for bid. The Deep Dredge will deepen the Port's existing channels to minus 50/52 feet to prepare for the Panama Canal expansion, now scheduled for completion in early 2015. PortMiami's deeper channel will provide ships with an economically efficient, reliable and safe navigational route into the Port. PortMiami will be the only U.S. Port south of Norfolk, Virginia to be at the minus 50 foot depth in sync with the opening of the expanded Canal. Deep Dredge is expected to create more than 30,000 direct, indirect, and induced jobs in Florida and allow the Port to meet its goal to double its cargo traffic over the next decade.
Public transportation
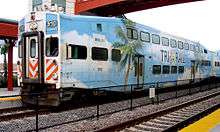

Miami-Dade Transit (MDT) is the largest public transit agency in Florida, operating rapid transit, people movers, and an intercity bus system. Metrorail is Florida's only rapid transit, currently with 23 stations on a 24.4-mile (39.3 km) track. The Downtown Miami people mover, Metromover, operates 20 stations and three lines on a 4.4-mile (7.1 km) track through the Downtown neighborhoods of the Arts & Entertainment District, the Central Business District, and Brickell. Metrobus serves the entirety of Miami-Dade County, also serving Monroe County as far south as Marathon, and Broward County as far north as downtown Fort Lauderdale. In Broward County, Broward County Transit runs public buses, as does Palm Tran in Palm Beach County. Additionally, the South Florida Regional Transportation Authority operates Tri-Rail, a commuter rail train that connects the three of the primary cities of South Florida (Miami, Fort Lauderdale, and West Palm Beach), and most intermediate points. Virgin Trains USA provides service to Miami, Aventura, West Palm Beach, Fort Lauderdale, Boca Raton, and Central Florida's Orlando, with talks to expand to Tampa and Jacksonville.[38][39]
Climate

South Florida/Miami metropolitan area has a tropical climate, the only major metropolitan area in the 48 contiguous states that falls under that category. More specifically, it generally has a tropical monsoon climate (Köppen climate classification, Am).[40] The South Florida metropolis sees most of its rain in the summer (wet season) and is quite dry in the winter (dry season). The wet season, which is hot and humid, lasts from May to October, when daily thunderstorms and passing weak tropical lows bring downpours during the late afternoon. The dry season often starts in late October and runs through late April. During the height of the dry season from February through April, south Florida is often very dry, and often brush fires and water restrictions are an issue. At times cold fronts can make it all the way down to south Florida and provide some modest rainfall in the dry season. The hurricane season largely coincides with the wet season.[41]
In addition to its sea-level elevation, coastal location and position near the Tropic of Cancer and The Caribbean , the area owes its warm, humid climate to the Gulf Stream, which moderates climate year-round. A typical summer day does not see temperatures below 75 °F (24 °C). Temperatures in the high 80s to low 90s (30–35 °C) accompanied by high humidity are often relieved by afternoon thunderstorms or a sea breeze that develops off the Atlantic Ocean, which then allow lower temperatures, although conditions still remain very muggy.
During winter, dry air often dominates as dew points are often very low. Average daily high temperatures across South Florida during the winter are around 75-77 °F. Although daily highs can sometimes reach 82-85 °F even in January and February. Daily low temperatures during the winter are generally around 55-63 °F (10–15 °C). Each winter, cold fronts occasionally make their way down to the northern Bahamas and South Florida. As a result, daily high temperatures in South Florida may only reach around 65°F. When this occurs low temperatures can dip into the 40s during the early morning hours before quickly warming-up toward late morning/early afternoon. It is rare for temperatures to drop below 40 °F (5 °C) though. South Florida only experiences these cold spells about twice each winter and they typically only last a day or two before temperatures return to the mid 70s. On average coastal South Florida is frost-free, although there can be a light frost in the inland communities a few times each decade.
Hurricane season officially runs from June 1 through November 30, although hurricanes can develop outside that period. The most likely time for South Florida to be hit is during the peak of the Cape Verde season, mid-August through the end of September.[42] Due to its location between two major bodies of water known for tropical activity, South Florida is also statistically the most likely major area to be struck by a hurricane in the world, trailed closely by Nassau, Bahamas, and Havana, Cuba. Many hurricanes have affected the metropolis, including Betsy in 1965, Andrew in 1992, Irene in 1999, Hurricanes Katrina and Wilma in 2005, and Irma in 2017. In addition, a tropical depression in October 2000 passed over the city, causing record rainfall and flooding. Locally, the storm is credited as the No Name Storm of 2000, though the depression went on to become Tropical Storm Leslie upon entering the Atlantic Ocean.
| Climate data for West Palm Beach Airport, Florida (1981–2010 normals,[43] extremes 1888–present) | |||||||||||||
|---|---|---|---|---|---|---|---|---|---|---|---|---|---|
| Month | Jan | Feb | Mar | Apr | May | Jun | Jul | Aug | Sep | Oct | Nov | Dec | Year |
| Average high °F (°C) | 75.1 (23.9) |
76.2 (24.6) |
80.0 (26.7) |
84.1 (28.9) |
87.0 (30.6) |
90.7 (32.6) |
92.0 (33.3) |
92.2 (33.4) |
88.3 (31.3) |
84.3 (29.1) |
82.3 (27.9) |
76.5 (24.7) |
84.3 (29.1) |
| Average low °F (°C) | 57.4 (14.1) |
58.5 (14.7) |
61.6 (16.4) |
65.0 (18.3) |
70.4 (21.3) |
75.0 (23.9) |
75.2 (24.0) |
75.4 (24.1) |
74.3 (23.5) |
68.8 (20.4) |
63.3 (17.4) |
60.0 (15.6) |
66.0 (18.9) |
| Average rainfall inches (mm) | 2.18 (55) |
2.09 (53) |
2.05 (52) |
2.03 (52) |
5.76 (146) |
9.02 (229) |
9.27 (235) |
9.83 (250) |
9.93 (252) |
9.57 (243) |
5.07 (129) |
2.27 (58) |
60.35 (1,533) |
| Average rainy days (≥ 0.01 in) | 7.8 | 6.7 | 5.0 | 5.8 | 14.1 | 16.0 | 18.1 | 19.0 | 16.7 | 17.1 | 10.2 | 7.1 | 132.6 |
| Source: NOAA[44][45] | |||||||||||||
| Climate data for Fort Lauderdale Int'l Airport, Florida (1981–2010 normals, extremes 1912–present) | |||||||||||||
|---|---|---|---|---|---|---|---|---|---|---|---|---|---|
| Month | Jan | Feb | Mar | Apr | May | Jun | Jul | Aug | Sep | Oct | Nov | Dec | Year |
| Average high °F (°C) | 75.5 (24.2) |
76.7 (24.8) |
78.5 (25.8) |
81.9 (27.7) |
85.6 (29.8) |
89.8 (32.1) |
91.4 (33.0) |
90.5 (32.5) |
88.8 (31.6) |
85.8 (29.9) |
81.0 (27.2) |
76.9 (24.9) |
83.3 (28.5) |
| Average low °F (°C) | 59.0 (15.0) |
60.5 (15.8) |
63.4 (17.4) |
66.9 (19.4) |
72.0 (22.2) |
74.4 (23.6) |
75.9 (24.4) |
75.8 (24.3) |
75.2 (24.0) |
71.8 (22.1) |
65.7 (18.7) |
61.3 (16.3) |
67.7 (19.8) |
| Average rainfall inches (mm) | 3.63 (92) |
2.96 (75) |
3.36 (85) |
2.89 (73) |
4.65 (118) |
10.16 (258) |
5.98 (152) |
7.44 (189) |
8.59 (218) |
6.82 (173) |
3.24 (82) |
2.46 (62) |
62.18 (1,579) |
| Average rainy days (≥ 0.01 in) | 5.0 | 6.1 | 6.9 | 5.4 | 8.8 | 15.9 | 15.9 | 15.7 | 15.8 | 10.6 | 8.1 | 8.1 | 122.3 |
| Source: [46][47][48] | |||||||||||||
Climate data for Miami (MIA), 1981−2010 normals,[lower-alpha 1] extremes 1895−present[lower-alpha 2] | |||||||||||||
|---|---|---|---|---|---|---|---|---|---|---|---|---|---|
| Month | Jan | Feb | Mar | Apr | May | Jun | Jul | Aug | Sep | Oct | Nov | Dec | Year |
| Record high °F (°C) | 88 (31) |
89 (32) |
93 (34) |
97 (36) |
98 (37) |
98 (37) |
100 (38) |
98 (37) |
97 (36) |
95 (35) |
91 (33) |
89 (32) |
100 (38) |
| Mean maximum °F (°C) | 84.3 (29.1) |
85.5 (29.7) |
87.9 (31.1) |
90.2 (32.3) |
92.3 (33.5) |
94.0 (34.4) |
94.6 (34.8) |
95.0 (35.0) |
93.1 (33.9) |
90.7 (32.6) |
86.9 (30.5) |
84.8 (29.3) |
96.1 (35.6) |
| Average high °F (°C) | 76.4 (24.7) |
78.1 (25.6) |
80.3 (26.8) |
83.2 (28.4) |
87.0 (30.6) |
89.5 (31.9) |
90.9 (32.7) |
91.0 (32.8) |
89.3 (31.8) |
86.2 (30.1) |
81.7 (27.6) |
77.9 (25.5) |
84.3 (29.1) |
| Daily mean °F (°C) | 68.2 (20.1) |
70.2 (21.2) |
72.6 (22.6) |
75.8 (24.3) |
79.9 (26.6) |
82.7 (28.2) |
84.1 (28.9) |
84.2 (29.0) |
82.9 (28.3) |
79.9 (26.6) |
74.9 (23.8) |
70.5 (21.4) |
77.2 (25.1) |
| Average low °F (°C) | 59.9 (15.5) |
62.3 (16.8) |
64.9 (18.3) |
68.3 (20.2) |
72.9 (22.7) |
76.0 (24.4) |
77.3 (25.2) |
77.4 (25.2) |
76.5 (24.7) |
73.5 (23.1) |
68.1 (20.1) |
63.0 (17.2) |
70.0 (21.1) |
| Mean minimum °F (°C) | 43.1 (6.2) |
46.6 (8.1) |
50.6 (10.3) |
57.3 (14.1) |
65.3 (18.5) |
70.7 (21.5) |
72.3 (22.4) |
72.3 (22.4) |
72.1 (22.3) |
63.8 (17.7) |
54.9 (12.7) |
46.3 (7.9) |
40.1 (4.5) |
| Record low °F (°C) | 28 (−2) |
27 (−3) |
32 (0) |
39 (4) |
50 (10) |
60 (16) |
66 (19) |
67 (19) |
62 (17) |
45 (7) |
36 (2) |
30 (−1) |
27 (−3) |
| Average rainfall inches (mm) | 1.62 (41) |
2.25 (57) |
3.00 (76) |
3.14 (80) |
5.34 (136) |
9.67 (246) |
6.50 (165) |
8.88 (226) |
9.86 (250) |
6.33 (161) |
3.27 (83) |
2.04 (52) |
61.90 (1,572) |
| Average rainy days (≥ 0.01 in) | 6.9 | 6.5 | 7.0 | 6.4 | 10.0 | 16.4 | 16.9 | 18.9 | 17.9 | 12.7 | 8.4 | 7.2 | 135.2 |
| Average relative humidity (%) | 72.7 | 70.9 | 69.5 | 67.3 | 71.6 | 76.2 | 74.8 | 76.2 | 77.8 | 74.9 | 73.8 | 72.5 | 73.2 |
| Mean monthly sunshine hours | 219.8 | 216.9 | 277.2 | 293.8 | 301.3 | 288.7 | 308.7 | 288.3 | 262.2 | 260.2 | 220.8 | 216.1 | 3,154 |
| Percent possible sunshine | 66 | 69 | 75 | 77 | 72 | 70 | 73 | 71 | 71 | 73 | 68 | 66 | 71 |
| Source: NOAA (relative humidity and sun 1961–1990),[49][50][51] The Weather Channel[52] | |||||||||||||
| Climate data for Miami Beach, 1981−2010 normals | |||||||||||||
|---|---|---|---|---|---|---|---|---|---|---|---|---|---|
| Month | Jan | Feb | Mar | Apr | May | Jun | Jul | Aug | Sep | Oct | Nov | Dec | Year |
| Average high °F (°C) | 73.8 (23.2) |
74.9 (23.8) |
76.3 (24.6) |
79.4 (26.3) |
82.8 (28.2) |
86.5 (30.3) |
88.1 (31.2) |
88.5 (31.4) |
87.0 (30.6) |
83.7 (28.7) |
79.3 (26.3) |
75.7 (24.3) |
81.3 (27.4) |
| Average low °F (°C) | 61.4 (16.3) |
63.0 (17.2) |
65.3 (18.5) |
69.2 (20.7) |
73.9 (23.3) |
77.0 (25.0) |
78.3 (25.7) |
78.6 (25.9) |
77.7 (25.4) |
74.7 (23.7) |
69.5 (20.8) |
64.3 (17.9) |
71.1 (21.7) |
| Average rainfall inches (mm) | 2.09 (53) |
2.33 (59) |
3.00 (76) |
3.20 (81) |
4.98 (126) |
8.27 (210) |
4.35 (110) |
6.37 (162) |
7.88 (200) |
4.47 (114) |
2.74 (70) |
2.05 (52) |
51.73 (1,313) |
| Average rainy days (≥ 0.01 in) | 6.7 | 6.0 | 6.9 | 6.0 | 8.9 | 14.5 | 12.1 | 14.0 | 14.9 | 11.2 | 8.1 | 6.9 | 116.2 |
| Source: NOAA (extremes 1927−present)[49] | |||||||||||||
Area codes
- 305 and 786 Miami-Dade County and Florida Keys
- 954 and 754 Broward County
- 561 Palm Beach County
Sports
The Miami metro area is home to all five Major leagues:
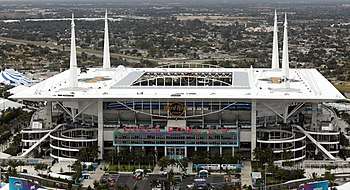
- The Miami Dolphins of the National Football League play at Hard Rock Stadium in Miami Gardens.
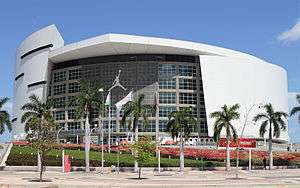
- The Miami Heat of the National Basketball Association play at American Airlines Arena in Downtown Miami.
- The Miami Marlins of Major League Baseball play at Marlins Park in Little Havana.
- The Florida Panthers of the National Hockey League play at BB&T Center in Sunrise.
- Inter Miami CF of Major League Soccer will play their first two seasons at Inter Miami CF Stadium.
The Miami area is also host to minor league sports, college sports, and other sports:
- The Miami Marlins and St. Louis Cardinals conduct spring training in Jupiter at Roger Dean Stadium.
- The Houston Astros and Washington Nationals conduct spring training in West Palm Beach at FITTEAM Ballpark of the Palm Beaches.[53][54][55]
- Inter Miami CF will have a reserve team that will play in USL League One.
- The college sports teams of Barry University, Florida Atlantic University, Florida International University, Nova Southeastern University and University of Miami.
- The Homestead-Miami Speedway oval has hosted NASCAR Cup Series and IndyCar Series events. Temporary street circuits at Museum Park hosted several CART, IMSA GT, and American Le Mans Series races between from 1986-1995, as well as a Formula E race in 2015. The Palm Beach International Raceway is a minor road course.
| Club | Sport | League | Venue (Capacity) | Attendance | League Championships |
|---|---|---|---|---|---|
| Miami Dolphins | Football | National Football League | Hard Rock Stadium (64,767) | 70,035 | Super Bowl (2) — 1972, 1973 |
| Miami Hurricanes | Football | NCAA D-I (ACC) | Hard Rock Stadium (64,767) | 53,837 | National titles (5) — 1983, 1987, 1989, 1991, 2001 |
| Miami Marlins | Baseball | Major League Baseball | Marlins Park (36,742) | 21,386 | World Series (2) — 1997, 2003 |
| Miami Heat | Basketball | National Basketball Association | American Airlines Arena (19,600) | 19,710 | NBA Finals (3) — 2006, 2012, 2013 |
| Inter Miami CF | Soccer | Major League Soccer | Inter Miami CF Stadium (18,000) | MLS Cup - None | |
| FIU Panthers | Football | NCAA D-I (Conference USA) | FIU Stadium (23,500) | 15,453 | None |
| Florida Panthers | Hockey | National Hockey League | BB&T Center (19,250) | 10,250 | None |
| FAU Owls | Football | NCAA D-1 (Conference USA) | FAU Stadium (29,419) | 18,948 | None |
.jpg) Marlins Park, home of the Miami Marlins of the MLB
Marlins Park, home of the Miami Marlins of the MLB BB&T Center, home of the Florida Panthers
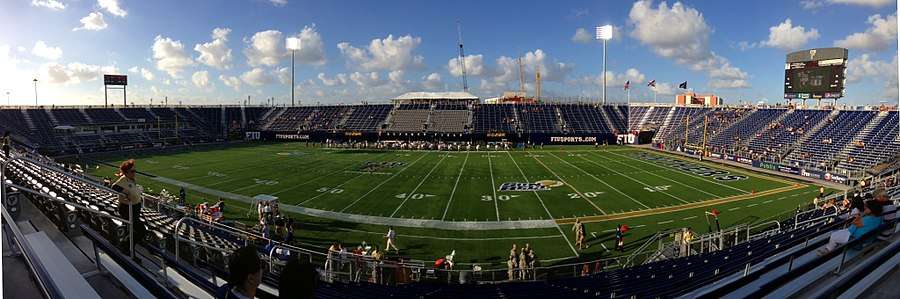 Riccardo Silva Stadium, home of the FIU Panthers
 FAU Stadium, home of the FAU Owls
Government
The metropolitan area is governed by 3 counties. In total there are 107 municipalities or incorporated places in the metropolis. Each one of the municipalities has its own city, town or village government, although there is no distinction between the 3 names. Much of the land in the metropolis is unincorporated, which means it does not belong to any municipality, and therefore is governed directly by the county it is located in.
Congressional districts
The Miami metropolitan area contains all or part of nine Congressional districts: the 18th, 20th, 21st, 22nd, 23rd, 24th, 25th, 26th, and 27th districts.[56] As of 2017 (the 113th Congress), the Cook Partisan Voting Index listed four as being Republican-leaning: the 18th, 25th, 26th, and 27th, with the 25th being the most Republican-leaning at R+5, and five as being Democratic-leaning: the 20th, 21st, 22nd, 23rd, and 24th, with the 24th being the most Democratic-leaning at D+34, making it the ninth-most Democratic-leaning district in the nation.[57]
Media
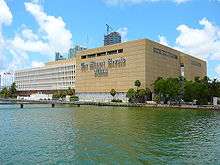
Greater Miami is served by several English-language and two major Spanish-language daily newspapers. The Miami Herald, headquartered in Doral, is Miami's primary newspaper with over a million readers. It also has news bureaus in Broward County, Monroe County, and Nassau, Bahamas. The South Florida Sun-Sentinel circulates primarily in Broward and southern Palm Beach counties and also has a news bureau in Havana, Cuba. The Palm Beach Post serves mainly Palm Beach County, especially the central and northern regions, and the Treasure Coast. The Boca Raton News publishes five days a week and circulates in southern Palm Beach County.[58] El Nuevo Herald, a subsidiary of the Miami Herald, and Diario Las Americas,[59] are Spanish-language daily papers that circulate mainly in Miami-Dade County. La Palma and El Sentinel are weekly Spanish newspapers published by the Palm Beach Post and Sun-Sentinel, respectively, and circulate in the same areas as their English-language counterparts.
Greater Miami is split into two separate television/radio markets: The Miami-Fort Lauderdale market serves Miami-Dade, Broward and the Florida Keys. The West Palm Beach market serves Palm Beach County and the Treasure Coast region.
Miami-Fort Lauderdale is the 12th largest radio market and the 16th-largest television market in the U.S. television stations serving the Miami-Fort Lauderdale area include WAMI-TV (UniMas), WBFS-TV (MyNetworkTV), WSFL-TV (The CW), WFOR-TV (CBS), WHFT-TV (TBN), WLTV (Univision), WPLG (ABC), WPXM (ION), WSCV (Telemundo), WSVN (FOX), WTVJ (NBC), WLRN-TV (PBS), and WPBT (also PBS), the latter television station being the only channel to serve the entire metropolitan area.
In addition to the Miami-Fort Lauderdale market, West Palm Beach has its own. It is the 49th largest radio market and the 38th-largest television market in the U.S. Television stations serving the West Palm Beach area include WPTV (NBC), WPEC (CBS), WPBF (ABC), WFLX (FOX), WTVX (The CW), WXEL (PBS), WTCN (MyNetworkTV), and WPXP (ION). The West Palm Beach market shares use of WSCV and WLTV for Telemundo and Univision respectively. Also, both markets cross over and tend to be available interchangeably between both areas. In 2015, WPBT and WXEL merged their operations, to form South Florida PBS, although both stations have maintained separate programming schedules and social media platforms, but share the same subchannel lineup.
See also
- South Florida
- United States metropolitan area
- Table of United States Metropolitan Statistical Areas
Notes
- Mean monthly maxima and minima (i.e. the highest and lowest temperature readings during an entire month or year) calculated based on data at said location from 1981 to 2010.
- Official records for Miami were kept at the Lemon City from September 1895 to November 1900, the Miami COOP from December 1900 to May 1911, the Weather Bureau Office from June 1911 to February 1937, at various locations in and around the city from March 1937 to July 1942, and at Miami Int'l since August 1942. For more information, see ThreadEx.
References
- "U.S. Census Bureau QuickFacts: Miami-Dade County, Florida; Broward County, Florida; Palm Beach County, Florida".
- Williams, Darlene F. (2005). "Proposed Metropolitan Area Definitions for FY2006 Income Limits and Estimates of Median Family Income". Federal Register: 74988–74993. Retrieved January 12, 2011.
- John Mark Ockerbloom (January 1, 2011). "Miami Metropolitan Area (Fla.)". The Online Books Page. University of Pennsylvania. Retrieved January 12, 2011.
- "CONSUMER EXPENDITURES FOR THE MIAMI AREA: 2008–09" (PDF). News Release. United States Department of Labor (Bureau of Labor Statistics). October 28, 2010. Retrieved January 12, 2011.
- "Journey-To-Work Trends in the United States and its Major Metropolitan Areas 1960–1990". Research and Innovative Technology Administration National Transportation Library. Federal Highway Administration. June 2003. Retrieved January 12, 2011.
- "Current Lists of Metropolitan and Micropolitan Statistical Areas and Definitions". United States Census Bureau. Retrieved March 3, 2017.
- PDFMiami-Fort Lauderdale-West Palm Beach: Linear & Visionless – retrieved August 2, 2006
- USA Urbanized Areas Over 500,000: 2000 Rankings – Rank by Density – URL retrieved September 5, 2006
- Lists of Census 2000 Urbanized Areas and Urban Clusters Archived June 13, 2002, at the Wayback Machine – URL retrieved August 27, 2006
- NOTE: large (2.8 MB) PDF file – UMiami, Florida Urbanized Area Outline Map, 2000 Census – URL retrieved August 27, 2006
- State-sorted list for UCs – URL retrieved August 27, 2006
- Bureau, U. S. Census. "U.S. Census website". United States Census Bureau. Retrieved July 11, 2019.
- Census Bureau – About Metropolitan and Micropolitan Statistical Areas Archived April 1, 2013, at the Wayback Machine – retrieved Dec. 19, 2013
- Census Bureau Geographic Terms and Concepts – Core Based Statistical Areas and Related Statistical Areas – retrieved Dec. 19, 2013
- Metropolitan and micropolitan statistical areas defined by the Office of Management and Budget, December 2009 – retrieved July 22, 2011
- "US Census - Miami-Dade County, Florida; Broward County, Florida; Palm Beach County, Florida".
- State:Broward Power. St. Petersburg Times. Retrieved November 14, 2006.
- 2008 General Election Results Archived October 11, 2012, at the Wayback Machine. South Florida Sun-Sentinel. Retrieved November 11, 2008.
- "sun-sentinel.com Election 2008 (Florida Presidential election results): 2008". Weblogs.sun-sentinel.com. November 4, 2008. Retrieved November 8, 2011.
- "South Florida Sun-Sentinel.com Election 2008 (Florida Presidential election results): 2008". Sun-sentinel.com. Archived from the original on December 2, 2011. Retrieved November 8, 2011.
- "Election 2004 (Florida Presidential election results): 2004". CNN. April 13, 1970. Retrieved November 8, 2011.
- "Election 2006 (Florida Gubernatorial election results): 2006". CNN. Retrieved November 8, 2011.
- "Mapping How America's Metro Areas Voted". CityLab. December 1, 2016. Retrieved April 13, 2017.
- American Community Survey Archived February 14, 2020, at Archive.today – retrieved January 4, 2007
- American Community Survey: Narrative Profile Archived October 28, 2011, at the Wayback Machine – retrieved August 27, 2007
- "Greater Miami Jewish Federation Releases New Study on Miami Jewish Population". Greater Miami Jewish Federation. Retrieved June 5, 2020.
- "Census profile: Miami-Fort Lauderdale-West Palm Beach, FL Metro Area".
- "Grid View: Table B03002 - Hispanic or Latino Origin by Race". Census Reporter.
- "Grid View: Table B02001 - Race". Census Reporter.
- "Miami Accents: Why Locals Embrace That Heavy "L" Or Not". WLRN (WLRN-TV and WLRN-FM). Retrieved September 1, 2013.
- "'Miami Accent' Takes Speakers By Surprise". Articles – Sun-Sentinel.com. June 13, 2004. Retrieved October 8, 2012.
- "Miami Accents: How 'Miamah' Turned Into A Different Sort Of Twang". WLRN (WLRN-TV & WLRN-FM). Retrieved September 1, 2013.
- Haggin, Patience. "Miami Accents: Why Locals Embrace That Heavy "L" Or Not".
- Watts, Gabriella. "Miami Accents: How 'Miamah' Turned Into A Different Sort Of Twang".
- "Archived copy". Archived from the original on December 3, 2013. Retrieved September 10, 2013.CS1 maint: archived copy as title (link)
- Hanks, Douglas (October 29, 2010). "Housing costs higher in South Florida". The Miami Herald. Retrieved February 22, 2011.
- Archived April 8, 2008, at the Wayback Machine
- Davis, Ennis. "Virgin Trains expands in Florida. Will it ever reach Jacksonville?". Sarasota Herald-Tribune. Retrieved June 5, 2020.
- Newspapers, Joshua Solomon, Treasure Coast. "Virgin Trains OKs 3 new stations in South Florida, so when will it build stations here?". The Palm Beach Post. Retrieved June 5, 2020.
- "Köppen Climate Classification Map: South Florida=Aw=tropical wet & dry". Archived from the original on July 6, 2011.
- Climate Zones of the World, under Koppen's System. Retrieved August 8, 2006.
- Weather.com Vulnerable cities: Miami, Florida Archived April 27, 2006, at the Wayback Machine. Retrieved February 19, 2006.
- Mean monthly maxima and minima (i.e. the highest and lowest temperature readings during an entire month or year) calculated based on data at said location from 1981 to 2010.
- "NOWData - NOAA Online Weather Data". National Oceanic and Atmospheric Administration. Retrieved August 21, 2012.
- "Station Name: FL WEST PALM BEACH INTL AP". National Oceanic and Atmospheric Administration. Retrieved April 13, 2018.
- Minas, Isabella. "Best Times to Visit Ft Lauderdale". travel.usnews.com. USNews. Retrieved August 23, 2018.
- Torres, Javier. "Climate Fort Lauderdale, FL". usclimatedata.com. US Climate Data. Retrieved August 24, 2018.
- Henthorn, Dawn. "Avg Monthly Temps & Rainfall in Fort Lauderdale, FL". tripsavvy.com. Retrieved August 22, 2018.
- "NowData - NOAA Online Weather Data". National Oceanic and Atmospheric Administration. Retrieved May 1, 2020.
- "Station Name: FL MIAMI INTL AP". National Oceanic and Atmospheric Administration. Retrieved January 19, 2018.
- "WMO Climate Normals for Miami, FL 1961–1990". National Oceanic and Atmospheric Administration. Retrieved October 31, 2013.
- "Monthly Averages for Miami International Airport". The Weather Channel. Retrieved October 12, 2013.
- "New first name for Ballpark of the Palm Beaches: Fitteam".
- Janes, Chelsea (February 16, 2018). "Nationals and Astros reach naming rights deal for Ballpark of the Palm Beaches" – via www.washingtonpost.com.
- "Astros, Nats rename FITTEAM Ballpark". MLB.com.
- "Congressional Districts – Florida" (Map). National Atlas of the United States (PDF). Cartography by USGS. United States Geological Survey. 2013. Archived from the original (PDF) on September 4, 2014. Retrieved August 17, 2014.
- "Partisan Voting Index Districts of the 113th Congress" (PDF). The Cook Political Report. Archived from the original (PDF) on July 29, 2017. Retrieved February 20, 2019.
- Boca Raton News home page – URL retrieved August 19, 2006
- "Diario Las Americas". Diario Las Americas. August 2, 2010. Retrieved November 8, 2011.
External links

- Populations of Metropolitan and Micropolitan Area (and rankings)
| Central business district |
|
|---|---|
| Major urban areas | |
| Colleges and universities |
|
| Parks and recreation |
|
| Attractions |
|
| Major shopping centers |
|
| Transportation |
|
| Major thoroughfares |
|
| |
Miami articles | ||
|---|---|---|
| By topic |  | |
| Neighborhoods |
| |
| Government | ||
| Emergency services | ||
| Transportation | ||
| Culture | ||
| Education | ||
Tallahassee (capital) | ||
| Topics |
| |
| History | ||
| Geography | ||
| Major hurricanes |
| |
| Society |
| |
| Regions | ||
| Metro areas |
| |
| Largest cities | ||
| Counties |
| |
