Pittsburgh-New Castle-Weirton, PA-OH-WV Combined Statistical Area
| Greater Pittsburgh | |
|---|---|
| Pittsburgh-New Castle-Weirton, PA-OH-WV Combined Statistical Area | |
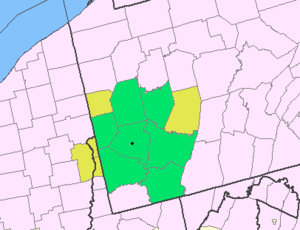 Map of metro area (MSA in green, CSA in yellow) | |
| Country | United States |
| State(s) |
Pennsylvania West Virginia Ohio |
| Largest city | Pittsburgh |
| Population | |
| • Total | 2,623,639 |
| • Rank | 21st in the U.S. |
The Pittsburgh-New Castle-Weirton, PA-OH-WV Combined Statistical Area is a 12-county Combined Statistical Area in the United States. The principal city of the area is the City of Pittsburgh, Pennsylvania but includes parts of the states of Pennsylvania, West Virginia, and Ohio and was officially defined by the U.S. Census Bureau in 2013.[1] As a CSA, the Census Bureau has identified that the region shares integrated transportation and economic ties as evidenced by commuting patterns.[2] The estimated population of the area was 2,635,228 in mid-2016.[3]
Boundaries
The following metropolitan and micropolitan statistical areas form the Pittsburgh-New Castle-Weirton, PA-OH-WV CSA.[1]
Pittsburgh, PA Metropolitan Statistical Area
- Allegheny County, PA
- Armstrong County, PA
- Beaver County, PA
- Butler County, PA
- Fayette County, PA
- Washington County, PA
- Westmoreland County, PA
Weirton-Steubenville, WV-OH Metropolitan Statistical Area
- Brooke County, WV
- Hancock County, WV
- Jefferson County, OH
New Castle, PA Micropolitan Statistical Area
- Lawrence County, PA
Indiana, PA Micropolitan Statistical Area
- Indiana County, PA
Principal cities and towns
| Rank | Name | Type | County | State | Population (2016) |
|---|---|---|---|---|---|
| 1 | Pittsburgh | city | Allegheny | PA | 303,625 |
| 2 | Penn Hills | township | Allegheny | PA | 41,555 |
| 3 | Hempfield | township | Westmoreland | PA | 41,335 |
| 4 | Mount Lebanon | township | Allegheny | PA | 32,475 |
| 5 | Bethel Park | township | Allegheny | PA | 31,911 |
| 6 | Ross | township | Allegheny | PA | 30,745 |
| 7 | Cranberry | township | Butler | PA | 30,739 |
| 8 | North Huntingdon | township | Westmoreland | PA | 30,681 |
| 9 | McCandless | township | Allegheny | PA | 28,755 |
| 10 | Shaler | township | Allegheny | PA | 28,286 |
| 11 | Monroeville | municipality | Allegheny | PA | 27,953 |
| 12 | Plum | township | Allegheny | PA | 27,399 |
| 13 | Moon | township | Allegheny | PA | 25,580 |
| 14 | Unity | township | Westmoreland | PA | 22,324 |
| 15 | Peters | township | Washington | PA | 22,143 |
| 16 | New Castle | city | Lawrence | PA | 22,142 |
| 17 | Murrysville | municipality | Westmoreland | PA | 20,042 |
| 18 | West Mifflin | borough | Allegheny | PA | 19,921 |
| 19 | Upper St. Clair | township | Allegheny | PA | 19,813 |
| 20 | Baldwin | borough | Allegheny | PA | 19,734 |
| 21 | Penn | township | Westmoreland | PA | 19,580 |
| 22 | McKeesport | city | Allegheny | PA | 19,273 |
| 23 | Weirton | city | Hancock & Brooke | WV | 18,989 |
| 24 | Hampton | township | Allegheny | PA | 18,440 |
| 25 | Steubenville | city | Jefferson | OH | 18,072 |
Demographics
Ethnic Diversity

According to the 2016 population estimates, Greater Pittsburgh is less diverse than the United States as a whole. Persons of color, or non-white Americans, represent only 13.5 percent of the region's population, compared to 38.7 percent in the United States overall.[5]
The combined statistical area has, however, seen a significant increase in Asian Americans, Hispanic or Latino Americans, and Multiracial Americans since 2010. During the same period, the African-American population has remained essentially unchanged whereas the White population continues to steadily decrease.[5]
Allegheny County is the most diverse of the twelve Pittsburgh CSA counties with persons of color representing 21 percent of the population, or 257,832 people. Armstrong County is the least diverse, with a population that is only 2.8 percent non-white.[5]
| Ethnic Group | 2010
Census |
2016
Estimate |
2010-16
Change | |||
|---|---|---|---|---|---|---|
| Total | % | Total | % | Total | % | |
| White or European American | 2,338,582 | 87.89 | 2,280,228 | 86.53 | -58,354 | -2.50 |
| Black or African American | 206,106 | 7.75 | 206,035 | 7.82 | -71 | -0.03 |
| Asian American | 43,236 | 1.62 | 56,801 | 2.15 | +13,565 | +31.37 |
| Multiracial | 36,403 | 1.37 | 44,613 | 1.69 | +8,210 | +22.55 |
| Hispanic or Latino | 33,097 | 1.24 | 43,518 | 1.65 | +10,421 | +31.49 |
| American Indian and Alaska Native | 2,803 | 0.11 | 3,074 | 0.12 | +271 | +9.67 |
| Native Hawaiian and other Pacific Islander | 500 | 0.02 | 959 | 0.04 | +459 | +91.80 |
| Total | 2,660,727 | 100.0 | 2,635,228 | 100.0 | -25,499 | -0.96 |
The 2012-16 American Community Survey estimated he region's foreign-born population at 3.4 percent. The largest plurality of this group, or 48.3 percent, were born in Asia, 27.8 percent in Europe, and 13.3 percent in Latin America. A supermajority (67.3 percent) of the region's most recent international arrivals, or those entering the country since 2010, were born in Asia.[6]
Age
| Age Group | 2010
Census |
2016
Estimate |
2010-16
Change | |||
|---|---|---|---|---|---|---|
| Total | % | Total | % | Total | % | |
| Under 18 years | 535,961 | 20.14 | 504,285 | 19.14 | -31,676 | -5.91 |
| 18 – 64 years | 1,663,500 | 62.52 | 1,624,450 | 61.64 | -39,050 | -2.35 |
| 65 years and over | 461,266 | 17.34 | 506,493 | 19.22 | +45,227 | +9.80 |
| Total | 2,660,727 | 100.0 | 2,635,228 | 100.0 | -25,499 | -0.96 |
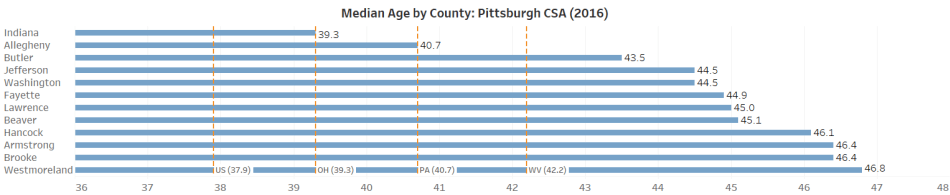
Greater Pittsburgh's population has traditionally been significantly older than the United States as a whole.[8] This is largely due to the large domestic out-migration which occurred during the steel industry's collapse in the 1970s and 1980s.[9] Most out-migrants were working age at the time and this led to the area having a much greater than average elderly population than most areas of the country at the end of the 20th Century.[8] As of the 2012-16 American Community Survey, Pittsburgh-New Castle-Weirton was the 11th oldest combined statistical area in the United States with a median age of 43 years.[10] Greater Pittsburgh's population age structure is most similar to slower growing European countries such as Belgium, Finland, Greece, and Slovenia which all have similar median ages.[11]
In recent decades, however, the growth of the oldest segments of the population has become more pronounced in the country overall and less so in Greater Pittsburgh. Between 2010 and 2016, the age 65 and over population of the region increased 9.8 percent[7] whereas that age group grew by 22.3 percent in the United States over the same time period.[12] Indiana and Allegheny counties, which both have significant college student populations, are the youngest counties in the region by median age and Allegheny County's median age has actually been declining in recent years. All of the remaining ten counties in the region have median ages well above the US and their respective states.[13]
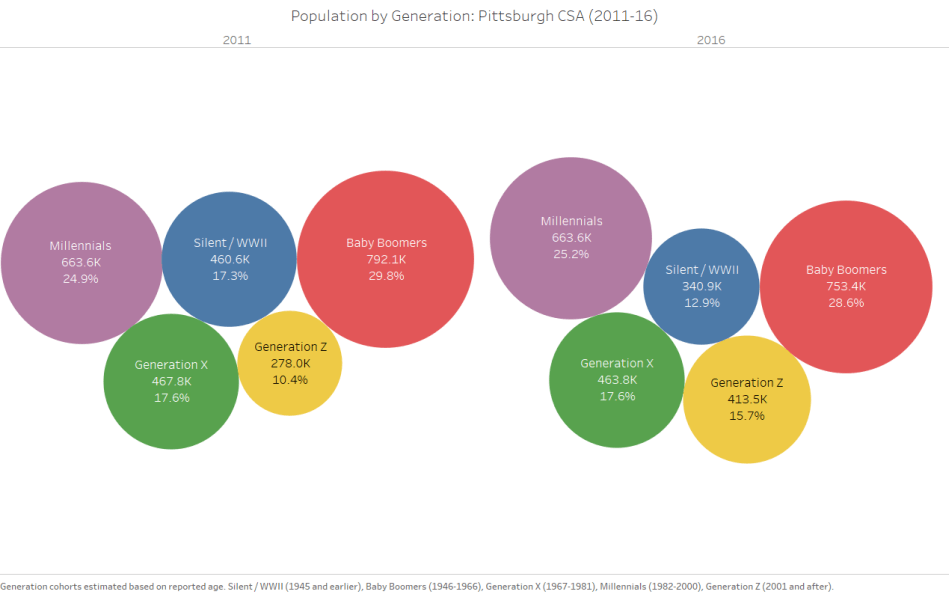
Baby Boomers continue to represent the largest generational cohort in Greater Pittsburgh with 28.6 percent of the population in 2016.[13] Millennials, along with the youngest generation, Generation Z, now represent 40.9 percent of the region's population which is roughly equal to the oldest generations (Baby Boomers, Silents, and World War II) with 41.7 percent of the population. As is the case in the United States as a whole, Millennials are now the largest generation in Allegheny and Indiana counties.
Income and Earnings
.svg.png)
| CSA
Rank |
County | 2007-11[15] | 2012-16[16] | Change | |
|---|---|---|---|---|---|
| $ | % | ||||
| 1 | Butler | $61,317 | $63,345 | +$2,028 | +3.31 |
| 2 | Washington | $55,440 | $57,534 | +$2,094 | +3.78 |
| United States | $56,290 | $55,322 | -$968 | -1.72 | |
| Pennsylvania | $55,105 | $54,895 | -$210 | -0.38 | |
| 3 | Allegheny | $53,135 | $54,357 | +$1,222 | +2.30 |
| 4 | Westmoreland | $52,254 | $54,142 | +$1,888 | +3.61 |
| Pittsburgh CSA | ‡ | $52,764 | |||
| 5 | Beaver | $51,133 | $51,887 | +$754 | +1.47 |
| Ohio | $51,285 | $50,674 | -$611 | -1.19 | |
| 6 | Brooke | $44,212 | $46,265 | +$2,053 | +4.64 |
| 7 | Armstrong | $47,650 | $45,879 | -$1,771 | -3.72 |
| 8 | Lawrence | $46,751 | $45,764 | -$987 | -2.11 |
| 9 | Indiana | $44,194 | $45,118 | +$924 | +2.09 |
| West Virginia | $42,195 | $42,644 | +$449 | +1.06 | |
| City of Pittsburgh | $39,646 | $42,450 | +$2,804 | +7.07 | |
| 10 | Jefferson | $42,091 | $42,327 | +$236 | +0.56 |
| 11 | Fayette | $39,053 | $40,511 | +$1,458 | +3.73 |
| 12 | Hancock | $40,935 | $40,316 | -$619 | -1.51 |
| ‡ CSA defined in 2013. Median income data is not available for the 2007-11 ACS.
† 2011-11 figures are adjusted for inflation to compare to 2012-16 ACS values in real terms.[17] | |||||
The wealthiest counties by median household income in Greater Pittsburgh are Butler and Washington counties.[16] Both counties have median incomes above those of the United States and Pennsylvania and have continued to experience strong income growth since the Great Recession and have benefited from being adjacent to many of the wealthiest suburbs in Allegheny County's in North and South Hills. Most counties in the region and the City of Pittsburgh showed reasonably strong gains in household income since the 2007-11 American Community Survey (ACS) whereas Pennsylvania, Ohio, and the nation as a whole saw income declines over the same time period.[15][16] This includes some of the less wealthy counties in the region, such as Fayette and Brooke counties. Despite this recent growth, however, the region's overall median household income remains slightly less than the United States overall.[16]
According to the 2012-16 ACS, there are 231 county subdivisions[18] whose median incomes are greater or equal to the region's median ($52,274).[14] The ten wealthiest districts are Sewickley Heights, Edgeworth, Ben Avon Heights, Fox Chapel, Sewickley Hills, Glen Osborne, Thornburg, Pine Township, Rosslyn Farms, and Franklin Park.[14] Seven of these municipalities are in the wealthy Sewickley Valley and North Hills areas to the north and northwest of Pittsburgh and all of them are in Allegheny County. Other high income areas in the region include southern Butler County where the townships of Cranberry and Adams have become extensions of the North Hills, and the fast-growing South Hills, including the streetcar suburb of Mount Lebanon, the post-war suburb of Upper St. Clair in Allegheny County, and the more recently developed areas surrounding the Southpointe office complex such as Peters and Cecil townships in northern Washington County.
There are a greater number of districts (294) in the region, however, which have median household incomes below the Greater Pittsburgh median.[14] The ten districts with the lowest median household incomes are Duquesne, Braddock, Homestead, Rankin, Wilmerding, Arnold, East Pittsburgh, McKeesport, Uniontown, and Karns City.[14] Seven of these districts are also in Allegheny County clustered in the largely deindustrialized Mon Valley and Turtle Creek Valley areas. Other areas with significantly low household incomes are several rural municipalities in far northern Butler, Armstrong, and Indiana counties as well as most of eastern and northern Fayette County which all have less accessibility to the regions main employment centers. The former mill towns of the Beaver Valley as well as the cities of New Castle, Steubenville, and Weirton, and their environs also have noticeably low median household income compared to the rest of the region.
References
- 1 2 Bureau, US Census. "Delineation Files". www.census.gov. Retrieved 2018-02-01.
- ↑ Geography, US Census Bureau. "Geography Atlas - Combined Statistical Areas". www.census.gov. Retrieved 2018-02-01.
- ↑ Bureau, U.S. Census. "American FactFinder - Results". factfinder.census.gov. Retrieved 2018-02-01.
- ↑ Bureau, US Census. "City and Town Population Totals: 2010-2016". www.census.gov. Retrieved 2018-02-04.
- 1 2 3 4 5 Bureau, US Census. "County Population Totals and Components of Change: 2010-2016". www.census.gov. Retrieved 2018-02-09.
- ↑ "U.S. Census Bureau, 2012-2016 American Community Survey 5-Year Estimates". Retrieved 8 February 2018.
- 1 2 Bureau, U.S. Census (2017-06-01). "Annual Estimates of the Resident Population for Selected Age Groups by Sex for the United States, States, Counties and Puerto Rico Commonwealth and Municipios: April 1, 2010 to July 1, 2016". factfinder.census.gov. Retrieved 2018-02-17.
- 1 2 Kotkin, Joel. "Aging America: The Cities That Are Graying The Fastest". Forbes. Retrieved 2018-02-17.
- ↑ Briem, Christopher. "Economic Restructuring in the Pittsburgh Region" (PDF). Retrieved 2018-02-17.
- ↑ Bureau, U.S. Census. "2012-2016 American Community Survey 5-Year Estimates". factfinder.census.gov. Retrieved 2018-02-18.
- ↑ "These maps show where the world's youngest and oldest people live". Public Radio International. Retrieved 2018-02-18.
- ↑ Bureau, U.S. Census (2017-06-01). "Annual Estimates of the Resident Population for Selected Age Groups by Sex for the United States, States, Counties and Puerto Rico Commonwealth and Municipios: April 1, 2010 to July 1, 2016". factfinder.census.gov. Retrieved 2018-02-18.
- 1 2 3 4 Bureau, US Census. "County Population by Characteristics: 2010-2016". www.census.gov. Retrieved 2018-02-18.
- 1 2 3 4 5 Manson, Steven; Schroeder, Jonathan; Van Ripper, David; Ruggles, Steven (2017). "IPUMS National Historical Geographic Information System: Version 12.0 [Database]". IPUMS NHGIS. Minneapolis: University of Minnesota. doi:10.18128/d050.v12.0.
- 1 2 Bureau, U.S. Census. "2007-2011 American Community Survey 5-Year Estimates". factfinder.census.gov. Retrieved 2018-02-19.
- 1 2 3 4 Bureau, U.S. Census. "2012-2016 American Community Survey 5-Year Estimates". factfinder.census.gov. Retrieved 2018-02-19.
- ↑ Bureau, US Census. "Current versus Constant (or Real) Dollars". www.census.gov. Retrieved 2018-02-19.
- ↑ Please note that the US Census bureau uses municipalities as county subdivisions in Ohio and Pennsylvania but magisterial districts are used in West Virginia.
.svg.png)
Harrisburg (capital) | |
| Topics |
|
| Society | |
| Metro areas | |
| Largest cities | |
| Largest municipalities |
|
| Regions |
|
| Counties |
|
Charleston (capital) | ||
| Topics | ||
| Society |
| |
| Insignia | ||
| Regions |
| |
| Metro areas | ||
| Largest cities | ||
| Counties |
| |
Columbus (capital) | ||
| Topics |
|  |
| Society | ||
| Regions | ||
| Metro areas | ||
| Largest cities | ||
| Counties |
| |